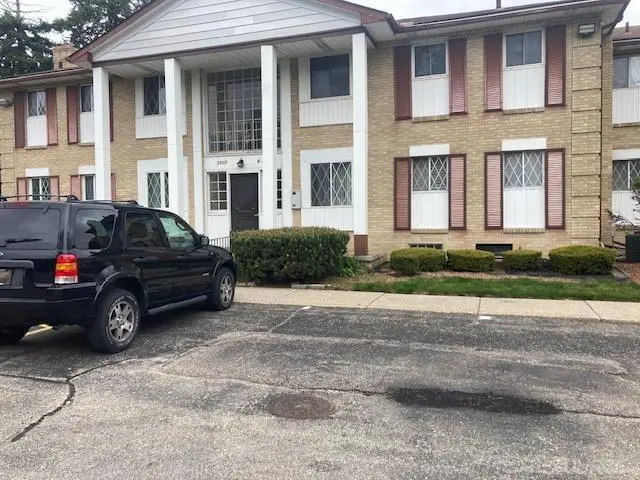
29217 Hayes #2 Rd · Warren, MI
Flood risk 1/10 · Minimal
- FEMA flood zone
- X (unshaded)
- Chance of flooding over 30 yrs
- 0.0%
- Est. flood insurance / yr
- $507 – $1,088
Fire risk 1/10 · Minimal
- Est. fire insurance / yr
- $784 – $1,456
Heat risk 3/10 · Minor
- Hot days now (above 96°F)
- 7 days/yr
- Hot days in 30 yrs
- 15 days/yr
Wind risk 1/10 · Minimal
- Chance of severe wind over 30 yrs
- —
Air-quality risk 3/10 · Minor
- Unhealthy air days now
- 3 days/yr
- Unhealthy air days in 30 yrs
- 4 days/yr
Risk factors via First Street. Map © Google.
Why this score? — see what drove the C+ grade
The composite is a weighted blend of 9 inputs, each scored 0–100. Each bar is that input's sub-score; the figure is the points it added to the 100-point composite (weight × sub-score).
- Cash flow +21.4/30.0
- ARV discount +11.7/15.0
- 1% rule +10.0/10.0
- DSCR +6.8/10.0
- Livability +3.7/5.0
- Schools +2.7/10.0
- Rent growth +2.5/5.0
- Condition / age +2.2/5.0
- Appreciation +0.0/10.0
$72,900
🖨 Deal sheet (PDF) 📄 Offer letter ✓ Due diligence
Listing remarks
2000.00 PRICE REDUCTION!! Rare 1ST FLOOR Deluxe Condo which offers views of Your Own CARPORT and the Beautiful Park like setting looking out your Door Wall at Enticing Courtyard, also providing a cross breeze through the unit if desired. Your Bright Living area, with HARDWOOD floors under carpet has ample room and leads you out to your private Patio for relaxation and enjoyment. The kitchen area is large with ample dining area, (All appliances Included). The Large Bedroom includes a walk-in closet and allows for large furnishings. The Full bath is oversized and comfortable. Additional storage in the well lighted lower level with common laundry facility. Association Fee includes gas and wate
Key facts
- 1st floor
- Walk-in closet
- Carport
Tags
Property features AI
Finance
- Other: Pets allowed (contact for details); Public maintained road; Subdivision: LANCASTER WOODS
- HOA & community: Homeowners association with monthly fee; Monthly association fee covers gas, grounds maintenance, snow removal, trash and water; Community amenities include clubhouse, pool, and laundry
Exterior
- Parking: Carport
- Utilities: Public water; Public sewer
- Home design: Residential condominium; One story
- Construction: Brick construction; Block foundation; Built with an above-grade finished area of 729 (square feet)
- Exterior features: Patio; Porch; Community outdoor pool
Interior
- Kitchen: Oven; Range; Refrigerator
- Bedrooms: 4 total rooms (includes bedrooms and living areas)
- Bathrooms: 1 full bathroom
- Heating & cooling: Forced air heating (natural gas); Central air conditioning
- Interior features: Eat-in kitchen; Block basement
- Laundry & utility: Common area laundry; Gas water heater
Neighborhood map
What this means for you Summary
Snapshot
- This is a 1-bed/1.0-bath condo listed at $73k. Condition is rated fair.
Deal economics
- At list price, monthly cash flow is $108 ($1k/yr) — positive.
- The deal already cash-flows at list — no discount required.
- Meets the 1% rule at list price ($1k rent vs $73k).
- Recommended offer: $72k (1.5% below list) — sets the bar for market timing.
- Cap rate 8.1% vs local median 5.2% in Warren — top-decile yield for the area; either an underpriced asset or a hidden risk that comps aren't pricing in. Stress-test before assuming the spread holds.
Location & tenants
- Location reads 74/100 on livability (#171 in MI, #4,491 nationally) — a middle-class / working-renter tenant base. Strengths: commute A+, cost of living A+, housing A+; Watch: schools D, amenities D, employment D.
- Warren Woods Public Schools (urban): math 23% / reading 40% proficiency, ranked #336 of 540 in MI (top 62%) — families likely to look elsewhere, expect single-tenant / working-renter base with shorter leases.
- Market conditions: 109 active listings in the ZIP; 4 comparable units currently listed for rent nearby; rentals lingering (median 45d on market — plan ~5-8 weeks vacancy on turnover, expect pricing pressure); 75% of comp listings sitting > 30 days — soft ceiling on asking rent; 1,321 units permitted in Macomb County in 2024 (86 in 5+ unit buildings).
Forward outlook
- Local home prices are declining (-3.0%/yr); year-one equity from $504 of loan paydown is wiped out by about $2k of value loss. Plan a longer hold.
- Macomb County population projected at +9% by 2050 — modest demand growth; plan on rents tracking national, not racing it.
Negotiation context
- It's been on market 16 days — a 2% lower offer ($72k) is reasonable based on typical stale-listing flexibility.
- 22 sale attempts since 29y ago with the ask held roughly flat each time — persistent listings suggest the price (not the market) is what's stuck; bring a comps-based counter.
- Current owner paid $58k; 27% above their basis — modest negotiation headroom, anchor on the comps not their cost.
Risks & watch-outs
- Watch-outs: HOA is 29% of rent.
Questions for the listing agent
- Have any recent inspections been done? Can we get a copy of the seller's disclosures and any deferred-maintenance estimates?
- Built in 1968 — when were the roof, HVAC, electrical panel, plumbing, and water heater last replaced?
- What does the HOA fee cover, when was the last increase, and are there any pending special assessments or reserve-fund shortfalls?
- Any open or pending special assessments — roof, HVAC, plumbing, elevator, façade? What's the per-unit balance and payoff schedule, and is the seller paying it off at close or rolling it to the buyer?
- Is there a deadline driving the sale (1031 exchange, divorce, estate, relocation)? That informs how much negotiation room exists.
- Schools are D-rated, which usually means shorter tenancies and higher turnover. Who's the typical renter profile here, and what's been the actual vacancy rate?
- Crime grade is D in this area — have there been break-ins, vandalism, or insurance claims at this property in the last 3 years? What carrier currently insures it and at what premium?
- What's the average days-on-market for RENTAL listings here right now (not sales)? A rising rental-DOM trend means longer vacancies and softer asking-rent achievability than the comps imply.
- What's the recent tenant-quality profile in this submarket — average credit score on applications, eviction rate, late-payment / NSF rate, and stable-employment percentage? A property-management company in the area should have these aggregated.
- How much new apartment / multifamily construction is in the pipeline within 1–3 miles? Heavy new supply (>2% of stock underway) typically softens rents 12–24 months out; light construction supports rent growth.
Investment metrics
- 1% rule
- 1.67% ✓
- Cap rate
- 8.08%
- Cash-on-cash
- 6.37%
- DSCR
- 1.28
- GRM
- 5.0
CMA / ARV
- ARV (median comp)
- $80,359
- List price
- $72,900
- Delta
- -6.79%
- Verdict
- FAIR
- Comps
- 20 within 1.0 mi
Projected returns pro-forma
-3.0% appreciation · 3.0% rent growth · sell at horizon
- IRR
- -6.2%
- Equity multiple
- 0.77×
- Total profit
- $-4,685
- Equity at exit
- $10,870
- IRR
- 3.8%
- Equity multiple
- 1.28×
- Total profit
- $5,744
- Equity at exit
- $6,303
Cash invested: $20,412 (down + closing). Projections, not guarantees.
Landlord ↔ Tenant lean methodology
- Overall (STATE)
- 62 Landlord-Friendly
- State Michigan
- 62 Landlord-Friendly · EVEN
- County
- — inherits STATE
- City
- — inherits STATE
ZIP-level market 48088
- Active inventory
- 109
- Price-to-rent
- 5.0×
Monthly cashflow live
- Estimated rent
- $1,215 medium interval (Pro) →
- Mortgage (P&I)
- −$382
- Tax est. 1.5%
- −$91 /mo · $1,094/yr
- Insurance
- −$30
- HOA
- −$348
- Vacancy / Maint / Mgmt
- −$255
- Net cashflow
- $108
Break-even live
Sensitivity live
| Price | -10% $159 | -5% $133 | +0% $108 | +5% $83 | +10% $58 |
|---|---|---|---|---|---|
| Rent | -10% $12 | -5% $60 | +0% $108 | +5% $156 | +10% $204 |
| Rate | -1.0pp $145 | -0.5pp $127 | base $108 | +0.5pp $89 | +1.0pp $70 |
UW: 25.0% down · 7.5% · 30yr · 1.5% tax · 5.0% vac · 8.0% maint · 8.0% mgmt
Financing live
Cash to close
- Down payment
- $18,225
- Closing costs
- $2,187
- Reserves months
- —
- Total cash needed
- —
Loan-product check · same deal, 3 products live
Conventional
25% down · 7.5% · 30yr
- Down + closing
- —
- Monthly P&I
- —
- Monthly cashflow
- —
- DSCR
- —
- Eligible?
- —
Personal DTI + credit; lowest rate.
DSCR
20% down · 8.5% · 30yr
- Down + closing
- —
- Monthly P&I
- —
- Monthly cashflow
- —
- DSCR
- —
- Eligible?
- —
No personal income docs; deal must DSCR.
Hard money
10% down · 12.0% · 12mo
- Down + closing
- —
- Monthly P&I
- —
- Monthly cashflow
- —
- DSCR
- —
- Eligible?
- —
Short-term bridge; refi at stabilization.
Rent comps 4 comps
| Address | Beds | Baths | Sqft | Rent | $/sqft | DOM | Units | Dist |
|---|---|---|---|---|---|---|---|---|
| 29157 Hayes Rd Warren, MI | 1.0 | 1.0 | 720 | $1,250 | $1.74 | 44d | 1 | 0.07mi |
| 16425 12 Mile Rd Roseville, MI | 1.0 | 1.0 | 600 | $950 | $1.58 | 44d | 1 | 0.80mi |
| 16435 Twelve Mile Rd Roseville, MI | 1.0 | 1.0 | 600 | $950 | $1.58 | 44d | 1 | 0.82mi |
| 28368 Rosemont St Roseville, MI | 2.0 | 1.0 | 696 | $1,500 | $2.16 | 22d | 1 | 1.39mi |
HOA detail condo
- Monthly dues
- $348 · $4,176/yr
- Likely covers
- gas
- Assessments
- None detected in remarks — confirm with the listing agent.
Listing history 50 events
-
2026-06-18days on market $72,900 Active 16 DOM
-
2026-06-17days on market $72,900 Active 15 DOM
-
2026-06-16days on market $72,900 Active 14 DOM
-
2026-06-15days on market $72,900 Active 13 DOM
-
2026-06-13days on market $72,900 Active 11 DOM
-
2026-06-13days on market $72,900 Active 10 DOM
-
2026-06-09days on market $72,900 Active 7 DOM
-
2026-06-08days on market $72,900 Active 6 DOM
-
2026-06-07days on market $72,900 Active 5 DOM
-
2026-06-04days on market $72,900 Active 2 DOM
-
2026-06-02pricedays on market $72,900 Active 1 DOM
-
2026-06-01days on market $74,900 Active 17 DOM
-
2026-05-31days on market $74,900 Active 16 DOM
-
2026-05-15$74,900 Active 813-char remark
-
2026-05-15$74,900 Active 813-char remark
-
2024-12-27historical
-
2024-12-27historical
-
2024-11-21historical
-
2024-11-21historical
-
2024-11-20price $89,900
-
2024-11-20$89,900 Active
-
2024-11-20$89,900 Active
-
2024-11-09historical
-
2024-11-09historical
-
2024-11-08$91,900 Active
-
2024-11-08$89,900
-
2024-11-08price $91,900
-
2024-11-02historical
-
2024-11-02historical
-
2024-11-01$93,000 Active
-
2024-11-01$91,900
-
2024-10-30price $93,000
-
2024-10-26$93,000
-
2024-10-26$94,900 Active
-
2021-04-21soldstatus $57,550 Sold
-
2021-04-21soldstatus $57,550 Closed
-
2021-04-01status Pending
-
2021-04-01status Pending
-
2021-03-29$55,900 Active
-
2021-03-29$55,900 Active
-
2014-04-25soldstatus $18,000
-
2014-04-25soldstatus $18,000
-
2014-03-25historical
-
2013-11-21$22,300
-
2013-11-21$22,300
-
2009-04-02soldstatus $1,535
-
2008-12-18historical
-
2008-12-05$15,000
-
2006-08-25historical
-
2006-02-25$49,900
ⓘ Source: listings_history table (triggers on properties + properties_extension) + one-shot
backfill from property_details.listing_events for pre-trigger history.
Climate risk First Street
- Flood 1/10 Low FEMA zone X (unshaded) · 0% chance over 30 yrs
- Wildfire 1/10 Low
- Heat 3/10 Moderate 7 d/yr ≥96°F today · 15 d/yr by 30 yrs out
- Wind 1/10 Low
- Air quality 3/10 Moderate 3 unhealthy d/yr today · 4 by 30 yrs out
Nearby sold comps map
Loading sold comps map…
Walkable amenities ~0.75 mi
Loading nearby amenities…
Taxation est. · year 1
- Rental income
- $14,583
- − Mortgage interest
- −$4,084
- − Property taxes
- −$1,094
- − Insurance
- −$364
- − Repairs & maintenance
- −$1,167
- − Management
- −$1,167
- − HOA
- −$4,176
- − Depreciation
- −$2,121
- Taxable income
- $412
- Est. tax owed @ 24.0%
- −$99
- After-tax cash flow
- $1,200/yr
For passive investors: Depreciation is non-cash, so a rental often shows a tax loss while cash-flowing — sheltering income. Rental losses are passive: they offset passive income freely, and up to $25,000/yr can offset ordinary (W-2) income if you actively participate and your MAGI is under $100k (phasing out to $0 by $150k); unused losses carry forward. On sale, claimed depreciation is recaptured at up to 25%, and gains may owe capital-gains tax (a 1031 exchange can defer both). Figures are a year-1 estimate at your 24.0% rate — not tax advice; consult a CPA.
Condition & rehab AI · 13 photos
This 1st floor condo requires moderate repairs and maintenance to improve its condition and value. Updates to the kitchen and bathroom, along with exterior painting and landscaping, would significantly enhance its appeal to buyers and renters.
Repairs flagged
- Moderate Kitchen cabinets — Worn and dated appearance.
- Moderate Kitchen countertops — Worn and dated appearance.
- Moderate Bathroom fixtures — Standard fixtures, but dated design.
- Minor Exterior siding — Some discoloration, but not severe enough to warrant immediate attention.
Value-add opportunities
- Resale Update kitchen cabinets and countertops — Fresh, modern kitchen will attract more buyers.
- Resale Replace bathroom fixtures — Modern fixtures will appeal to potential buyers.
- Resale Paint exterior siding — Fresh paint will improve curb appeal and home value.
- Both Landscaping improvements — Well-maintained landscaping will enhance both resale and rental value.
- Rental HVAC maintenance — A well-maintained HVAC system will attract renters and reduce maintenance costs.
Renovation cost estimate screening
| Repair item | Severity | Est. cost |
|---|---|---|
| Kitchen cabinets · Worn and dated appearance. | Moderate | $3,000–15,000 |
| Kitchen countertops · Worn and dated appearance. | Moderate | $3,000–15,000 |
| Bathroom fixtures · Standard fixtures, but dated design. | Moderate | $3,000–15,000 |
| Exterior siding · Some discoloration, but not severe enough to warrant immediate attention. | Minor | $500–3,000 |
| Total estimated repair cost · 4 items | $9,500–48,000 |
Value-add ROI direction
- Resale Update kitchen cabinets and countertops — Fresh, modern kitchen will attract more buyers. ↑
- Resale Replace bathroom fixtures — Modern fixtures will appeal to potential buyers. ↑
- Resale Paint exterior siding — Fresh paint will improve curb appeal and home value. ↑
- Both Landscaping improvements — Well-maintained landscaping will enhance both resale and rental value. ↑
- Rental HVAC maintenance — A well-maintained HVAC system will attract renters and reduce maintenance costs. ↑
ⓘ Cost ranges are severity-bucket heuristics (US national rule-of-thumb). Get contractor quotes + a written scope before underwriting a rehab budget.
Schools (NCES district)
- District
- Warren Woods Public Schools
- NCES district ID
- 2635220
- Math proficiency
- 23% ▼ -9.00%
- Reading proficiency
- 40% ▼ -5.00%
- Median HH income
- $49,013
- Composite
- 27.29/100
- National rank
- #7003
- State rank
- #336 of 540 in MI
Livability — Warren
- Score
- 74/100
- State rank
- #171
- US rank
- #4491
Category grades
Schools grade is shown separately in the Schools card above.
Census & demographics
- Census place
- Warren, MI
- City population
- 114,937
- Population (ZIP)
- 23,443
Population outlook (Macomb County) Hauer SSP2
- Today (2025)
- 925,296 people
- By 2030
- 948,226 · +2.5%
- By 2040
- 983,961 · +6.3%
- By 2050
- 1,010,200 · +9.2%
- By 2075
- 1,076,222 · +16.3%
- By 2100
- 1,077,065 · +16.4%
Race, ethnicity, and origin ACS 2023
- Neighborhood character
- Predominantly White (74%)
- Race & ethnicity
- White 74% Black 13% Asian 6% Hispanic / Latino 5% Two or more races 5%
- Common ancestry
- Romanian 14% Lithuanian 4% Slovak 2%
- Foreign-born
- 11% · Canada
- Languages at home
- 84% English-only · Arabic 4% Other Indo-European 3% Spanish 3%
Political lean MEDSL · Macomb
- 2024 margin
- R (+13.7) · D 42.2% · R 55.9% · Other 1.9%
- 2008→2024 swing
- -22.3pp toward R · 2008: 8.6pp · 2024: -13.7pp
- All cycles
- 2024: R+13.7 2020: R+8.1 2016: R+11.6 2012: D+4.0 2008: D+8.6
Not yet ingested
- Civics
- —
Market trends
- HPI YoY
- ▼ -213.65%
- Current HPI
- 206.4018
- Rent YoY
- —
- Metro
- —
- State GDP YoY
- ▲ 1.37%
- F500 in state
- 28
Industry mix (Fortune 500 HQ in MI)
| Industry | F500 HQs | Revenue |
|---|---|---|
| Automotive Parts | 3 | $48B |
|
||
| Automotive | 2 | $372B |
|
||
| Chemicals | 1 | $45B |
|
||
| Automotive Retail | 1 | $29B |
|
||
| Healthcare / Medical Devices | 1 | $23B |
|
||
| Automotive Technology | 1 | $20B |
|
||
Price history
+69.5% since first listed54 events — show timeline
- 2026-06-03 Listing Removed — MiRealSource-MiMLS
- 2026-06-03 Listing Removed — REALCOMP
- 2026-06-02 Price Changed $72,900 MiRealSource-MiMLS
- 2026-06-02 Price Changed $72,900 REALCOMP
- 2026-06-02 Listed $72,900 MiRealSource-MiMLS
- 2026-06-02 Listed $72,900 REALCOMP
- 2026-05-15 Listed $74,900 MiRealSource-MiMLS
- 2026-05-15 Listed $74,900 REALCOMP
- 2024-12-27 Listing Removed — REALCOMP
- 2024-12-27 Listing Removed — MiRealSource-MiMLS
- 2024-11-21 Listing Removed — MiRealSource-MiMLS
- 2024-11-21 Listing Removed — REALCOMP
- 2024-11-20 Price Changed $89,900 MiRealSource-MiMLS
- 2024-11-20 Listed $89,900 MiRealSource-MiMLS
- 2024-11-20 Listed $89,900 REALCOMP
- 2024-11-09 Listing Removed — REALCOMP
- 2024-11-09 Listing Removed — MiRealSource-MiMLS
- 2024-11-08 Listed $89,900 REALCOMP
- 2024-11-08 Listed $91,900 MiRealSource-MiMLS
- 2024-11-08 Price Changed $91,900 MiRealSource-MiMLS
- 2024-11-02 Listing Removed — REALCOMP
- 2024-11-02 Listing Removed — MiRealSource-MiMLS
- 2024-11-01 Listed $91,900 REALCOMP
- 2024-11-01 Listed $93,000 MiRealSource-MiMLS
- 2024-10-30 Price Changed $93,000 MiRealSource-MiMLS
- 2024-10-26 Listed $93,000 REALCOMP
- 2024-10-26 Listed $94,900 MiRealSource-MiMLS
- 2021-04-21 Sold (MLS) $57,550 MiRealSource-MiMLS
- 2021-04-21 Sold (MLS) $57,550 REALCOMP
- 2021-04-01 Pending — MiRealSource-MiMLS
- 2021-04-01 Pending — REALCOMP
- 2021-03-29 Listed $55,900 MiRealSource-MiMLS
- 2021-03-29 Listed $55,900 REALCOMP
- 2014-04-25 Sold (MLS) $18,000 MiRealSource-MiMLS
- 2014-04-25 Sold (MLS) $18,000 REALCOMP
- 2014-03-25 Listing Removed — MiRealSource-MiMLS
- 2013-11-21 Listed $22,300 MiRealSource-MiMLS
- 2013-11-21 Listed $22,300 REALCOMP
- 2009-04-02 Sold (MLS) $1,535 MiRealSource-MiMLS
- 2008-12-18 Listing Removed — MiRealSource-MiMLS
- 2008-12-05 Listed $15,000 MiRealSource-MiMLS
- 2006-08-25 Listing Removed — MiRealSource-MiMLS
- 2006-02-25 Listed $49,900 MiRealSource-MiMLS
- 2005-04-15 Sold (MLS) $56,000 MiRealSource-MiMLS
- 2005-03-18 Listing Removed — MiRealSource-MiMLS
- 2005-03-12 Listed $58,000 MiRealSource-MiMLS
- 2004-12-31 Listing Removed — MiRealSource-MiMLS
- 2004-07-14 Listed $59,900 MiRealSource-MiMLS
- 2003-06-13 Sold (MLS) $61,000 MiRealSource-MiMLS
- 2003-06-12 Listing Removed — MiRealSource-MiMLS
- 2003-05-15 Listed $64,900 MiRealSource-MiMLS
- 1997-06-06 Sold (MLS) $43,000 MiRealSource-MiMLS
- 1997-04-05 Listing Removed — MiRealSource-MiMLS
- 1997-03-29 Listed $42,999 MiRealSource-MiMLS
Cash-flow waterfall
monthlySold comps — $/sqft
last 12 mo · ≤1 miLoading sold comps…