5705 Holiday Park Blvd · North Port, FL
Flood risk 8/10 · Major
- FEMA flood zone
- X (shaded)
- Chance of flooding over 30 yrs
- 0.97%
- Est. flood insurance / yr
- $507 – $1,088
Fire risk 1/10 · Minimal
- Est. fire insurance / yr
- $947 – $1,759
Heat risk 10/10 · Severe
- Hot days now (above 107°F)
- 7 days/yr
- Hot days in 30 yrs
- 26 days/yr
Wind risk 10/10 · Severe
- Chance of severe wind over 30 yrs
- 99.0%
Air-quality risk 3/10 · Minor
- Unhealthy air days now
- 2 days/yr
- Unhealthy air days in 30 yrs
- 3 days/yr
Risk factors via First Street. Map © Google.
Why this score? — see what drove the C+ grade
The composite is a weighted blend of 9 inputs, each scored 0–100. Each bar is that input's sub-score; the figure is the points it added to the 100-point composite (weight × sub-score).
- Cash flow +22.6/30.0
- 1% rule +10.0/10.0
- ARV discount +7.5/15.0
- DSCR +7.2/10.0
- Schools +5.4/10.0
- Livability +3.8/5.0
- Rent growth +2.6/5.0
- Condition / age +2.5/5.0
- Appreciation +0.0/10.0
$99,000
🖨 Deal sheet (PDF) 📄 Offer letter ✓ Due diligence
Listing remarks
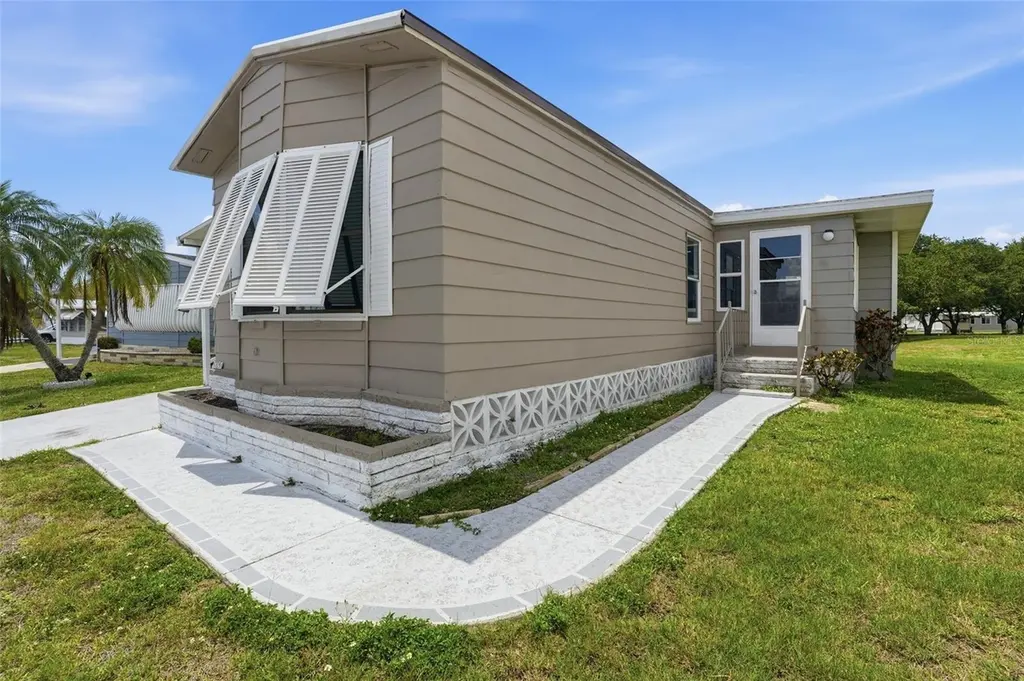
Enjoy affordable Florida living in this well-maintained manufactured home located in the active 55+ community of Holiday Park in North Port. Featuring 2 bedrooms, 2 bathrooms, and an open-concept layout, this home offers comfortable living spaces, abundant natural light, and low-maintenance finishes throughout. With inviting indoor-outdoor spaces and access to a wide variety of community amenities, this property is perfect for enjoying the Southwest Florida lifestyle year-round. RESIDENCE OVERVIEW: • 2 Bedrooms | 2 Bathrooms • Located in the 55+ community of Holiday Park • Open-concept floor plan • Luxury vinyl flooring throughout • Screened patio with attached
Key facts
- Screened patio
- Community amenities
- Two community pools
Tags
Property features AI
Finance
- Other: Lease restrictions apply
- HOA & community: HOA: Holiday Park, Park & Recreation District; Monthly HOA $195 (annual $2,340); fee required and association approval required; Association covers common area taxes, pool, grounds maintenance and management; Community amenities include clubhouse, fitness center, pool, tennis, racquetball, pickleball, shuffleboard and recreation facilities; Senior community; buyer approval required; Pets allowed (cats and dogs), max pet weight 30 lb
Exterior
- Parking: Driveway; 1-car carport
- Utilities: Public water; Public sewer; Electricity connected; Cable available; High‑speed internet available; Sewer connected; Water connected
- Home design: Manufactured single-wide home; One story; Faces south
- Construction: Vinyl siding; Metal roof; Block foundation; Built area (per records) 844 living area; 1,665 building area
- Exterior features: Awnings; Exterior lighting; Trees and landscaped yard; Paved driveway and roads
Interior
- Kitchen: Dishwasher; Microwave; Refrigerator; Solid surface counters; Eat-in kitchen
- Bedrooms: 2 bedrooms
- Bathrooms: 2 full bathrooms
- Heating & cooling: Heat pump; Central air
- Interior features: Ceiling fans; Eat-in kitchen; Kitchen/family room combo; Open floor plan; Solid surface counters; Thermostat
- Laundry & utility: Laundry inside; Electric water heater; Water softener
Neighborhood map
What this means for you Summary
Snapshot
- This is a 2-bed/2.0-bath manufactured listed at $99k.
Deal economics
- At list price, monthly cash flow is $101 ($1k/yr) — positive.
- The deal already cash-flows at list — no discount required.
- Meets the 1% rule at list price ($2k rent vs $99k).
- Recommended offer: $98k (1.5% below list) — sets the bar for market timing.
- Cap rate 8.3% vs local median 3.8% in North Port — top-decile yield for the area; either an underpriced asset or a hidden risk that comps aren't pricing in. Stress-test before assuming the spread holds.
Location & tenants
- Location reads 75/100 on livability (#252 in FL, #3,975 nationally) — a middle-class / working-renter tenant base. Strengths: crime A+, housing A+, health & safety A+; Watch: amenities F, commute F.
- Sarasota (urban): math 63% / reading 63% proficiency, ranked #7 of 73 in FL (top 10%) — acceptable for families but not a draw, mixed tenant base, ~2y average lease.
- Zoned schools: Toledo Blade Elementary School (math 71% / reading 67%, grade A-, #399 of 2,144 statewide, top 19%, 799 students, 57% FRL); Heron Creek Middle School (math 54% / reading 52%, grade C+, #209 of 571 statewide, top 37%, 902 students, 72% FRL); North Port High School (math 44% / reading 57%, grade D+, #171 of 667 statewide, top 26%, 2,562 students, 54% FRL) — zoned schools average 61% FRL vs 42% district-wide (19 pts higher); higher-poverty schools than district average — tighter screening recommended.
- Market conditions: Rents flat; 857 active listings in the ZIP; 1 comparable units currently listed for rent nearby; 7,466 units permitted in Sarasota County in 2024 (2,138 in 5+ unit buildings).
- This rent runs 31% of the median local income ($63k/yr) — at the standard rent-burdened threshold; future hikes will face affordability resistance.
Forward outlook
- Local home prices are declining (-3.0%/yr); year-one equity from $684 of loan paydown is wiped out by about $3k of value loss. Plan a longer hold.
- Sarasota County population projected at +20% by 2050 — long-run rental-demand tailwind backs the buy-and-hold thesis.
Negotiation context
- It's been on market 30 days — a 2% lower offer ($98k) is reasonable based on typical stale-listing flexibility.
- 2 sale attempts with the ask held roughly flat each time — persistent listings suggest the price (not the market) is what's stuck; bring a comps-based counter.
- Current owner paid $60k; list at $99k implies a 65% gain — meaningful room to come down on a strong offer.
Risks & watch-outs
- Watch-outs: property tax is 4.5% of price; flood insurance adds $66/mo.
- Climate carrying-cost: severe flood risk; severe wind risk, 99% chance of damaging wind over 30y; extreme-heat days projected 7→26/yr by 2055 (HVAC capex compounding) — expect insurance premiums to compound above CPI over the hold.
Questions for the listing agent
- Property tax is high relative to price — has the assessment been appealed recently, and will the sale trigger a re-assessment?
- What's the actual annual flood-insurance premium (NFIP or private), and is the property in a SFHA with mandatory coverage?
- What does the HOA fee cover, when was the last increase, and are there any pending special assessments or reserve-fund shortfalls?
- Is there a deadline driving the sale (1031 exchange, divorce, estate, relocation)? That informs how much negotiation room exists.
- Schools are B-rated — typically a magnet for longer-tenancy family renters. What's the average tenant stay here, and is there a school-zone premium baked into asking?
- What's the average days-on-market for RENTAL listings here right now (not sales)? A rising rental-DOM trend means longer vacancies and softer asking-rent achievability than the comps imply.
- What's the recent tenant-quality profile in this submarket — average credit score on applications, eviction rate, late-payment / NSF rate, and stable-employment percentage? A property-management company in the area should have these aggregated.
- How much new for-sale + rental construction is in the pipeline within 1–3 miles? Heavy new supply typically softens prices + rents 12–24 months out; constrained supply supports both.
Investment metrics
- 1% rule
- 1.65% ✓
- Cap rate
- 8.33%
- Cash-on-cash
- 7.27%
- DSCR
- 1.32
- GRM
- 5.0
CMA / ARV
No comps found within radius.
Projected returns pro-forma
-3.0% appreciation · 0.26% rent growth · sell at horizon
- IRR
- -14.3%
- Equity multiple
- 0.51×
- Total profit
- $-13,639
- Equity at exit
- $14,761
- IRR
- -15.5%
- Equity multiple
- 0.31×
- Total profit
- $-19,253
- Equity at exit
- $8,560
Cash invested: $27,720 (down + closing). Projections, not guarantees.
Landlord ↔ Tenant lean methodology
- Overall (STATE)
- 87 Strongly Landlord-Friendly
- State Florida
- 87 Strongly Landlord-Friendly · R+3
- County
- — inherits STATE
- City
- — inherits STATE
ZIP-level market 34287
- Home prices YoY
- -20.1%
- Rents YoY
- 0.3%
- Active inventory
- 857
- Price-to-rent
- 5.0×
Monthly cashflow live
- Estimated rent
- $1,637 medium interval (Pro) →
- Mortgage (P&I)
- −$519
- Tax from tax record
- −$370 /mo · $4,436/yr
- Insurance
- −$41
- Flood insurance flood zone
- −$66 /mo · $798/yr
- HOA
- −$195
- Vacancy / Maint / Mgmt
- −$344
- Net cashflow
- $101
Break-even live
Sensitivity live
| Price | -10% $157 | -5% $129 | +0% $101 | +5% $73 | +10% $45 |
|---|---|---|---|---|---|
| Rent | -10% $-28 | -5% $37 | +0% $101 | +5% $166 | +10% $231 |
| Rate | -1.0pp $151 | -0.5pp $127 | base $101 | +0.5pp $76 | +1.0pp $50 |
UW: 25.0% down · 7.5% · 30yr · 1.5% tax · 5.0% vac · 8.0% maint · 8.0% mgmt
Financing live
Cash to close
- Down payment
- $24,750
- Closing costs
- $2,970
- Reserves months
- —
- Total cash needed
- —
Loan-product check · same deal, 3 products live
Conventional
25% down · 7.5% · 30yr
- Down + closing
- —
- Monthly P&I
- —
- Monthly cashflow
- —
- DSCR
- —
- Eligible?
- —
Personal DTI + credit; lowest rate.
DSCR
20% down · 8.5% · 30yr
- Down + closing
- —
- Monthly P&I
- —
- Monthly cashflow
- —
- DSCR
- —
- Eligible?
- —
No personal income docs; deal must DSCR.
Hard money
10% down · 12.0% · 12mo
- Down + closing
- —
- Monthly P&I
- —
- Monthly cashflow
- —
- DSCR
- —
- Eligible?
- —
Short-term bridge; refi at stabilization.
Rent comps 1 comps
| Address | Beds | Baths | Sqft | Rent | $/sqft | DOM | Units | Dist |
|---|---|---|---|---|---|---|---|---|
| 12395 Chancellor Blvd Port Charlotte, FL | 2.0 | 1.0 | 1004 | $1,600 | $1.59 | 23d | 1 | 0.83mi |
HOA detail
- Monthly dues
- $195 · $2,340/yr
Listing history 22 events
-
2026-06-21days on market $99,000 Active 30 DOM
-
2026-06-18days on market $99,000 Active 27 DOM
-
2026-06-17days on market $99,000 Active 26 DOM
-
2026-06-16days on market $99,000 Active 25 DOM
-
2026-06-15days on market $99,000 Active 24 DOM
-
2026-06-13days on market $99,000 Active 22 DOM
-
2026-06-13days on market $99,000 Active 21 DOM
-
2026-06-10days on market $99,000 Active 19 DOM
-
2026-06-09days on market $99,000 Active 18 DOM
-
2026-06-08days on market $99,000 Active 17 DOM
-
2026-06-08days on market $99,000 Active 16 DOM
-
2026-06-05days on market $99,000 Active 13 DOM
-
2026-06-03days on market $99,000 Active 12 DOM
-
2026-06-02days on market $99,000 Active 11 DOM
-
2026-06-01days on market $99,000 Active 10 DOM
-
2026-05-31days on market $99,000 Active 9 DOM
-
2026-05-22$99,000 Active
-
2026-05-13historical
-
2026-03-17price $107,500
-
2026-02-27$109,900 Active
-
2023-04-27soldstatus $60,000
-
1983-04-01soldstatus $22,500
ⓘ Source: listings_history table (triggers on properties + properties_extension) + one-shot
backfill from property_details.listing_events for pre-trigger history.
Tax reassessment forecast FL · Resets to sale price
- Current annual tax
- $4,436 · $370/mo
- Projected year-2 tax
- $4,436 · $370/mo
- Expected delta
- $0/yr ($0/mo · 0.0%)
ⓘ Screening estimate from a state-policy table — verify with the county assessor before closing.
Climate risk First Street
- Flood 8/10 Severe FEMA zone X (shaded) · 97% chance over 30 yrs
- Wildfire 1/10 Low
- Heat 10/10 Extreme 7 d/yr ≥107°F today · 26 d/yr by 30 yrs out
- Wind 10/10 Extreme 99% chance of damaging wind over 30 yrs
- Air quality 3/10 Moderate 2 unhealthy d/yr today · 3 by 30 yrs out
Nearby sold comps map
Loading sold comps map…
Walkable amenities ~0.75 mi
Loading nearby amenities…
Taxation est. · year 1
- Rental income
- $19,639
- − Mortgage interest
- −$5,546
- − Property taxes
- −$4,436
- − Insurance
- −$1,292
- − Repairs & maintenance
- −$1,571
- − Management
- −$1,571
- − HOA
- −$2,340
- − Depreciation
- −$2,880
- Taxable income
- $3
- Est. tax owed @ 24.0%
- −$1
- After-tax cash flow
- $1,216/yr
For passive investors: Depreciation is non-cash, so a rental often shows a tax loss while cash-flowing — sheltering income. Rental losses are passive: they offset passive income freely, and up to $25,000/yr can offset ordinary (W-2) income if you actively participate and your MAGI is under $100k (phasing out to $0 by $150k); unused losses carry forward. On sale, claimed depreciation is recaptured at up to 25%, and gains may owe capital-gains tax (a 1031 exchange can defer both). Figures are a year-1 estimate at your 24.0% rate — not tax advice; consult a CPA.
Schools (NCES district)
- District
- Sarasota
- NCES district ID
- 1201680
- Math proficiency
- 63% ▼ -8.00%
- Reading proficiency
- 63% ▼ -3.00%
- Median HH income
- $51,167
- Composite
- 53.68/100
- National rank
- #1428
- State rank
- #7 of 73 in FL
Livability — North Port
- Score
- 75/100
- State rank
- #252
- US rank
- #3975
Category grades
Schools grade is shown separately in the Schools card above.
Census & demographics
- Census place
- North Port, FL
- County
- Sarasota County · 448,376 people
- City population
- 75,324
- Metro
- North Port-Sarasota-Bradenton, FL
- Population (ZIP)
- 25,929
- Household income
- $63,464
- Rent vs Own
- Severe rent burden
- 522.0
Population outlook (Sarasota County) Hauer SSP2
- Today (2025)
- 452,380 people
- By 2030
- 474,175 · +4.8%
- By 2040
- 511,577 · +13.1%
- By 2050
- 541,467 · +19.7%
- By 2075
- 604,947 · +33.7%
- By 2100
- 621,965 · +37.5%
Race, ethnicity, and origin ACS 2023
- Neighborhood character
- Predominantly White (77%)
- Race & ethnicity
- White 77% Hispanic / Latino 14% Two or more races 7% Asian 4% Black 3%
- Hispanic origin (detail)
- Mexican 2% Puerto Rican 3% Cuban 3% Dominican 1%
- Common ancestry
- Romanian 4% Scotch-Irish 3% Lithuanian 3%
- Foreign-born
- 16% · Canada, Philippines
- Languages at home
- 81% English-only · Spanish 8% Russian/Polish/Slavic 5% French/Haitian/Cajun 2%
Political lean MEDSL · Sarasota
- 2024 margin
- R (+18.2) · D 40.5% · R 58.7%
- 2008→2024 swing
- -18.1pp toward R · 2008: -0.1pp · 2024: -18.2pp
- All cycles
- 2024: R+18.2 2020: R+10.4 2016: R+11.6 2012: R+7.4 2008: R+0.1
Not yet ingested
- Civics
- —
Market trends
- HPI YoY
- ▼ -70.89%
- Current HPI
- 280.8484
- Rent YoY
- ▲ 0.26%
- Metro
- North Port-Sarasota-Bradenton, FL
- State GDP YoY
- ▲ 3.28%
- F500 in state
- 36
Industry mix (Fortune 500 HQ in FL)
| Industry | F500 HQs | Revenue |
|---|---|---|
| Industrial Technology | 2 | $29B |
|
||
| Insurance | 2 | $17B |
|
||
| Retail | 1 | $60B |
|
||
| Technology Distribution | 1 | $58B |
|
||
| Homebuilding | 1 | $35B |
|
||
| Technology Manufacturing | 1 | $35B |
|
||
Price history
+340.0% since first listed6 events — show timeline
- 2026-05-22 Listed $99,000 Stellar MLS as Distributed by MLS Grid
- 2026-05-13 Listing Removed — Stellar MLS as Distributed by MLS Grid
- 2026-03-17 Price Changed $107,500 Stellar MLS as Distributed by MLS Grid
- 2026-02-27 Listed $109,900 Stellar MLS as Distributed by MLS Grid
- 2023-04-27 Sold (Public Records) $60,000 Public Records
- 1983-04-01 Sold (Public Records) $22,500 Public Records
Property tax history
+5.7%/yrLatest (2025): $4,436 · +0.1% YoY. Source: county tax records.
Cash-flow waterfall
monthlySold comps — $/sqft
last 12 mo · ≤1 miLoading sold comps…