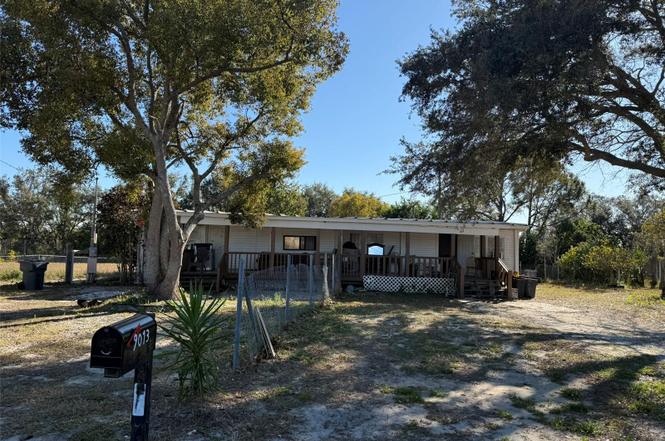
9013 Burr Dr · Lake Alfred, FL
Flood risk 1/10 · Minimal
- FEMA flood zone
- X (unshaded)
- Chance of flooding over 30 yrs
- 0.0%
- Est. flood insurance / yr
- $507 – $1,088
Fire risk 7/10 · Major
- Est. fire insurance / yr
- $947 – $1,759
Heat risk 8/10 · Major
- Hot days now (above 107°F)
- 7 days/yr
- Hot days in 30 yrs
- 23 days/yr
Wind risk 9/10 · Severe
- Chance of severe wind over 30 yrs
- 99.0%
Air-quality risk 2/10 · Minimal
- Unhealthy air days now
- 0 days/yr
- Unhealthy air days in 30 yrs
- 1 days/yr
Risk factors via First Street. Map © Google.
Why this score? — see what drove the C- grade
The composite is a weighted blend of 9 inputs, each scored 0–100. Each bar is that input's sub-score; the figure is the points it added to the 100-point composite (weight × sub-score).
- Cash flow +22.3/30.0
- ARV discount +7.5/15.0
- DSCR +7.1/10.0
- 1% rule +4.8/10.0
- Livability +3.6/5.0
- Schools +3.5/10.0
- Rent growth +2.5/5.0
- Condition / age +2.5/5.0
- Appreciation +0.0/10.0
$180,000
🖨 Deal sheet 📄 Offer letter ✓ Due diligence
Listing remarks
Mobile home located on a spacious lot in a quiet and private setting, surrounded by nature. The property features a front porch with roof and ample outdoor space, offering great potential for customization or future improvements. Suitable for both owner-occupants seeking space and privacy, as well as investors looking for value and upside potential. Convenient access to main roads and nearby amenities.
Key facts
- Ample outdoor space
- Front porch
- Convenient access
Tags
Property features AI
Finance
- Other: Lot just under 1 acre (approximately 0.99 acres); Lot dimensions about 101.2 x 433 feet
- Financial info: Homestead exemption applied
- HOA & community: No HOA/association
Exterior
- Parking: No specific parking information provided
- Security: No security features listed
- Utilities: Well water; Septic sewer; Other utilities
- Home design: Residential mobile home; Double-wide; Single-story; Front faces west
- Construction: Metal siding; Metal roof; Built on a foundation consistent with manufactured/mobile home construction
- Exterior features: Balcony; Asphalt road access
Interior
- Kitchen: Range; Refrigerator
- Bedrooms: 4 bedrooms
- Flooring: Ceramic tile; Linoleum
- Bathrooms: 2 full bathrooms
- Heating & cooling: No central heating; Wall/window air conditioning units
- Interior features: No notable interior features listed
- Laundry & utility: Outdoor laundry area
Neighborhood map
What this means for you Summary
Snapshot
- This is a 4-bed/2.0-bath manufactured listed at $180k.
Deal economics
- At list price, monthly cash flow is $297 ($4k/yr) — positive.
- The deal already cash-flows at list — no discount required.
- To meet the 1% rule (rent ≥ 1% of price), the offer needs to be $176k (2.4% below list).
- Recommended offer: $158k (12.0% below list) — sets the bar for market timing.
Location & tenants
- Location reads 72/100 on livability (#363 in FL) — a middle-class / working-renter tenant base. Strengths: crime A+, cost of living A+, housing A+; Watch: employment D, amenities F, commute F.
- Polk (suburban): math 39% / reading 43% proficiency, ranked #62 of 73 in FL (top 85%) — families likely to look elsewhere, expect single-tenant / working-renter base with shorter leases.
- Zoned schools: Polk City Elementary School (math 42% / reading 41%, grade F, #1,437 of 2,144 statewide, top 68%, 606 students, 58% FRL); Auburndale Senior High School (math 25% / reading 31%, grade F, #464 of 667 statewide, top 70%, 1,716 students, 53% FRL) — zoned schools at 55% FRL track the district average.
- Market conditions: 422 active listings in the ZIP; 10,384 units permitted in Polk County in 2024 (1,716 in 5+ unit buildings).
Forward outlook
- Local home prices are declining (-3.0%/yr); year-one equity from $1k of loan paydown is wiped out by about $5k of value loss. Plan a longer hold.
- Polk County population projected at +33% by 2050 — long-run rental-demand tailwind backs the buy-and-hold thesis.
Negotiation context
- It's been on market 133 days — a 12% lower offer ($158k) is reasonable based on typical stale-listing flexibility.
- Current owner paid $17k; list at $180k implies a 934% gain — meaningful room to come down on a strong offer.
Risks & watch-outs
- Climate carrying-cost: severe wind risk, 99% chance of damaging wind over 30y; major wildfire risk; extreme-heat days projected 7→23/yr by 2055 (HVAC capex compounding) — expect insurance premiums to compound above CPI over the hold.
Questions for the listing agent
- It's been on market 133 days. Have you received any prior offers? Is the seller open to a 12% concession, seller financing, or rate buy-down credit?
- Built in 1969 — when were the roof, HVAC, electrical panel, plumbing, and water heater last replaced?
- Why hasn't it sold? Are there any deal-killer items the seller is aware of (foundation, flood, title, zoning, code violations)?
- Is there a deadline driving the sale (1031 exchange, divorce, estate, relocation)? That informs how much negotiation room exists.
- What's the average days-on-market for RENTAL listings here right now (not sales)? A rising rental-DOM trend means longer vacancies and softer asking-rent achievability than the comps imply.
- What's the recent tenant-quality profile in this submarket — average credit score on applications, eviction rate, late-payment / NSF rate, and stable-employment percentage? A property-management company in the area should have these aggregated.
- How much new for-sale + rental construction is in the pipeline within 1–3 miles? Heavy new supply typically softens prices + rents 12–24 months out; constrained supply supports both.
Investment metrics
- 1% rule
- 0.98% ✗
- Cap rate
- 8.27%
- Cash-on-cash
- 7.07%
- DSCR
- 1.31
- GRM
- 8.5
CMA / ARV
No comps found within radius.
Projected returns pro-forma
-3.0% appreciation · 3.0% rent growth · sell at horizon
- IRR
- -5.5%
- Equity multiple
- 0.80×
- Total profit
- $-10,325
- Equity at exit
- $26,839
- IRR
- 4.1%
- Equity multiple
- 1.30×
- Total profit
- $15,084
- Equity at exit
- $15,563
Cash invested: $50,400 (down + closing). Projections, not guarantees.
Landlord ↔ Tenant lean methodology
- Overall (STATE)
- 87 Strongly Landlord-Friendly
- State Florida
- 87 Strongly Landlord-Friendly · R+3
- County
- — inherits STATE
- City
- — inherits STATE
ZIP-level market 33868
- Home prices YoY
- -9.3%
- Active inventory
- 422
- Price-to-rent
- 8.5×
Monthly cashflow live
- Estimated rent
- $1,756 medium interval (Pro) →
- Mortgage (P&I)
- −$944
- Tax from tax record
- −$71 /mo · $856/yr
- Insurance
- −$75
- HOA
- −$0
- Vacancy / Maint / Mgmt
- −$369
- Net cashflow
- $297
Break-even live
UW: 25.0% down · 7.5% · 30yr · 1.5% tax · 5.0% vac · 8.0% maint · 8.0% mgmt
Financing live
Cash to close
- Down payment
- $45,000
- Closing costs
- $5,400
- Reserves months
- —
- Total cash needed
- —
Loan-product check · same deal, 3 products live
Conventional
25% down · 7.5% · 30yr
- Down + closing
- —
- Monthly P&I
- —
- Monthly cashflow
- —
- DSCR
- —
- Eligible?
- —
Personal DTI + credit; lowest rate.
DSCR
20% down · 8.5% · 30yr
- Down + closing
- —
- Monthly P&I
- —
- Monthly cashflow
- —
- DSCR
- —
- Eligible?
- —
No personal income docs; deal must DSCR.
Hard money
10% down · 12.0% · 12mo
- Down + closing
- —
- Monthly P&I
- —
- Monthly cashflow
- —
- DSCR
- —
- Eligible?
- —
Short-term bridge; refi at stabilization.
Listing history 16 events
-
2026-06-18days on market $180,000 Active 133 DOM
-
2026-06-17days on market $180,000 Active 132 DOM
-
2026-06-16days on market $180,000 Active 131 DOM
-
2026-06-15days on market $180,000 Active 130 DOM
-
2026-06-13days on market $180,000 Active 128 DOM
-
2026-06-10days on market $180,000 Active 125 DOM
-
2026-06-09days on market $180,000 Active 124 DOM
-
2026-06-08days on market $180,000 Active 123 DOM
-
2026-06-07days on market $180,000 Active 122 DOM
-
2026-06-05days on market $180,000 Active 119 DOM
-
2026-06-03days on market $180,000 Active 117 DOM
-
2026-06-01days on market $180,000 Active 116 DOM
-
2026-05-31days on market $180,000 Active 115 DOM
-
2026-02-05$180,000 Active
-
1997-08-13soldstatus $17,400
-
1993-08-10soldstatus $11,900
ⓘ Source: listings_history table (triggers on properties + properties_extension) + one-shot
backfill from property_details.listing_events for pre-trigger history.
Tax reassessment forecast FL · Resets to sale price
- Current annual tax
- $856 · $71/mo
- Projected year-2 tax
- $1,494 · $124/mo
- Expected delta
- +$638/yr (+$53/mo · 74.5%)
ⓘ Screening estimate from a state-policy table — verify with the county assessor before closing.
Climate risk First Street
- Flood 1/10 Low FEMA zone X (unshaded) · 0% chance over 30 yrs
- Wildfire 7/10 Severe
- Heat 8/10 Severe 7 d/yr ≥107°F today · 23 d/yr by 30 yrs out
- Wind 9/10 Extreme 99% chance of damaging wind over 30 yrs
- Air quality 2/10 Low 0 unhealthy d/yr today · 1 by 30 yrs out
Nearby sold comps map
Loading sold comps map…
Walkable amenities ~0.75 mi
Loading nearby amenities…
Taxation est. · year 1
- Rental income
- $21,071
- − Mortgage interest
- −$10,083
- − Property taxes
- −$856
- − Insurance
- −$900
- − Repairs & maintenance
- −$1,686
- − Management
- −$1,686
- − Depreciation
- −$5,236
- Taxable income
- $625
- Est. tax owed @ 24.0%
- −$150
- After-tax cash flow
- $3,413/yr
For passive investors: Depreciation is non-cash, so a rental often shows a tax loss while cash-flowing — sheltering income. Rental losses are passive: they offset passive income freely, and up to $25,000/yr can offset ordinary (W-2) income if you actively participate and your MAGI is under $100k (phasing out to $0 by $150k); unused losses carry forward. On sale, claimed depreciation is recaptured at up to 25%, and gains may owe capital-gains tax (a 1031 exchange can defer both). Figures are a year-1 estimate at your 24.0% rate — not tax advice; consult a CPA.
Schools (NCES district)
- District
- Polk
- NCES district ID
- 1201590
- Math proficiency
- 39% ▼ -11.00%
- Reading proficiency
- 43% ▼ -4.00%
- Median HH income
- $43,979
- Composite
- 34.74/100
- National rank
- #5132
- State rank
- #62 of 73 in FL
Livability — Lake Alfred
- Score
- 72/100
- State rank
- #363
- US rank
- #6406
Category grades
Schools grade is shown separately in the Schools card above.
Census & demographics
- City population
- 9,757
- Population (ZIP)
- 13,676
Population outlook (Polk County) Hauer SSP2
- Today (2025)
- 752,975 people
- By 2030
- 804,621 · +6.9%
- By 2040
- 906,117 · +20.3%
- By 2050
- 1,000,476 · +32.9%
- By 2075
- 1,197,520 · +59.0%
- By 2100
- 1,271,518 · +68.9%
Race, ethnicity, and origin ACS 2023
- Neighborhood character
- Predominantly White (66%)
- Race & ethnicity
- White 66% Hispanic / Latino 22% Two or more races 14% Black 6%
- Hispanic origin (detail)
- Mexican 6% Puerto Rican 11% Dominican 2%
- Common ancestry
- Lithuanian 1% Italian 1% Slovak 1%
- Foreign-born
- 6% · Canada
- Languages at home
- 80% English-only · Spanish 17% Other Indo-European 1%
Political lean MEDSL · Polk
- 2024 margin
- Strong R (+20.7) · D 39.2% · R 59.9%
- 2008→2024 swing
- -14.6pp toward R · 2008: -6.1pp · 2024: -20.7pp
- All cycles
- 2024: R+20.7 2020: R+14.4 2016: R+14.1 2012: R+6.8 2008: R+6.1
Not yet ingested
- Civics
- —
Market trends
- HPI YoY
- ▼ -33.52%
- Current HPI
- 325.6917
- Rent YoY
- —
- Metro
- —
- State GDP YoY
- ▲ 3.28%
- F500 in state
- 36
Industry mix (Fortune 500 HQ in FL)
| Industry | F500 HQs | Revenue |
|---|---|---|
| Industrial Technology | 2 | $29B |
|
||
| Insurance | 2 | $17B |
|
||
| Retail | 1 | $60B |
|
||
| Technology Distribution | 1 | $58B |
|
||
| Homebuilding | 1 | $35B |
|
||
| Technology Manufacturing | 1 | $35B |
|
||
Price history
+1412.6% since first listed3 events — show timeline
- 2026-02-05 Listed $180,000 Stellar MLS as Distributed by MLS Grid
- 1997-08-13 Sold (Public Records) $17,400 Public Records
- 1993-08-10 Sold (Public Records) $11,900 Public Records
Property tax history
+12.9%/yrLatest (2025): $856 · +50.7% YoY. Source: county tax records.
Cash-flow waterfall
monthlySold comps — $/sqft
last 12 mo · ≤1 miLoading sold comps…