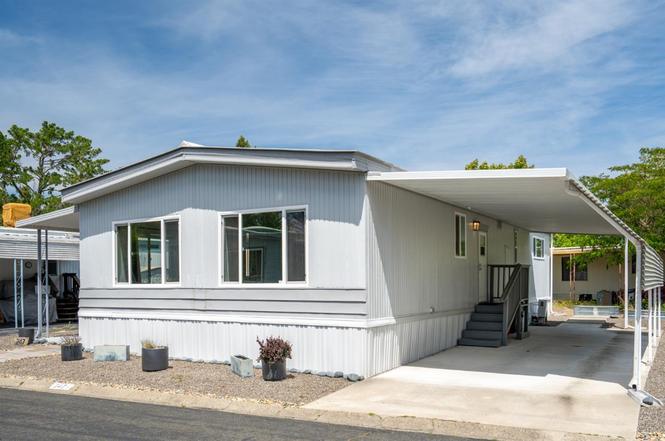
247 East Seven Flags Cir · Temelec, CA
Flood risk 1/10 · Minimal
- FEMA flood zone
- X (unshaded)
- Chance of flooding over 30 yrs
- 0.0%
- Est. flood insurance / yr
- $507 – $1,088
Fire risk 5/10 · Moderate
- Est. fire insurance / yr
- $659 – $1,223
Heat risk 4/10 · Minor
- Hot days now (above 94°F)
- 7 days/yr
- Hot days in 30 yrs
- 15 days/yr
Wind risk 1/10 · Minimal
- Chance of severe wind over 30 yrs
- —
Air-quality risk 9/10 · Severe
- Unhealthy air days now
- 19 days/yr
- Unhealthy air days in 30 yrs
- 19 days/yr
Risk factors via First Street. Map © Google.
Why this score? — see what drove the C grade
The composite is a weighted blend of 9 inputs, each scored 0–100. Each bar is that input's sub-score; the figure is the points it added to the 100-point composite (weight × sub-score).
- Cash flow +24.4/30.0
- DSCR +7.9/10.0
- 1% rule +6.3/10.0
- ARV discount +5.7/15.0
- Schools +3.4/10.0
- Livability +2.8/5.0
- Rent growth +2.7/5.0
- Condition / age +2.5/5.0
- Appreciation +0.0/10.0
$275,000
🖨 Deal sheet 📄 Offer letter ✓ Due diligence
Listing remarks
Nestled in the heart of Sonoma Valley within the desirable Seven Flags 55+ community, this beautifully updated double-wide home offers an affordable opportunity to enjoy Wine Country living. Featuring 2 bedrooms, 2 bathrooms, and a versatile additional room ideal for a home office or guest space, the home is filled with natural light and thoughtful upgrades throughout. The spacious great room showcases attractive wood-look flooring and charming wood accents, while built-in cabinetry enhances the dining area. The kitchen features stainless steel appliances and ample storage. The primary suite includes a barn-door entry, walk-in closet, and private bath, creating a comfortable retreat. An enc
Key facts
- Wood-look flooring
- Built-in cabinetry
- Walk-in closet
Tags
Property features AI
Finance
- Financial info: Land lease amount: $1,300
- HOA & community: No association; Located in Seven Flags Mobile Home Park
Exterior
- Parking: Covered parking for 2 vehicles
- Utilities: Individual electric meter; Public sewer
- Home design: Manufactured in park (double wide)
- Construction: Aluminum skirting; Manufacturer/Make: Ambassador
- Exterior features: Located in a senior community; Land lease community (space rent applicable)
Interior
- Kitchen: Pantry cabinet
- Bedrooms: 2 bedrooms
- Bathrooms: 2 full bathrooms; Shower stall(s); Tub with shower over
- Heating & cooling: Central heating (natural gas); Central cooling
- Interior features: Pantry cabinet; Laundry closet
- Laundry & utility: Washer included; Dryer included; Laundry located in kitchen (laundry closet)
Neighborhood map
What this means for you Summary
Snapshot
- This is a 2-bed/2.0-bath manufactured listed at $275k.
Deal economics
- At list price, monthly cash flow is $559 ($7k/yr) — positive.
- The deal already cash-flows at list — no discount required.
- Meets the 1% rule at list price ($3k rent vs $275k).
Location & tenants
- Location reads 56/100 on livability (#811 in CA) — a working-class tenant base; expect higher turnover. Strengths: crime A+, employment B+, housing B; Watch: health & safety D, amenities F, commute F.
- Sonoma Valley Unified (town): math 27% / reading 42% proficiency, ranked #849 of 1,400 in CA (top 61%) — families likely to look elsewhere, expect single-tenant / working-renter base with shorter leases.
- Market conditions: Rents flat; 263 active listings in the ZIP; solid renter incomes; 1,039 units permitted in Sonoma County in 2024 (185 in 5+ unit buildings).
- This rent runs 35% of the median local income ($105k/yr) — at the standard rent-burdened threshold; future hikes will face affordability resistance.
Forward outlook
- Local home prices are declining (-3.0%/yr); year-one equity from $2k of loan paydown is wiped out by about $8k of value loss. Plan a longer hold.
- Sonoma County population projected at +8% by 2050 — modest demand growth; plan on rents tracking national, not racing it.
Negotiation context
- Only 1 days on market — expect competitive offers; lowballing is unlikely to land.
Risks & watch-outs
- Climate carrying-cost: moderate wildfire risk — expect insurance premiums to compound above CPI over the hold.
Questions for the listing agent
- Built in 1973 — when were the roof, HVAC, electrical panel, plumbing, and water heater last replaced?
- Is there a deadline driving the sale (1031 exchange, divorce, estate, relocation)? That informs how much negotiation room exists.
- What's the average days-on-market for RENTAL listings here right now (not sales)? A rising rental-DOM trend means longer vacancies and softer asking-rent achievability than the comps imply.
- What's the recent tenant-quality profile in this submarket — average credit score on applications, eviction rate, late-payment / NSF rate, and stable-employment percentage? A property-management company in the area should have these aggregated.
- How much new for-sale + rental construction is in the pipeline within 1–3 miles? Heavy new supply typically softens prices + rents 12–24 months out; constrained supply supports both.
Investment metrics
- 1% rule
- 1.13% ✓
- Cap rate
- 8.73%
- Cash-on-cash
- 8.71%
- DSCR
- 1.39
- GRM
- 7.4
CMA / ARV
- ARV (on-the-fly)
- $264,576
- Comps found
- 11
Show comp detail 11 sales within ~0.75 mi
| Address | Dist | Beds/Ba | Sqft | Sold | Price | $/sf | Match |
|---|---|---|---|---|---|---|---|
| 200 Mexican Flag Way | 0.06mi | 2/2.0 | 1,213 (-3%) | 5mo | $275,000 | $227 | 88 |
| 272 Russian Flag Way | 0.14mi | 2/2.0 | 1,248 (0%) | 16mo | $100,000 | $80 | 80 |
| 166 Seven Flags Cir | 0.15mi | 2/2.0 | 1,344 (+8%) | 2mo | $285,000 | $212 | 78 |
| 14 Fort Ross Way | 0.08mi | 2/2.0 | 1,344 (+8%) | 8mo | $288,000 | $214 | 76 |
| 258 English Flag Way | 0.09mi | 3/2.0 (+1) | 1,344 (+8%) | 10mo | $278,500 | $207 | 70 |
| 59 Portola Cir | 0.31mi | 2/2.0 | 1,245 (-0%) | 19mo | $278,000 | $223 | 70 |
| 196 Mexican Flag Way | 0.05mi | 3/2.0 (+1) | 1,200 (-4%) | 22mo | $240,000 | $200 | 68 |
| 22 Fort Ross Way | 0.08mi | 2/2.0 | 1,368 (+10%) | 15mo | $153,000 | $112 | 68 |
| 292 Paseo Bolivar | 0.11mi | 2/2.0 | 1,347 (+8%) | 17mo | $330,000 | $245 | 67 |
| 245 Seven Flags Cir | 0.02mi | 2/2.0 | 1,344 (+8%) | 24mo | $249,000 | $185 | 67 |
| 74 International Blvd | 0.18mi | 2/2.0 | 1,152 (-8%) | 15mo | $260,000 | $226 | 67 |
Match score weights: distance 35% · size 25% · config 20% · recency 20%. Top-matched comps best support the ARV.
Projected returns pro-forma
-3.0% appreciation · 0.79% rent growth · sell at horizon
- IRR
- -5.6%
- Equity multiple
- 0.80×
- Total profit
- $-15,700
- Equity at exit
- $41,003
- IRR
- 1.2%
- Equity multiple
- 1.07×
- Total profit
- $5,757
- Equity at exit
- $23,777
Cash invested: $77,000 (down + closing). Projections, not guarantees.
Landlord ↔ Tenant lean methodology
- Overall (STATE)
- 18 Strongly Tenant-Friendly
- State California
- 18 Strongly Tenant-Friendly · D+13
- County
- — inherits STATE
- City
- — inherits STATE
ZIP-level market 95476
- Rents YoY
- 0.8%
- Active inventory
- 263
- Price-to-rent
- 7.4×
Monthly cashflow live
- Estimated rent
- $3,113 medium interval (Pro) →
- Mortgage (P&I)
- −$1,442
- Tax est. 1.5%
- −$344 /mo · $4,125/yr
- Insurance
- −$115
- HOA
- −$0
- Vacancy / Maint / Mgmt
- −$654
- Net cashflow
- $559
Break-even live
UW: 25.0% down · 7.5% · 30yr · 1.5% tax · 5.0% vac · 8.0% maint · 8.0% mgmt
Financing live
Cash to close
- Down payment
- $68,750
- Closing costs
- $8,250
- Reserves months
- —
- Total cash needed
- —
Loan-product check · same deal, 3 products live
Conventional
25% down · 7.5% · 30yr
- Down + closing
- —
- Monthly P&I
- —
- Monthly cashflow
- —
- DSCR
- —
- Eligible?
- —
Personal DTI + credit; lowest rate.
DSCR
20% down · 8.5% · 30yr
- Down + closing
- —
- Monthly P&I
- —
- Monthly cashflow
- —
- DSCR
- —
- Eligible?
- —
No personal income docs; deal must DSCR.
Hard money
10% down · 12.0% · 12mo
- Down + closing
- —
- Monthly P&I
- —
- Monthly cashflow
- —
- DSCR
- —
- Eligible?
- —
Short-term bridge; refi at stabilization.
Listing history 2 events
-
2026-06-17remarks 699-char remark
-
2026-06-17$275,000 Active 1 DOM
ⓘ Source: listings_history table (triggers on properties + properties_extension) + one-shot
backfill from property_details.listing_events for pre-trigger history.
Climate risk First Street
- Flood 1/10 Low FEMA zone X (unshaded) · 0% chance over 30 yrs
- Wildfire 5/10 Major
- Heat 4/10 Moderate 7 d/yr ≥94°F today · 15 d/yr by 30 yrs out
- Wind 1/10 Low
- Air quality 9/10 Extreme 19 unhealthy d/yr today · 19 by 30 yrs out
Nearby sold comps map
Loading sold comps map…
Walkable amenities ~0.75 mi
Loading nearby amenities…
Taxation est. · year 1
- Rental income
- $37,355
- − Mortgage interest
- −$15,404
- − Property taxes
- −$4,125
- − Insurance
- −$1,375
- − Repairs & maintenance
- −$2,988
- − Management
- −$2,988
- − Depreciation
- −$8,000
- Taxable income
- $2,474
- Est. tax owed @ 24.0%
- −$594
- After-tax cash flow
- $6,111/yr
For passive investors: Depreciation is non-cash, so a rental often shows a tax loss while cash-flowing — sheltering income. Rental losses are passive: they offset passive income freely, and up to $25,000/yr can offset ordinary (W-2) income if you actively participate and your MAGI is under $100k (phasing out to $0 by $150k); unused losses carry forward. On sale, claimed depreciation is recaptured at up to 25%, and gains may owe capital-gains tax (a 1031 exchange can defer both). Figures are a year-1 estimate at your 24.0% rate — not tax advice; consult a CPA.
Schools (NCES district)
- District
- Sonoma Valley Unified
- NCES district ID
- 0637200
- Math proficiency
- 27% ▼ -1.00%
- Reading proficiency
- 42% ▲ 1.00%
- Median HH income
- $63,880
- Composite
- 33.88/100
- National rank
- #10355
- State rank
- #849 of 1400 in CA
Livability — Temelec
- Score
- 56/100
- State rank
- #811
- US rank
- #22885
Category grades
Schools grade is shown separately in the Schools card above.
Census & demographics
- Census place
- Temelec, CA
- County
- Sonoma County · 449,805 people
- Metro
- Santa Rosa-Petaluma, CA
- Population (ZIP)
- 35,196
- Household income
- $105,374
- Rent vs Own
- Severe rent burden
- 1218.0
Population outlook (Sonoma County) Hauer SSP2
- Today (2025)
- 539,935 people
- By 2030
- 554,870 · +2.8%
- By 2040
- 573,262 · +6.2%
- By 2050
- 580,715 · +7.6%
- By 2075
- 579,229 · +7.3%
- By 2100
- 547,835 · +1.5%
Race, ethnicity, and origin ACS 2023
- Neighborhood character
- Predominantly White (66%)
- Race & ethnicity
- White 66% Hispanic / Latino 28% Two or more races 13% Asian 2% Black 1%
- Hispanic origin (detail)
- Mexican 23%
- Common ancestry
- Italian 5% Lithuanian 4% Portuguese 3%
- Foreign-born
- 16% · Canada, Dominican Republic
- Languages at home
- 75% English-only · Spanish 21% Other Indo-European 1% Other Asian/Pacific 0%
Political lean MEDSL · Sonoma
- 2024 margin
- Solid D (+46.2) · D 71.4% · R 25.2% · Other 3.3%
- 2008→2024 swing
- -3.4pp toward R · 2008: 49.6pp · 2024: 46.2pp
- All cycles
- 2024: D+46.2 2020: D+51.5 2016: D+47.9 2012: D+44.9 2008: D+49.6
Not yet ingested
- Civics
- —
Market trends
- HPI YoY
- ▼ -1116.03%
- Current HPI
- 236.6408
- Rent YoY
- ▲ 0.79%
- Metro
- Santa Rosa-Petaluma, CA
- State GDP YoY
- ▲ 3.21%
- F500 in state
- 116
Industry mix (Fortune 500 HQ in CA)
| Industry | F500 HQs | Revenue |
|---|---|---|
| Technology | 27 | $1,492B |
|
||
| Financial Services | 3 | $174B |
|
||
| Retail | 3 | $44B |
|
||
| Insurance | 3 | $26B |
|
||
| Media / Entertainment | 2 | $115B |
|
||
| Pharmaceuticals / Biotech | 2 | $62B |
|
||
Price history
1 event — show timeline
- 2026-06-17 Listed $275,000 BAREIS
Cash-flow waterfall
monthlySold comps — $/sqft
last 12 mo · ≤1 miLoading sold comps…