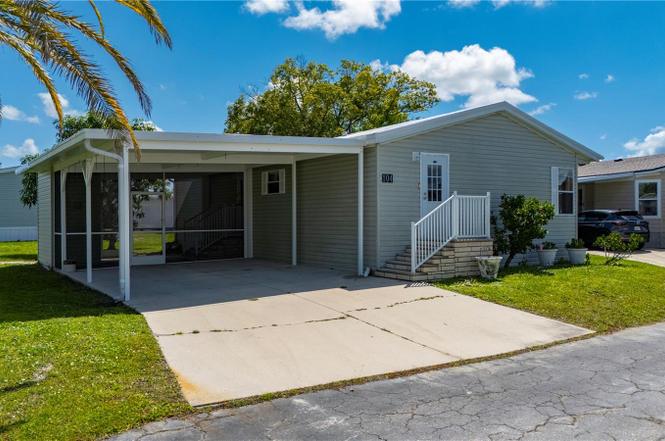
1000 Kings Hwy #104 · Port Charlotte, FL
Flood risk 1/10 · Minimal
- FEMA flood zone
- X (unshaded)
- Chance of flooding over 30 yrs
- 0.0%
- Est. flood insurance / yr
- $507 – $1,088
Fire risk 2/10 · Minimal
- Est. fire insurance / yr
- $947 – $1,759
Heat risk 10/10 · Severe
- Hot days now (above 107°F)
- 7 days/yr
- Hot days in 30 yrs
- 27 days/yr
Wind risk 10/10 · Severe
- Chance of severe wind over 30 yrs
- 99.0%
Air-quality risk 2/10 · Minimal
- Unhealthy air days now
- 2 days/yr
- Unhealthy air days in 30 yrs
- 2 days/yr
Risk factors via First Street. Map © Google.
Why this score? — see what drove the C+ grade
The composite is a weighted blend of 9 inputs, each scored 0–100. Each bar is that input's sub-score; the figure is the points it added to the 100-point composite (weight × sub-score).
- Cash flow +24.4/30.0
- ARV discount +10.6/15.0
- 1% rule +9.4/10.0
- DSCR +7.9/10.0
- Schools +4.6/10.0
- Livability +3.2/5.0
- Condition / age +2.5/5.0
- Rent growth +1.5/5.0
- Appreciation +0.0/10.0
$135,990
🖨 Deal sheet 📄 Offer letter ✓ Due diligence
Listing remarks
Virtually Staged. * * Port Charlotte Village was voted #1 manufactured home community in 2024 in Charlotte County * * Welcome to this beautifully updated 2-bedroom, 2-bathroom manufactured home located in a desirable 55+ community. This charming residence features an oversized driveway and a large screened-in lanai with an attached storage shed—perfect for enjoying Florida’s outdoor lifestyle. Inside, you’ll find brand-new luxury vinyl flooring throughout, fresh interior paint, and a spacious, open layout. The kitchen is a standout with a generous island, an abundance of solid wood cabinetry, and plenty of counter space, making it ideal for cooking and entertaining. A
Key facts
- Solid wood cabinetry
- Generous island
- Oversized driveway
Tags
Property features AI
Finance
- Other: Lot size about 0.05 acres (approximate); Mature landscaping
- Financial info: Total annual HOA fees $3,600
- HOA & community: Monthly association fee of $300; Association amenities include cable TV, clubhouse, maintenance, recreation facilities, shuffleboard court, storage, and wheelchair access; Pool, management, private road, trash and water included in association fees; Buyer approval required; Community mailbox; Dog park; Golf carts allowed; Street lights; Senior community; Pets allowed with limits (maximum 25 lbs)
Exterior
- Parking: Driveway; Carport with 2 spaces
- Utilities: Public water; Public sewer; Electricity available and connected; Cable available and connected; Fiber optics; BB/HS internet available; Water connected; Sewer connected
- Home design: Manufactured double-wide home; One level; Faces southwest
- Construction: Vinyl siding; Membrane roof; Crawlspace foundation; Built in 1 (one) story (double wide)
- Exterior features: Screened side porch; Outdoor lighting; Rain gutters; Shed(s); Landscaped lot; Cul-de-sac lot
Interior
- Kitchen: Convection oven; Dishwasher; Disposal; Refrigerator
- Bedrooms: 2 bedrooms
- Bathrooms: 2 full bathrooms
- Heating & cooling: Central heating; Central air
- Interior features: Built-in features; Ceiling fans; Crown molding; High ceilings; Solid wood cabinets; Thermostat; Walk-in closet(s); Storage rooms
- Laundry & utility: Washer and dryer located in the kitchen; Electric water heater
Neighborhood map
What this means for you Summary
Snapshot
- This is a 2-bed/2.0-bath manufactured listed at $136k.
Deal economics
- At list price, monthly cash flow is $277 ($3k/yr) — positive.
- The deal already cash-flows at list — no discount required.
- Meets the 1% rule at list price ($2k rent vs $136k).
- Recommended offer: $120k (12.0% below list) — sets the bar for market timing.
- Cap rate 8.7% vs local median 4.4% in Port Charlotte — top-decile yield for the area; either an underpriced asset or a hidden risk that comps aren't pricing in. Stress-test before assuming the spread holds.
Location & tenants
- Location reads 65/100 on livability (#655 in FL) — a middle-class / working-renter tenant base. Strengths: cost of living A+, housing A+; Watch: schools D+, employment D, amenities F.
- Charlotte (suburban): math 54% / reading 54% proficiency, ranked #22 of 73 in FL (top 30%) — acceptable for families but not a draw, mixed tenant base, ~2y average lease.
- Market conditions: Rents falling (-4.0%/yr); 600 active listings in the ZIP; 19 comparable units currently listed for rent nearby; rentals at typical pace (median 21d on market — plan ~3-4 weeks tenant-placement turnaround); 4,585 units permitted in Charlotte County in 2024 (703 in 5+ unit buildings).
- This rent runs 37% of the median local income ($64k/yr) — at the standard rent-burdened threshold; future hikes will face affordability resistance.
Forward outlook
- Local home prices are declining (-3.0%/yr); year-one equity from $940 of loan paydown is wiped out by about $4k of value loss. Plan a longer hold.
- Charlotte County population projected at +24% by 2050 — long-run rental-demand tailwind backs the buy-and-hold thesis.
Negotiation context
- It's been on market 310 days — a 12% lower offer ($120k) is reasonable based on typical stale-listing flexibility.
- 3 sale attempts; this cycle's ask has dropped $14k (9%) from the opening price — seller is motivated, your offer sets the floor, not the list.
- Current owner paid $56k; list at $136k implies a 141% gain — meaningful room to come down on a strong offer.
Risks & watch-outs
- Climate carrying-cost: severe wind risk, 99% chance of damaging wind over 30y; extreme-heat days projected 7→27/yr by 2055 (HVAC capex compounding) — expect insurance premiums to compound above CPI over the hold.
Questions for the listing agent
- It's been on market 310 days. Have you received any prior offers? Is the seller open to a 12% concession, seller financing, or rate buy-down credit?
- What does the HOA fee cover, when was the last increase, and are there any pending special assessments or reserve-fund shortfalls?
- Why hasn't it sold? Are there any deal-killer items the seller is aware of (foundation, flood, title, zoning, code violations)?
- Is there a deadline driving the sale (1031 exchange, divorce, estate, relocation)? That informs how much negotiation room exists.
- Schools are D-rated, which usually means shorter tenancies and higher turnover. Who's the typical renter profile here, and what's been the actual vacancy rate?
- What's the average days-on-market for RENTAL listings here right now (not sales)? A rising rental-DOM trend means longer vacancies and softer asking-rent achievability than the comps imply.
- What's the recent tenant-quality profile in this submarket — average credit score on applications, eviction rate, late-payment / NSF rate, and stable-employment percentage? A property-management company in the area should have these aggregated.
- How much new for-sale + rental construction is in the pipeline within 1–3 miles? Heavy new supply typically softens prices + rents 12–24 months out; constrained supply supports both.
Investment metrics
- 1% rule
- 1.44% ✓
- Cap rate
- 8.74%
- Cash-on-cash
- 8.72%
- DSCR
- 1.39
- GRM
- 5.8
CMA / ARV
- ARV (on-the-fly)
- $146,124
- Comps found
- 5
Show comp detail 5 sales within ~0.75 mi
| Address | Dist | Beds/Ba | Sqft | Sold | Price | $/sf | Match |
|---|---|---|---|---|---|---|---|
| 1000 Kings Hwy #373 | 0.24mi | 2/2.0 | 1,248 (+5%) | 2mo | $170,000 | $136 | 79 |
| 1000 Kings Hwy #472 | 0.07mi | 2/2.0 | 1,100 (-7%) | 7mo | $135,000 | $123 | 78 |
| 1000 Kings Hwy #389 | 0.16mi | 2/2.0 | 1,269 (+7%) | 10mo | $150,000 | $118 | 73 |
| 1000 Kings Hwy #432 | 0.12mi | 2/2.0 | 1,056 (-11%) | 4mo | $164,500 | $156 | 73 |
| 1000 Kings Hwy #181 | 0.13mi | 2/2.0 | 1,344 (+13%) | 9mo | $145,000 | $108 | 65 |
Match score weights: distance 35% · size 25% · config 20% · recency 20%. Top-matched comps best support the ARV.
Projected returns pro-forma
-3.0% appreciation · 0.0% rent growth · sell at horizon
- IRR
- -7.3%
- Equity multiple
- 0.74×
- Total profit
- $-9,928
- Equity at exit
- $20,277
- IRR
- -3.4%
- Equity multiple
- 0.81×
- Total profit
- $-7,237
- Equity at exit
- $11,758
Cash invested: $38,077 (down + closing). Projections, not guarantees.
Landlord ↔ Tenant lean methodology
- Overall (STATE)
- 87 Strongly Landlord-Friendly
- State Florida
- 87 Strongly Landlord-Friendly · R+3
- County
- — inherits STATE
- City
- — inherits STATE
ZIP-level market 33980
- Home prices YoY
- -5.0%
- Rents YoY
- -4.0%
- Active inventory
- 600
- Price-to-rent
- 5.8×
Monthly cashflow live
- Estimated rent
- $1,965 high interval (Pro) →
- Mortgage (P&I)
- −$713
- Tax from tax record
- −$205 /mo · $2,465/yr
- Insurance
- −$57
- HOA
- −$300
- Vacancy / Maint / Mgmt
- −$413
- Net cashflow
- $277
Break-even live
UW: 25.0% down · 7.5% · 30yr · 1.5% tax · 5.0% vac · 8.0% maint · 8.0% mgmt
Financing live
Cash to close
- Down payment
- $33,998
- Closing costs
- $4,080
- Reserves months
- —
- Total cash needed
- —
Loan-product check · same deal, 3 products live
Conventional
25% down · 7.5% · 30yr
- Down + closing
- —
- Monthly P&I
- —
- Monthly cashflow
- —
- DSCR
- —
- Eligible?
- —
Personal DTI + credit; lowest rate.
DSCR
20% down · 8.5% · 30yr
- Down + closing
- —
- Monthly P&I
- —
- Monthly cashflow
- —
- DSCR
- —
- Eligible?
- —
No personal income docs; deal must DSCR.
Hard money
10% down · 12.0% · 12mo
- Down + closing
- —
- Monthly P&I
- —
- Monthly cashflow
- —
- DSCR
- —
- Eligible?
- —
Short-term bridge; refi at stabilization.
Rent comps 19 comps
| Address | Beds | Baths | Sqft | Rent | $/sqft | DOM | Units | Dist |
|---|---|---|---|---|---|---|---|---|
| 24484 Zephyr Ct Unit 24484 Punta Gorda, FL | 3.0 | 2.0 | 1255 | $1,695 | $1.35 | 21d | 1 | 0.36mi |
| 1670 Royal Ct Punta Gorda, FL | 2.0 | 2.0 | 1393 | $2,400 | $1.72 | 21d | 1 | 0.41mi |
| 1717 Sunderland Dr Punta Gorda, FL | 2.0 | 2.0 | 1402 | $2,800 | $2.00 | 21d | 1 | 0.47mi |
| 1200 Loveland Blvd Punta Gorda, FL | 1.0–3.0 | 1.0–2.0 | 1151 | $2,030 | $1.76 | 13d | 276 | 0.53mi |
| 24151 Beatrix Blvd Port Charlotte, FL | 3.0 | 1.0–2.0 | 990 | $1,955 | $1.97 | 13d | 28 | 0.56mi |
| 24401 Manchester Trl Punta Gorda, FL | 2.0 | 2.0 | 1382 | $2,000 | $1.45 | 21d | 1 | 0.57mi |
| 1999 Kings Hwy Port Charlotte, FL | 2.0 | 1.0–2.0 | 906 | $1,800 | $1.99 | 21d | 2 | 0.70mi |
| 25100 Sandhill Blvd Port Charlotte, FL | 2.0 | 2.0 | 860 | $1,788 | $2.08 | 21d | 2 | 0.70mi |
| 24472 Manchester Trl Punta Gorda, FL | 2.0 | 2.0 | 1373 | $1,900 | $1.38 | 21d | 1 | 0.71mi |
| 25050 Sandhill Blvd Unit 5B1 Punta Gorda, FL | 2.0 | 2.0 | 900 | $1,500 | $1.67 | 21d | 1 | 0.72mi |
| 24150 Beatrix Blvd Port Charlotte, FL | 3.0 | 1.0–2.0 | 866 | $1,735 | $2.00 | 13d | 42 | 0.82mi |
| 1471 Capricorn Blvd Unit A Punta Gorda, FL | 3.0 | 2.0 | 1450 | $1,900 | $1.31 | 13d | 1 | 0.82mi |
| 1499 Capricorn Blvd Port Charlotte, FL | 2.0 | 2.0 | 980 | $1,495 | $1.53 | 21d | 1 | 0.86mi |
| 24001 Madaca Ln Port Charlotte, FL | 1.0–3.0 | 1.0–2.0 | 1179 | $1,720 | $1.46 | 13d | 26 | 0.88mi |
| 175 Kings Hwy Port Charlotte, FL | 2.0 | 2.0 | 1219 | $1,398 | $1.15 | 21d | 3 | 1.05mi |
| 25225 Rampart Blvd Punta Gorda, FL | 2.0 | 2.0 | 886 | $1,925 | $2.17 | 21d | 5 | 1.14mi |
| 175 Kings Hwy Unit A8 Punta Gorda, FL | 2.0 | 2.0 | 1228 | $1,700 | $1.38 | 21d | 1 | 1.16mi |
| 23184 Glory Ave Port Charlotte, FL | 2.0 | 2.0 | 1370 | $2,000 | $1.46 | 21d | 1 | 1.26mi |
| 25230 Campos Dr Punta Gorda, FL | 3.0 | 2.0 | 1460 | $1,750 | $1.20 | 21d | 1 | 1.27mi |
HOA detail
- Monthly dues
- $300 · $3,600/yr
Listing history 24 events
-
2026-06-18days on market $135,990 Active 310 DOM
-
2026-06-17days on market $135,990 Active 309 DOM
-
2026-06-16days on market $135,990 Active 308 DOM
-
2026-06-15days on market $135,990 Active 307 DOM
-
2026-06-14days on market $135,990 Active 305 DOM
-
2026-06-13days on market $135,990 Active 304 DOM
-
2026-06-10days on market $135,990 Active 302 DOM
-
2026-06-09days on market $135,990 Active 301 DOM
-
2026-06-08days on market $135,990 Active 300 DOM
-
2026-06-05days on market $135,990 Active 296 DOM
-
2026-06-02days on market $135,990 Active 294 DOM
-
2026-06-01days on market $135,990 Active 293 DOM
-
2026-05-31days on market $135,990 Active 292 DOM
-
2026-05-30days on market $135,990 Active 291 DOM
-
2026-03-10price $135,990
-
2026-02-25price $139,990
-
2026-01-22status Active
-
2025-12-05status Pending
-
2025-06-25$150,000 Active
-
2025-06-23historical
-
2025-05-17price $124,900
-
2025-03-21$144,900 Active
-
2025-03-03soldstatus $56,500
-
2003-02-19soldstatus $56,000
ⓘ Source: listings_history table (triggers on properties + properties_extension) + one-shot
backfill from property_details.listing_events for pre-trigger history.
Tax reassessment forecast FL · Resets to sale price
- Current annual tax
- $2,465 · $205/mo
- Projected year-2 tax
- $2,465 · $205/mo
- Expected delta
- $0/yr ($0/mo · 0.0%)
ⓘ Screening estimate from a state-policy table — verify with the county assessor before closing.
Climate risk First Street
- Flood 1/10 Low FEMA zone X (unshaded) · 0% chance over 30 yrs
- Wildfire 2/10 Low
- Heat 10/10 Extreme 7 d/yr ≥107°F today · 27 d/yr by 30 yrs out
- Wind 10/10 Extreme 99% chance of damaging wind over 30 yrs
- Air quality 2/10 Low 2 unhealthy d/yr today · 2 by 30 yrs out
Nearby sold comps map
Loading sold comps map…
Walkable amenities ~0.75 mi
Loading nearby amenities…
Taxation est. · year 1
- Rental income
- $23,575
- − Mortgage interest
- −$7,618
- − Property taxes
- −$2,465
- − Insurance
- −$680
- − Repairs & maintenance
- −$1,886
- − Management
- −$1,886
- − HOA
- −$3,600
- − Depreciation
- −$3,956
- Taxable income
- $1,484
- Est. tax owed @ 24.0%
- −$356
- After-tax cash flow
- $2,965/yr
For passive investors: Depreciation is non-cash, so a rental often shows a tax loss while cash-flowing — sheltering income. Rental losses are passive: they offset passive income freely, and up to $25,000/yr can offset ordinary (W-2) income if you actively participate and your MAGI is under $100k (phasing out to $0 by $150k); unused losses carry forward. On sale, claimed depreciation is recaptured at up to 25%, and gains may owe capital-gains tax (a 1031 exchange can defer both). Figures are a year-1 estimate at your 24.0% rate — not tax advice; consult a CPA.
Schools (NCES district)
- District
- Charlotte
- NCES district ID
- 1200240
- Math proficiency
- 54% ▼ -6.00%
- Reading proficiency
- 54% ▼ -1.00%
- Median HH income
- $44,864
- Composite
- 45.62/100
- National rank
- #2586
- State rank
- #22 of 73 in FL
Livability — Port Charlotte
- Score
- 65/100
- State rank
- #655
- US rank
- #13081
Category grades
Schools grade is shown separately in the Schools card above.
Census & demographics
- County
- Charlotte County · 196,994 people
- City population
- 102,180
- Metro
- Punta Gorda, FL
- Population (ZIP)
- 13,120
- Household income
- $63,591
- Rent vs Own
- Severe rent burden
- 612.0
Population outlook (Charlotte County) Hauer SSP2
- Today (2025)
- 198,646 people
- By 2030
- 210,507 · +6.0%
- By 2040
- 230,857 · +16.2%
- By 2050
- 247,148 · +24.4%
- By 2075
- 281,777 · +41.8%
- By 2100
- 293,609 · +47.8%
Race, ethnicity, and origin ACS 2023
- Neighborhood character
- Predominantly White (75%)
- Race & ethnicity
- White 75% Hispanic / Latino 10% Two or more races 10% Black 9%
- Hispanic origin (detail)
- Puerto Rican 3% Cuban 2% Dominican 2%
- Common ancestry
- Romanian 5% Hispanic 4% Slovak 3%
- Foreign-born
- 16% · Canada, Jamaica
- Languages at home
- 85% English-only · Spanish 8% French/Haitian/Cajun 5% German/W. Germanic 1%
Political lean MEDSL · Charlotte
- 2024 margin
- Solid R (+34.0) · D 32.7% · R 66.7%
- 2008→2024 swing
- -26.7pp toward R · 2008: -7.2pp · 2024: -34.0pp
- All cycles
- 2024: R+34.0 2020: R+26.6 2016: R+27.8 2012: R+14.3 2008: R+7.2
Not yet ingested
- Civics
- —
Market trends
- HPI YoY
- ▼ -16.02%
- Current HPI
- 306.3331
- Rent YoY
- ▼ -4.04%
- Metro
- Punta Gorda, FL
- State GDP YoY
- ▲ 3.28%
- F500 in state
- 36
Industry mix (Fortune 500 HQ in FL)
| Industry | F500 HQs | Revenue |
|---|---|---|
| Industrial Technology | 2 | $29B |
|
||
| Insurance | 2 | $17B |
|
||
| Retail | 1 | $60B |
|
||
| Technology Distribution | 1 | $58B |
|
||
| Homebuilding | 1 | $35B |
|
||
| Technology Manufacturing | 1 | $35B |
|
||
Price history
+142.8% since first listed10 events — show timeline
- 2026-03-10 Price Changed $135,990 Stellar MLS as Distributed by MLS Grid
- 2026-02-25 Price Changed $139,990 Stellar MLS as Distributed by MLS Grid
- 2026-01-22 Relisted — Stellar MLS as Distributed by MLS Grid
- 2025-12-05 Pending — Stellar MLS as Distributed by MLS Grid
- 2025-06-25 Listed $150,000 Stellar MLS as Distributed by MLS Grid
- 2025-06-23 Listing Removed — Stellar MLS as Distributed by MLS Grid
- 2025-05-17 Price Changed $124,900 Stellar MLS as Distributed by MLS Grid
- 2025-03-21 Listed $144,900 Stellar MLS as Distributed by MLS Grid
- 2025-03-03 Sold (Public Records) $56,500 Public Records
- 2003-02-19 Sold (Public Records) $56,000 Public Records
Property tax history
+9.2%/yrLatest (2025): $2,465 · -11.0% YoY. Source: county tax records.
Cash-flow waterfall
monthlySold comps — $/sqft
last 12 mo · ≤1 miLoading sold comps…