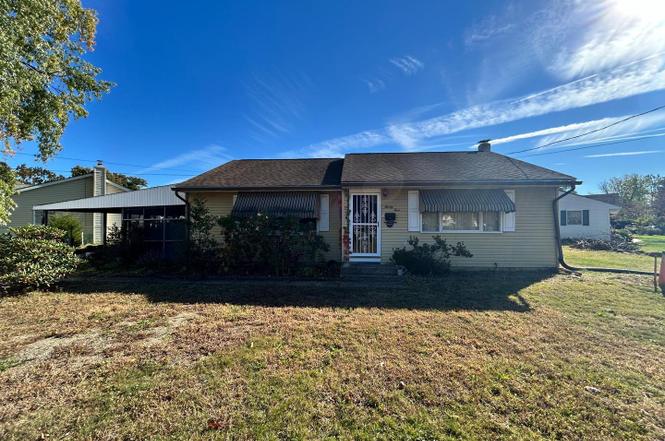
24 W Lois Dr · Williamstown, NJ
Flood risk 1/10 · Minimal
- FEMA flood zone
- X (unshaded)
- Chance of flooding over 30 yrs
- 0.0%
- Est. flood insurance / yr
- $507 – $1,088
Fire risk 3/10 · Minor
- Est. fire insurance / yr
- $526 – $976
Heat risk 7/10 · Major
- Hot days now (above 104°F)
- 7 days/yr
- Hot days in 30 yrs
- 15 days/yr
Wind risk 6/10 · Moderate
- Chance of severe wind over 30 yrs
- 65.0%
Air-quality risk 3/10 · Minor
- Unhealthy air days now
- 2 days/yr
- Unhealthy air days in 30 yrs
- 4 days/yr
Risk factors via First Street. Map © Google.
Why this score? — see what drove the B+ grade
The composite is a weighted blend of 9 inputs, each scored 0–100. Each bar is that input's sub-score; the figure is the points it added to the 100-point composite (weight × sub-score).
- Cash flow +30.0/30.0
- ARV discount +15.0/15.0
- 1% rule +10.0/10.0
- DSCR +10.0/10.0
- Livability +3.5/5.0
- Schools +3.0/10.0
- Rent growth +2.5/5.0
- Condition / age +2.5/5.0
- Appreciation +0.0/10.0
$120,000
🖨 Deal sheet 📄 Offer letter ✓ Due diligence
Listing remarks
NO SHOWINGS. Reverse Mortgage. Short Sale. This ranch offers an incredible investment opportunity for anyone ready to take on a full renovation project. The home is currently in need of complete cleanup and repair, but the bones are solid and the potential is high. Featuring central air, forced hot air heating, and gas utilities (currently off), this property provides a great foundation for a fresh start. The layout includes a single-level floor plan with a carport and a full unfinished basement—ideal for added storage or future expansion. While the property requires a total overhaul inside and out, it’s a blank canvas for an experienced investor, contractor. Being sold strictly
Key facts
- Gas utilities
- Carport
- Central air
Tags
Neighborhood map
What this means for you Summary
Snapshot
- This is a 3-bed/1.0-bath single-family listed at $120k.
Deal economics
- At list price, monthly cash flow is $933 ($11k/yr) — positive.
- The deal already cash-flows at list — no discount required.
- Meets the 1% rule at list price ($3k rent vs $120k).
- Cap rate 15.6% vs local median 4.9% in Williamstown — top-decile yield for the area; either an underpriced asset or a hidden risk that comps aren't pricing in. Stress-test before assuming the spread holds.
Location & tenants
- Location reads 69/100 on livability (#289 in NJ) — a middle-class / working-renter tenant base. Strengths: employment A+, housing A+; Watch: cost of living D+, amenities F, commute F.
- Monroe Township Public School District (suburban): math 20% / reading 45% proficiency, ranked #302 of 472 in NJ (top 64%) — families likely to look elsewhere, expect single-tenant / working-renter base with shorter leases.
- Zoned schools: Williamstown High School (math 21% / reading 50%, grade F, #234 of 399 statewide, top 59%, 1,782 students, 26% FRL) — zoned schools at 26% FRL track the district average.
- Market conditions: 268 active listings in the ZIP; 8 comparable units currently listed for rent nearby; rentals leasing fast (median 2d on market — plan ~1-2 weeks tenant-placement turnaround); solid renter incomes; 1,047 units permitted in Gloucester County in 2024 (183 in 5+ unit buildings).
- This rent runs 32% of the median local income ($97k/yr) — at the standard rent-burdened threshold; future hikes will face affordability resistance.
Forward outlook
- Local home prices are declining (-3.0%/yr); year-one equity from $830 of loan paydown is wiped out by about $4k of value loss. Plan a longer hold.
- Gloucester County population projected to shrink 5% by 2050 — rents likely to lag national; underwrite the cash flow, not the appreciation.
- At projected returns (-3.0% appreciation + 3.0% rent growth), your $34k cash investment doubles in ~4 years — after that, you're playing with house money.
Negotiation context
- Only 7 days on market — expect competitive offers; lowballing is unlikely to land.
Risks & watch-outs
- Watch-outs: property tax is 4.3% of price; built in 1954 — expect roof / HVAC / electrical / plumbing capex.
- Climate carrying-cost: major wind risk, 65% chance of damaging wind over 30y; extreme-heat days projected 7→15/yr by 2055 (HVAC capex compounding) — expect insurance premiums to compound above CPI over the hold.
Questions for the listing agent
- Built in 1954 — when were the roof, HVAC, electrical panel, plumbing, and water heater last replaced?
- Property tax is high relative to price — has the assessment been appealed recently, and will the sale trigger a re-assessment?
- Is there a deadline driving the sale (1031 exchange, divorce, estate, relocation)? That informs how much negotiation room exists.
- What's the average days-on-market for RENTAL listings here right now (not sales)? A rising rental-DOM trend means longer vacancies and softer asking-rent achievability than the comps imply.
- What's the recent tenant-quality profile in this submarket — average credit score on applications, eviction rate, late-payment / NSF rate, and stable-employment percentage? A property-management company in the area should have these aggregated.
- How much new for-sale + rental construction is in the pipeline within 1–3 miles? Heavy new supply typically softens prices + rents 12–24 months out; constrained supply supports both.
Investment metrics
- 1% rule
- 2.16% ✓
- Cap rate
- 15.62%
- Cash-on-cash
- 33.32%
- DSCR
- 2.48
- GRM
- 3.9
CMA / ARV
- ARV (on-the-fly)
- $233,060
- Comps found
- 9
Show comp detail 9 sales within ~0.75 mi
| Address | Dist | Beds/Ba | Sqft | Sold | Price | $/sf | Match |
|---|---|---|---|---|---|---|---|
| 314 Lake Ave | 0.60mi | 3/1.0 | 1,064 (-2%) | 2mo | $205,000 | $193 | 68 |
| 651 Charlotte Ave | 0.47mi | 3/1.5 | 1,158 (+7%) | 2mo | $269,000 | $232 | 63 |
| 323 Florence Blvd | 0.62mi | 3/1.0 | 1,008 (-7%) | 3mo | $275,000 | $273 | 57 |
| 1201 N Main St | 0.46mi | 2/1.0 (-1) | 1,077 (-1%) | 20mo | $167,700 | $156 | 56 |
| 60 Lindale Ave | 0.61mi | 3/1.0 | 1,020 (-6%) | 11mo | $280,000 | $275 | 52 |
| 22 Harrell Ave | 0.50mi | 2/1.0 (-1) | 1,056 (-3%) | 21mo | $300,000 | $284 | 50 |
| 446 Prince Ave | 0.59mi | 2/2.0 (-1) | 1,032 (-5%) | 11mo | $155,000 | $150 | 47 |
| 418 N Main St | 0.57mi | 3/2.0 | 1,224 (+13%) | 12mo | $263,000 | $215 | 38 |
| 728 Prince Ave | 0.72mi | 2/2.0 (-1) | 1,001 (-8%) | 10mo | $170,000 | $170 | 37 |
Match score weights: distance 35% · size 25% · config 20% · recency 20%. Top-matched comps best support the ARV.
Projected returns pro-forma
-3.0% appreciation · 3.0% rent growth · sell at horizon
- IRR
- 28.7%
- Equity multiple
- 2.20×
- Total profit
- $40,194
- Equity at exit
- $17,892
- IRR
- 36.1%
- Equity multiple
- 4.34×
- Total profit
- $112,386
- Equity at exit
- $10,375
Cash invested: $33,600 (down + closing). Projections, not guarantees.
Landlord ↔ Tenant lean methodology
- Overall (STATE)
- 21 Tenant-Leaning
- State New Jersey
- 21 Tenant-Leaning · D+6
- County
- — inherits STATE
- City
- — inherits STATE
ZIP-level market 08094
- Active inventory
- 268
- Price-to-rent
- 3.9×
Monthly cashflow live
- Estimated rent
- $2,589 high interval (Pro) →
- Mortgage (P&I)
- −$629
- Tax from tax record
- −$433 /mo · $5,194/yr
- Insurance
- −$50
- HOA
- −$0
- Vacancy / Maint / Mgmt
- −$544
- Net cashflow
- $933
Break-even live
UW: 25.0% down · 7.5% · 30yr · 1.5% tax · 5.0% vac · 8.0% maint · 8.0% mgmt
Financing live
Cash to close
- Down payment
- $30,000
- Closing costs
- $3,600
- Reserves months
- —
- Total cash needed
- —
Loan-product check · same deal, 3 products live
Conventional
25% down · 7.5% · 30yr
- Down + closing
- —
- Monthly P&I
- —
- Monthly cashflow
- —
- DSCR
- —
- Eligible?
- —
Personal DTI + credit; lowest rate.
DSCR
20% down · 8.5% · 30yr
- Down + closing
- —
- Monthly P&I
- —
- Monthly cashflow
- —
- DSCR
- —
- Eligible?
- —
No personal income docs; deal must DSCR.
Hard money
10% down · 12.0% · 12mo
- Down + closing
- —
- Monthly P&I
- —
- Monthly cashflow
- —
- DSCR
- —
- Eligible?
- —
Short-term bridge; refi at stabilization.
Rent comps 8 comps
| Address | Beds | Baths | Sqft | Rent | $/sqft | DOM | Units | Dist |
|---|---|---|---|---|---|---|---|---|
| 601 N Black Horse Pike Williamstown, NJ | 2.0 | 1.0 | 760 | $1,938 | $2.55 | 1d | 1 | 0.46mi |
| 401 N Main St Williamstown, NJ | 1.0–2.0 | 1.0 | 860 | $1,825 | $2.12 | 1d | 1 | 0.48mi |
| 343 Brookdale Blvd Williamstown, NJ | 3.0 | 2.5 | 1438 | $2,500 | $1.74 | 1d | 1 | 0.66mi |
| 15 Kent Rd Williamstown, NJ | 1.0–2.0 | 1.0 | 850 | $1,925 | $2.26 | 1d | 1 | 0.93mi |
| 401 Blue Bell Rd Unit C Williamstown, NJ | 3.0 | 1.0 | 1000 | $1,700 | $1.70 | 1d | 1 | 1.27mi |
| 62 Washington Ave Williamstown, NJ | 3.0 | 1.5 | 1434 | $2,600 | $1.81 | 7d | 1 | 1.28mi |
| 1941 N Black Horse Pike Williamstown, NJ | 1.0–2.0 | 1.0 | 832 | $1,662 | $2.00 | 4d | 1 | 1.38mi |
| 1616 N Main St Williamstown, NJ | 2.0 | 2.0 | 1064 | $2,500 | $2.35 | 1d | 1 | 1.47mi |
Listing history 2 events
-
2025-10-28status Pending
-
2025-10-21$120,000 Active
ⓘ Source: listings_history table (triggers on properties + properties_extension) + one-shot
backfill from property_details.listing_events for pre-trigger history.
Tax reassessment forecast NJ · Partial reset (capped growth)
- Current annual tax
- $5,194 · $433/mo
- Projected year-2 tax
- $5,194 · $433/mo
- Expected delta
- $0/yr ($0/mo · 0.0%)
ⓘ Screening estimate from a state-policy table — verify with the county assessor before closing.
Climate risk First Street
- Flood 1/10 Low FEMA zone X (unshaded) · 0% chance over 30 yrs
- Wildfire 3/10 Moderate
- Heat 7/10 Severe 7 d/yr ≥104°F today · 15 d/yr by 30 yrs out
- Wind 6/10 Major 65% chance of damaging wind over 30 yrs
- Air quality 3/10 Moderate 2 unhealthy d/yr today · 4 by 30 yrs out
Nearby sold comps map
Loading sold comps map…
Walkable amenities ~0.75 mi
Loading nearby amenities…
Taxation est. · year 1
- Rental income
- $31,066
- − Mortgage interest
- −$6,722
- − Property taxes
- −$5,194
- − Insurance
- −$600
- − Repairs & maintenance
- −$2,485
- − Management
- −$2,485
- − Depreciation
- −$3,491
- Taxable income
- $10,089
- Est. tax owed @ 24.0%
- −$2,421
- After-tax cash flow
- $8,775/yr
For passive investors: Depreciation is non-cash, so a rental often shows a tax loss while cash-flowing — sheltering income. Rental losses are passive: they offset passive income freely, and up to $25,000/yr can offset ordinary (W-2) income if you actively participate and your MAGI is under $100k (phasing out to $0 by $150k); unused losses carry forward. On sale, claimed depreciation is recaptured at up to 25%, and gains may owe capital-gains tax (a 1031 exchange can defer both). Figures are a year-1 estimate at your 24.0% rate — not tax advice; consult a CPA.
Schools (NCES district)
- District
- Monroe Township Public School District
- NCES district ID
- 3410470
- Math proficiency
- 20% ▼ -24.00%
- Reading proficiency
- 45% ▼ -9.00%
- Median HH income
- $71,557
- Composite
- 30.24/100
- National rank
- #6295
- State rank
- #302 of 472 in NJ
Livability — Williamstown
- Score
- 69/100
- State rank
- #289
- US rank
- #8603
Category grades
Schools grade is shown separately in the Schools card above.
Census & demographics
- Census place
- Williamstown, NJ
- County
- Gloucester County · 160,422 people
- City population
- 41,595
- Metro
- Philadelphia-Camden-Wilmington, PA-NJ-DE-MD
- Population (ZIP)
- 41,595
- Household income
- $96,699
- Rent vs Own
- Severe rent burden
- 721.0
Population outlook (Gloucester County) Hauer SSP2
- Today (2025)
- 298,895 people
- By 2030
- 299,031 · +0.0%
- By 2040
- 294,020 · -1.6%
- By 2050
- 284,188 · -4.9%
- By 2075
- 260,720 · -12.8%
- By 2100
- 229,565 · -23.2%
Race, ethnicity, and origin ACS 2023
- Neighborhood character
- Predominantly White (73%)
- Race & ethnicity
- White 73% Hispanic / Latino 11% Black 10% Two or more races 8% Asian 1%
- Hispanic origin (detail)
- Puerto Rican 6% Dominican 1%
- Common ancestry
- Romanian 6% Slovak 2% Lithuanian 1%
- Foreign-born
- 4% · Canada
- Languages at home
- 92% English-only · Spanish 5% Russian/Polish/Slavic 1%
Political lean MEDSL · Gloucester
- 2024 margin
- Toss-up / Even · D 47.8% · R 50.6% · Other 1.6%
- 2008→2024 swing
- -15.0pp toward R · 2008: 12.2pp · 2024: -2.8pp
- All cycles
- 2024: R+2.8 2020: D+1.9 2016: R+0.4 2012: D+10.5 2008: D+12.2
Not yet ingested
- Civics
- —
Market trends
- HPI YoY
- ▼ -213.12%
- Current HPI
- 278.3849
- Rent YoY
- —
- Metro
- Philadelphia-Camden-Wilmington, PA-NJ-DE-MD
- State GDP YoY
- ▲ 2.05%
- F500 in state
- 34
Industry mix (Fortune 500 HQ in NJ)
| Industry | F500 HQs | Revenue |
|---|---|---|
| Consumer Goods | 3 | $31B |
|
||
| Pharmaceuticals | 2 | $153B |
|
||
| Technology | 2 | $21B |
|
||
| Insurance | 2 | $20B |
|
||
| Healthcare | 2 | $19B |
|
||
| Financial Services | 1 | $70B |
|
||
Price history
2 events — show timeline
- 2025-10-28 Pending — BRIGHT MLS
- 2025-10-21 Listed $120,000 BRIGHT MLS
Property tax history
+1.6%/yrLatest (2025): $5,194 · +2.9% YoY. Source: county tax records.
Cash-flow waterfall
monthlySold comps — $/sqft
last 12 mo · ≤1 miLoading sold comps…