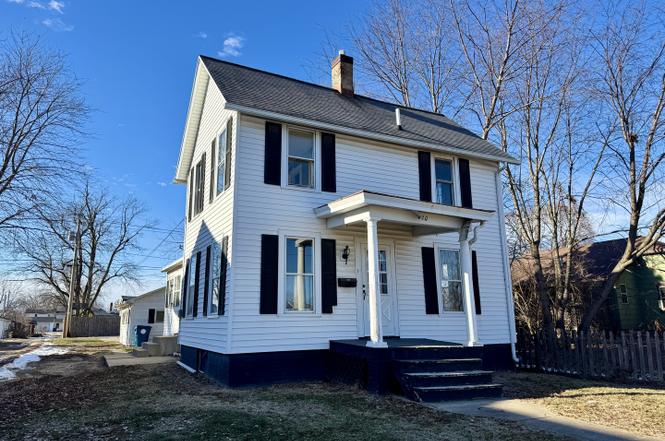
420 N Church St · Princeton, IL
Flood risk 1/10 · Minimal
- FEMA flood zone
- X (unshaded)
- Chance of flooding over 30 yrs
- 0.0%
- Est. flood insurance / yr
- $473 – $860
Fire risk 1/10 · Minimal
- Est. fire insurance / yr
- $804 – $1,492
Heat risk 3/10 · Minor
- Hot days now (above 103°F)
- 7 days/yr
- Hot days in 30 yrs
- 17 days/yr
Wind risk 2/10 · Minimal
- Chance of severe wind over 30 yrs
- 0.0%
Air-quality risk 3/10 · Minor
- Unhealthy air days now
- 2 days/yr
- Unhealthy air days in 30 yrs
- 4 days/yr
Risk factors via First Street. Map © Google.
Why this score? — see what drove the B- grade
The composite is a weighted blend of 9 inputs, each scored 0–100. Each bar is that input's sub-score; the figure is the points it added to the 100-point composite (weight × sub-score).
- Cash flow +24.0/30.0
- ARV discount +15.0/15.0
- 1% rule +7.7/10.0
- DSCR +7.7/10.0
- Livability +4.1/5.0
- Schools +2.9/10.0
- Rent growth +2.5/5.0
- Condition / age +2.5/5.0
- Appreciation +0.0/10.0
$84,000
🖨 Deal sheet (PDF) 📄 Offer letter ✓ Due diligence
Listing remarks MLS
Move right in to this 3 bedroom, 1.5 bath home with it's large eat in kitchen, main floor laundry, nice large living room with crown molding and great room sizes. One bedroom on the main floor plus two additional bedrooms upstairs with a bathroom on each floor. Two car detached garage. Many rooms freshly painted. Updated electrical box and central air. This is a great home at a great price so call your broker today!
Key facts
- Brand-new windows
- Main floor laundry
- 5,619 sq ft lot
Tags
Property features AI
Finance
- HOA & community: No master association fee required
Exterior
- Parking: Detached garage with 2 garage spaces (2 total parking spaces)
- Utilities: Public water; Public sewer; Electric service with circuit breakers and 100 amp service
- Home design: Detached single-family home; 2-story
- Construction: Vinyl siding; Asphalt roof; Built over 100 years ago; Home built before 1978
- Exterior features: Lot dimensions approximately 43 x 130; Lot size less than 0.25 acre
Interior
- Kitchen: Kitchen with eating area (approx. 13 x 15); Range; Refrigerator
- Bedrooms: 3 bedrooms (Master and Bedroom 2 on second level; Bedroom 3 on main level); Bedroom 2 approx. 15 x 9; Master bedroom approx. 13 x 15; Bedroom 3 approx. 11 x 10
- Bathrooms: 1 full bathroom; 1 half bathroom
- Heating & cooling: Natural gas forced air heating; Central air conditioning
- Interior features: Unfinished full basement; 5 total rooms
- Laundry & utility: Washer and Dryer included; Utility room on main level (approx. 9 x 6); Separate laundry room
Neighborhood map
What this means for you Summary
Snapshot
- This is a 3-bed/1.5-bath single-family listed at $84k.
Deal economics
- At list price, monthly cash flow is $165 ($2k/yr) — positive.
- The deal already cash-flows at list — no discount required.
- Meets the 1% rule at list price ($1k rent vs $84k).
- Recommended offer: $74k (12.0% below list) — sets the bar for market timing.
- Cap rate 8.6% vs local median 2.2% in Princeton — top-decile yield for the area; either an underpriced asset or a hidden risk that comps aren't pricing in. Stress-test before assuming the spread holds.
Location & tenants
- Location reads 82/100 on livability (#62 in IL, #1,086 nationally) — a professional / high-income tenant draw. Strengths: crime A+, cost of living A+, housing A+; Watch: schools D+, amenities F.
- Princeton Hsd 500 (town): math 25% / reading 35% proficiency, ranked #488 of 919 in IL (top 53%) — families likely to look elsewhere, expect single-tenant / working-renter base with shorter leases.
- Market conditions: 44 active listings in the ZIP; 17 units permitted in Bureau County in 2024 (0 in 5+ unit buildings).
Forward outlook
- Local home prices are declining (-3.0%/yr); year-one equity from $581 of loan paydown is wiped out by about $3k of value loss. Plan a longer hold.
- Bureau County population projected at -25% by 2050 — secular population decline; favor cash flow + early exit over multi-decade hold.
Negotiation context
- It's been on market 184 days — a 12% lower offer ($74k) is reasonable based on typical stale-listing flexibility.
- 3 sale attempts since 5y ago; this cycle's ask has dropped $13k (13%) from the opening price — seller is motivated, your offer sets the floor, not the list.
Risks & watch-outs
- Watch-outs: property tax is 2.9% of price; built in 1891 — expect roof / HVAC / electrical / plumbing capex.
Questions for the listing agent
- It's been on market 184 days. Have you received any prior offers? Is the seller open to a 12% concession, seller financing, or rate buy-down credit?
- Built in 1891 — when were the roof, HVAC, electrical panel, plumbing, and water heater last replaced?
- Property tax is high relative to price — has the assessment been appealed recently, and will the sale trigger a re-assessment?
- Why hasn't it sold? Are there any deal-killer items the seller is aware of (foundation, flood, title, zoning, code violations)?
- Is there a deadline driving the sale (1031 exchange, divorce, estate, relocation)? That informs how much negotiation room exists.
- Schools are D-rated, which usually means shorter tenancies and higher turnover. Who's the typical renter profile here, and what's been the actual vacancy rate?
- What's the average days-on-market for RENTAL listings here right now (not sales)? A rising rental-DOM trend means longer vacancies and softer asking-rent achievability than the comps imply.
- What's the recent tenant-quality profile in this submarket — average credit score on applications, eviction rate, late-payment / NSF rate, and stable-employment percentage? A property-management company in the area should have these aggregated.
- How much new for-sale + rental construction is in the pipeline within 1–3 miles? Heavy new supply typically softens prices + rents 12–24 months out; constrained supply supports both.
Investment metrics
- 1% rule
- 1.27% ✓
- Cap rate
- 8.64%
- Cash-on-cash
- 8.40%
- DSCR
- 1.37
- GRM
- 6.6
CMA / ARV
- ARV (on-the-fly)
- $144,768
- Comps found
- 12
Show comp detail 12 sales within ~0.75 mi
| Address | Dist | Beds/Ba | Sqft | Sold | Price | $/sf | Match |
|---|---|---|---|---|---|---|---|
| 215 N Randolph St | 0.32mi | 3/1.0 | 1,216 (-3%) | 4mo | $141,000 | $116 | 75 |
| 126 N Randolph St | 0.36mi | 3/2.0 | 1,246 (-0%) | 10mo | $165,000 | $132 | 72 |
| 305 S Chestnut St | 0.49mi | 3/1.5 | 1,200 (-4%) | 8mo | $105,000 | $88 | 64 |
| 814 N 1st St | 0.35mi | 2/1.0 (-1) | 1,330 (+7%) | 2mo | $17,000 | $13 | 64 |
| 116 N 1st St | 0.32mi | 2/2.0 (-1) | 1,320 (+6%) | 9mo | $174,000 | $132 | 61 |
| 9 S Randolph St | 0.43mi | 2/1.0 (-1) | 1,202 (-4%) | 7mo | $122,000 | $101 | 61 |
| 702 N Vernon St | 0.17mi | 2/1.0 (-1) | 1,094 (-12%) | 7mo | $75,000 | $69 | 58 |
| 520 W Crown St | 0.63mi | 3/1.0 | 1,298 (+4%) | 12mo | $151,800 | $117 | 52 |
| 221 W Peru St | 0.59mi | 4/2.0 (+1) | 1,320 (+6%) | 8mo | $149,000 | $113 | 50 |
| 103 S Plum St | 0.65mi | 4/2.0 (+1) | 1,400 (+12%) | 5mo | $185,000 | $132 | 38 |
| 311 S Randolph St | 0.58mi | 2/1.0 (-1) | 1,077 (-14%) | 10mo | $125,000 | $116 | 35 |
| 698 Downey Dr | 0.75mi | 3/2.0 | 1,410 (+13%) | 9mo | $167,500 | $119 | 34 |
Match score weights: distance 35% · size 25% · config 20% · recency 20%. Top-matched comps best support the ARV.
Projected returns pro-forma
-3.0% appreciation · 3.0% rent growth · sell at horizon
- IRR
- -3.5%
- Equity multiple
- 0.87×
- Total profit
- $-3,055
- Equity at exit
- $12,525
- IRR
- 6.3%
- Equity multiple
- 1.47×
- Total profit
- $11,142
- Equity at exit
- $7,263
Cash invested: $23,520 (down + closing). Projections, not guarantees.
Landlord ↔ Tenant lean methodology
- Overall (STATE)
- 43 Moderately Tenant-Leaning
- State Illinois
- 43 Moderately Tenant-Leaning · D+7
- County
- — inherits STATE
- City
- — inherits STATE
ZIP-level market 61356
- Home prices YoY
- -26.4%
- Active inventory
- 44
- Price-to-rent
- 6.6×
Monthly cashflow live
- Estimated rent
- $1,066 medium interval (Pro) →
- Mortgage (P&I)
- −$441
- Tax from tax record
- −$202 /mo · $2,423/yr
- Insurance
- −$35
- HOA
- −$0
- Vacancy / Maint / Mgmt
- −$224
- Net cashflow
- $165
Break-even live
Sensitivity live
| Price | -10% $212 | -5% $188 | +0% $165 | +5% $141 | +10% $117 |
|---|---|---|---|---|---|
| Rent | -10% $80 | -5% $122 | +0% $165 | +5% $207 | +10% $249 |
| Rate | -1.0pp $207 | -0.5pp $186 | base $165 | +0.5pp $143 | +1.0pp $121 |
UW: 25.0% down · 7.5% · 30yr · 1.5% tax · 5.0% vac · 8.0% maint · 8.0% mgmt
Financing live
Cash to close
- Down payment
- $21,000
- Closing costs
- $2,520
- Reserves months
- —
- Total cash needed
- —
Loan-product check · same deal, 3 products live
Conventional
25% down · 7.5% · 30yr
- Down + closing
- —
- Monthly P&I
- —
- Monthly cashflow
- —
- DSCR
- —
- Eligible?
- —
Personal DTI + credit; lowest rate.
DSCR
20% down · 8.5% · 30yr
- Down + closing
- —
- Monthly P&I
- —
- Monthly cashflow
- —
- DSCR
- —
- Eligible?
- —
No personal income docs; deal must DSCR.
Hard money
10% down · 12.0% · 12mo
- Down + closing
- —
- Monthly P&I
- —
- Monthly cashflow
- —
- DSCR
- —
- Eligible?
- —
Short-term bridge; refi at stabilization.
Listing history 27 events
-
2026-06-21days on market $84,000 Active 184 DOM
-
2026-06-21days on market $84,000 Active 183 DOM
-
2026-06-18days on market $84,000 Active 181 DOM
-
2026-06-17days on market $84,000 Active 180 DOM
-
2026-06-16days on market $84,000 Active 179 DOM
-
2026-06-15days on market $84,000 Active 178 DOM
-
2026-06-13days on market $84,000 Active 176 DOM
-
2026-06-12days on market $84,000 Active 175 DOM
-
2026-06-09days on market $84,000 Active 172 DOM
-
2026-06-08days on market $84,000 Active 171 DOM
-
2026-06-07days on market $84,000 Active 170 DOM
-
2026-06-07days on market $84,000 Active 169 DOM
-
2026-06-04days on market $84,000 Active 166 DOM
-
2026-06-02days on market $84,000 Active 165 DOM
-
2026-06-01days on market $84,000 Active 164 DOM
-
2026-05-31days on market $84,000 Active 163 DOM
-
2026-05-31days on market $84,000 Active 162 DOM
-
2026-05-17status Active
-
2026-05-17price $84,000
-
2026-05-02historical Contingent - Continue to Show
-
2025-12-19$97,000 Active
-
2021-11-19soldstatus $89,000 Closed 419-char remark
Show marketing remark (419 chars)
Move right in to this 3 bedroom, 1.5 bath home with it's large eat in kitchen, main floor laundry, nice large living room with crown molding and great room sizes. One bedroom on the main floor plus two additional bedrooms upstairs with a bathroom on each floor. Two car detached garage. Many rooms freshly painted. Updated electrical box and central air. This is a great home at a great price so call your broker today!
-
2021-11-18soldstatus $89,000
-
2021-09-26status Active Under Contract 419-char remark
Show marketing remark (419 chars)
Move right in to this 3 bedroom, 1.5 bath home with it's large eat in kitchen, main floor laundry, nice large living room with crown molding and great room sizes. One bedroom on the main floor plus two additional bedrooms upstairs with a bathroom on each floor. Two car detached garage. Many rooms freshly painted. Updated electrical box and central air. This is a great home at a great price so call your broker today!
-
2021-09-07$89,900 Active 419-char remark
Show marketing remark (419 chars)
Move right in to this 3 bedroom, 1.5 bath home with it's large eat in kitchen, main floor laundry, nice large living room with crown molding and great room sizes. One bedroom on the main floor plus two additional bedrooms upstairs with a bathroom on each floor. Two car detached garage. Many rooms freshly painted. Updated electrical box and central air. This is a great home at a great price so call your broker today!
-
2017-10-23soldstatus $86,500
-
2012-09-10historical
ⓘ Source: listings_history table (triggers on properties + properties_extension) + one-shot
backfill from property_details.listing_events for pre-trigger history.
Tax reassessment forecast IL · Partial reset (capped growth)
- Current annual tax
- $2,423 · $202/mo
- Projected year-2 tax
- $2,423 · $202/mo
- Expected delta
- $0/yr ($0/mo · 0.0%)
ⓘ Screening estimate from a state-policy table — verify with the county assessor before closing.
Climate risk First Street
- Flood 1/10 Low FEMA zone X (unshaded) · 0% chance over 30 yrs
- Wildfire 1/10 Low
- Heat 3/10 Moderate 7 d/yr ≥103°F today · 17 d/yr by 30 yrs out
- Wind 2/10 Low 0% chance of damaging wind over 30 yrs
- Air quality 3/10 Moderate 2 unhealthy d/yr today · 4 by 30 yrs out
Nearby sold comps map
Loading sold comps map…
Walkable amenities ~0.75 mi
Loading nearby amenities…
Taxation est. · year 1
- Rental income
- $12,789
- − Mortgage interest
- −$4,705
- − Property taxes
- −$2,423
- − Insurance
- −$420
- − Repairs & maintenance
- −$1,023
- − Management
- −$1,023
- − Depreciation
- −$2,444
- Taxable income
- $751
- Est. tax owed @ 24.0%
- −$180
- After-tax cash flow
- $1,794/yr
For passive investors: Depreciation is non-cash, so a rental often shows a tax loss while cash-flowing — sheltering income. Rental losses are passive: they offset passive income freely, and up to $25,000/yr can offset ordinary (W-2) income if you actively participate and your MAGI is under $100k (phasing out to $0 by $150k); unused losses carry forward. On sale, claimed depreciation is recaptured at up to 25%, and gains may owe capital-gains tax (a 1031 exchange can defer both). Figures are a year-1 estimate at your 24.0% rate — not tax advice; consult a CPA.
Schools (NCES district)
- District
- Princeton Hsd 500
- NCES district ID
- 1732700
- Math proficiency
- 25% ▲ 5.00%
- Reading proficiency
- 35% ▼ -5.00%
- Median HH income
- $49,303
- Composite
- 28.95/100
- National rank
- #11941
- State rank
- #488 of 919 in IL
Livability — Princeton
- Score
- 82/100
- State rank
- #62
- US rank
- #1086
Category grades
Schools grade is shown separately in the Schools card above.
Census & demographics
- Census place
- Princeton, IL
- Population (ZIP)
- 10,739
Population outlook (Bureau County) Hauer SSP2
- Today (2025)
- 30,938 people
- By 2030
- 29,461 · -4.8%
- By 2040
- 26,296 · -15.0%
- By 2050
- 23,271 · -24.8%
- By 2075
- 17,749 · -42.6%
- By 2100
- 13,107 · -57.6%
Race, ethnicity, and origin ACS 2023
- Neighborhood character
- Predominantly White (89%)
- Race & ethnicity
- White 89% Two or more races 6% Hispanic / Latino 4% Asian 2%
- Common ancestry
- Romanian 3% Lithuanian 3% Slovak 2%
- Foreign-born
- 2% · Canada
- Languages at home
- 96% English-only · Spanish 1% Tagalog/Filipino 1% Other Asian/Pacific 1%
Political lean MEDSL · Bureau
- 2024 margin
- Strong R (+24.3) · D 36.9% · R 61.2% · Other 1.9%
- 2008→2024 swing
- -30.0pp toward R · 2008: 5.7pp · 2024: -24.3pp
- All cycles
- 2024: R+24.3 2020: R+21.5 2016: R+20.0 2012: R+0.2 2008: D+5.7
Not yet ingested
- Civics
- —
Market trends
- HPI YoY
- ▼ -64.13%
- Current HPI
- 178.9361
- Rent YoY
- —
- Metro
- —
- State GDP YoY
- ▲ 1.59%
- F500 in state
- 60
Industry mix (Fortune 500 HQ in IL)
| Industry | F500 HQs | Revenue |
|---|---|---|
| Insurance | 4 | $201B |
|
||
| Consumer Goods | 4 | $87B |
|
||
| Industrial Machinery | 3 | $64B |
|
||
| Healthcare | 2 | $55B |
|
||
| Retail / Pharmacy | 1 | $148B |
|
||
| Agriculture / Food | 1 | $86B |
|
||
Price history
-2.9% since first listed10 events — show timeline
- 2026-05-17 Relisted — MRED as Distributed by MLS Grid
- 2026-05-17 Price Changed $84,000 MRED as Distributed by MLS Grid
- 2026-05-02 Contingent — MRED as Distributed by MLS Grid
- 2025-12-19 Listed $97,000 MRED as Distributed by MLS Grid
- 2021-11-19 Sold (MLS) $89,000 MRED as Distributed by MLS Grid
- 2021-11-18 Sold (Public Records) $89,000 Public Records
- 2021-09-26 Pending — MRED as Distributed by MLS Grid
- 2021-09-07 Listed $89,900 MRED as Distributed by MLS Grid
- 2017-10-23 Sold (Public Records) $86,500 Public Records
- 2012-09-10 Listing Removed — MRED as Distributed by MLS Grid
Property tax history
+3.2%/yrLatest (2024): $2,423 · +7.3% YoY. Source: county tax records.
Cash-flow waterfall
monthlySold comps — $/sqft
last 12 mo · ≤1 miLoading sold comps…