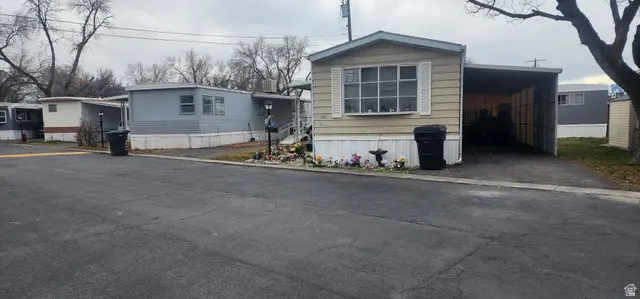
3024 S Heritage Dr W · West Valley City, UT
Flood risk 1/10 · Minimal
- FEMA flood zone
- X (unshaded)
- Chance of flooding over 30 yrs
- 0.0%
- Est. flood insurance / yr
- $507 – $1,088
Fire risk 1/10 · Minimal
- Est. fire insurance / yr
- $453 – $841
Heat risk 4/10 · Minor
- Hot days now (above 95°F)
- 6 days/yr
- Hot days in 30 yrs
- 15 days/yr
Wind risk 1/10 · Minimal
- Chance of severe wind over 30 yrs
- —
Air-quality risk 4/10 · Minor
- Unhealthy air days now
- 5 days/yr
- Unhealthy air days in 30 yrs
- 6 days/yr
Risk factors via First Street. Map © Google.
Why this score? — see what drove the D grade
The composite is a weighted blend of 9 inputs, each scored 0–100. Each bar is that input's sub-score; the figure is the points it added to the 100-point composite (weight × sub-score).
- Cash flow +15.0/30.0
- ARV discount +7.5/15.0
- 1% rule +5.0/10.0
- DSCR +5.0/10.0
- Livability +3.8/5.0
- Rent growth +2.7/5.0
- Schools +2.6/10.0
- Condition / age +2.5/5.0
- Appreciation +0.0/10.0
$23,500
🖨 Deal sheet 📄 Offer letter ✓ Due diligence
Listing remarks
Charming 2 bed, 1 bath home in a peaceful community! Well-loved and full of potential, this home offers a great opportunity to make it your own with a little updating. Affordable living with room to add your personal touch!
Key facts
- 2 parking spots
- Built 1978
- Listed 68 days
Property features AI
Finance
- Financial info: Residential current use
- HOA & community: Senior community; Clubhouse; Subdivision: American Heritage Retirement Community
Exterior
- Parking: 2 covered parking spaces; 2 carport spaces (carport present); 2 total parking spaces
- Security: Fire alarm
- Utilities: Natural gas connected; Electricity connected; Public sewer connected; Culinary (public) water
- Home design: Manufactured home; Single-level living; Built/standing
- Construction: Aluminum exterior; Asphalt roof; Built/standing
- Exterior features: Covered deck; Covered patio; Storage shed(s); Window coverings; Paved roads and sidewalks; Mature trees
Interior
- Kitchen: Gas oven; Gas range; Range hood
- Bedrooms: 2 bedrooms on the main level
- Flooring: Carpet; Linoleum
- Bathrooms: 1 full bathroom
- Heating & cooling: Gas central heating; Evaporative cooling
- Interior features: Fire alarm; Primary bathroom; Gas oven; Gas range; Blinds and drapes; Range hood; 6 total rooms
- Laundry & utility: Electric dryer hookup; Dryer (present)
Neighborhood map
What this means for you Summary
Snapshot
- This is a 2-bed/1.0-bath manufactured listed at $24k.
Deal economics
- At list price, monthly cash flow is $1k ($12k/yr) — positive.
- The deal already cash-flows at list — no discount required.
- Meets the 1% rule at list price ($1k rent vs $24k).
- Recommended offer: $22k (6.0% below list) — sets the bar for market timing.
Location & tenants
- Location reads 76/100 on livability (#55 in UT, #3,285 nationally) — a middle-class / working-renter tenant base. Strengths: commute A+, housing A+, employment A-; Watch: crime D-, amenities F, health & safety D-.
- Granite District (suburban): math 26% / reading 32% proficiency, ranked #69 of 80 in UT (top 86%) — low school quality limits family demand, transient renter base, plan for 1-2y turnover.
- Zoned schools: Stansbury School (math 12% / reading 17%, grade F, #559 of 585 statewide, top 96%, 623 students, 82% FRL); West Lake Jr High (math 14% / reading 22%, grade F, #132 of 138 statewide, top 96%, 701 students, 73% FRL); Granger High (math 7% / reading 22%, grade F, #167 of 171 statewide, top 98%, 3,481 students, 63% FRL) — zoned schools average 72% FRL vs 45% district-wide (27 pts higher); higher-poverty schools than district average — tighter screening recommended.
- Zoned-school proficiency averages 16% at this address vs 29% district-wide (-13 pts) — the specific schools serving this property underperform the Granite District average; the district grade overstates school quality for this exact location.
- Market conditions: Rents flat; 227 active listings in the ZIP; 24 comparable units currently listed for rent nearby; rentals at typical pace (median 14d on market — plan ~3-4 weeks tenant-placement turnaround); 4,970 units permitted in Salt Lake County in 2024 (1,963 in 5+ unit buildings).
Forward outlook
- Local home prices are declining (-3.0%/yr); year-one equity from $162 of loan paydown is wiped out by about $705 of value loss. Plan a longer hold.
- Salt Lake County population projected at +37% by 2050 — long-run rental-demand tailwind backs the buy-and-hold thesis.
- At projected returns (-3.0% appreciation + 0.7% rent growth), your $7k cash investment doubles in ~1 year — after that, you're playing with house money.
Negotiation context
- It's been on market 68 days — a 6% lower offer ($22k) is reasonable based on typical stale-listing flexibility.
Questions for the listing agent
- It's been on market 68 days. Have you received any prior offers? Is the seller open to a 6% concession, seller financing, or rate buy-down credit?
- Built in 1978 — when were the roof, HVAC, electrical panel, plumbing, and water heater last replaced?
- Why hasn't it sold? Are there any deal-killer items the seller is aware of (foundation, flood, title, zoning, code violations)?
- Is there a deadline driving the sale (1031 exchange, divorce, estate, relocation)? That informs how much negotiation room exists.
- Schools are F-rated, which usually means shorter tenancies and higher turnover. Who's the typical renter profile here, and what's been the actual vacancy rate?
- Crime grade is D in this area — have there been break-ins, vandalism, or insurance claims at this property in the last 3 years? What carrier currently insures it and at what premium?
- The area grade is low — what's the realistic commute time and amenity access for the typical tenant pool here? Any planned neighborhood developments (good or bad) we should know about?
- What's the average days-on-market for RENTAL listings here right now (not sales)? A rising rental-DOM trend means longer vacancies and softer asking-rent achievability than the comps imply.
- What's the recent tenant-quality profile in this submarket — average credit score on applications, eviction rate, late-payment / NSF rate, and stable-employment percentage? A property-management company in the area should have these aggregated.
- How much new for-sale + rental construction is in the pipeline within 1–3 miles? Heavy new supply typically softens prices + rents 12–24 months out; constrained supply supports both.
Investment metrics
- 1% rule
- 6.37% ✓
- Cap rate
- 58.38%
- Cash-on-cash
- 186.01%
- DSCR
- 9.28
- GRM
- 1.3
CMA / ARV
No comps found within radius.
Projected returns pro-forma
-3.0% appreciation · 0.74% rent growth · sell at horizon
- IRR
- —
- Equity multiple
- 9.79×
- Total profit
- $57,847
- Equity at exit
- $3,504
- IRR
- —
- Equity multiple
- 19.40×
- Total profit
- $121,060
- Equity at exit
- $2,032
Cash invested: $6,580 (down + closing). Projections, not guarantees.
Landlord ↔ Tenant lean methodology
- Overall (STATE)
- 86 Strongly Landlord-Friendly
- State Utah
- 86 Strongly Landlord-Friendly · R+15
- County
- — inherits STATE
- City
- — inherits STATE
ZIP-level market 84119
- Rents YoY
- 0.7%
- Active inventory
- 227
- Price-to-rent
- 1.3×
Monthly cashflow live
- Estimated rent
- $1,497 high interval (Pro) →
- Mortgage (P&I)
- −$123
- Tax est. 1.5%
- −$29 /mo · $352/yr
- Insurance
- −$10
- HOA
- −$0
- Vacancy / Maint / Mgmt
- −$314
- Net cashflow
- $1,020
Break-even live
UW: 25.0% down · 7.5% · 30yr · 1.5% tax · 5.0% vac · 8.0% maint · 8.0% mgmt
Financing live
Cash to close
- Down payment
- $5,875
- Closing costs
- $705
- Reserves months
- —
- Total cash needed
- —
Loan-product check · same deal, 3 products live
Conventional
25% down · 7.5% · 30yr
- Down + closing
- —
- Monthly P&I
- —
- Monthly cashflow
- —
- DSCR
- —
- Eligible?
- —
Personal DTI + credit; lowest rate.
DSCR
20% down · 8.5% · 30yr
- Down + closing
- —
- Monthly P&I
- —
- Monthly cashflow
- —
- DSCR
- —
- Eligible?
- —
No personal income docs; deal must DSCR.
Hard money
10% down · 12.0% · 12mo
- Down + closing
- —
- Monthly P&I
- —
- Monthly cashflow
- —
- DSCR
- —
- Eligible?
- —
Short-term bridge; refi at stabilization.
Rent comps 24 comps
| Address | Beds | Baths | Sqft | Rent | $/sqft | DOM | Units | Dist |
|---|---|---|---|---|---|---|---|---|
| 2184 W 3100 S West Valley City, UT | 1.0–2.0 | 1.0 | 650 | $1,477 | $2.27 | 2d | 13 | 0.23mi |
| 2184 W 3100 S West Valley City, UT | 1.0–2.0 | 1.0 | 650 | $1,477 | $2.27 | 23d | 6 | 0.23mi |
| 1941 W Hyannis Ave Unit 1 West Valley City, UT | 2.0 | 1.5 | 1001 | $1,600 | $1.60 | 23d | 1 | 0.24mi |
| 3058 Decker Lake Dr West Valley City, UT | 2.0 | 1.0–2.0 | 683 | $1,800 | $2.64 | 23d | 1 | 0.34mi |
| 1902 W 3395 S West Valley City, UT | 2.0 | 1.0 | 930 | $1,325 | $1.42 | 4d | 1 | 0.43mi |
| 2553 S Lake Park Cir Apt 2 West Valley City, UT | 2.0 | 1.0 | 950 | $1,200 | $1.26 | 23d | 1 | 0.74mi |
| 2530 S Parkcrest Dr Unit 3 Salt Lake City, UT | 2.0 | 1.0 | 850 | $1,599 | $1.88 | 23d | 1 | 0.76mi |
| 2350 S Parkcrest Dr Unit 3 West Valley City, UT | 2.0 | 1.0 | 900 | $1,599 | $1.78 | 23d | 1 | 0.82mi |
| 1821 Parkway Blvd Unit 1 Salt Lake City, UT | 2.0 | 1.0 | 842 | $1,399 | $1.66 | 16d | 1 | 0.82mi |
| 1801 Parkway Blvd Unit 1821-1 West Valley City, UT | 2.0 | 1.0 | 842 | $1,399 | $1.66 | 14d | 1 | 0.82mi |
| 3600 S Orion Cir West Valley City, UT | 1.0–3.0 | 1.0–1.5 | 1075 | $1,634 | $1.52 | 23d | 1 | 0.84mi |
| 1251 W Village Main Dr West Valley City, UT | 1.0–3.0 | 1.0–2.0 | 957 | $1,400 | $1.46 | 1d | 5 | 0.97mi |
| 2240 W 3800 S West Valley City, UT | 1.0–2.0 | 1.0 | 775 | $1,385 | $1.79 | 2d | 14 | 1.07mi |
| 2930 Baty Drive 2745 S Unit 2930 West Valley City, UT | 2.0 | 1.5 | 1100 | $1,695 | $1.54 | 23d | 1 | 1.08mi |
| 1499 2320 S West Valley City, UT | 2.0 | 1.5 | 1052 | $1,512 | $1.44 | 4d | 4 | 1.14mi |
| 3860 S Redwood Rd Salt Lake City, UT | 2.0 | 1.0–2.0 | 851 | $1,719 | $2.02 | 2d | 26 | 1.20mi |
| 3810 S Redwood Rd West Valley City, UT | 1.0–3.0 | 1.0–2.0 | 1110 | $1,624 | $1.46 | 1d | 46 | 1.21mi |
| 2600 W 3800 S West Valley City, UT | 2.0 | 1.0–2.0 | 912 | $2,205 | $2.42 | 3d | 100 | 1.21mi |
| 2640 W 3800 S Apt 3 Salt Lake City, UT | 2.0 | 1.0 | 965 | $1,125 | $1.17 | 4d | 1 | 1.28mi |
| 2640 W 3800 S West Valley City, UT | 2.0 | 1.0 | 965 | $1,125 | $1.17 | 4d | 1 | 1.28mi |
| 3735 Market St Unit 1 West Valley City, UT | 1.0 | 1.0 | 540 | $1,300 | $2.41 | 23d | 1 | 1.30mi |
| 3043 W 3500 S West Valley City, UT | 2.0 | 1.0 | 950 | $1,149 | $1.21 | 23d | 1 | 1.30mi |
| 1580 W 3940 S Salt Lake City, UT | 1.0–2.0 | 1.0 | 921 | $1,495 | $1.62 | 2d | 7 | 1.36mi |
| 4040 W Boulder Pointe Salt Lake City, UT | 2.0 | 1.0 | 890 | $1,576 | $1.77 | 1d | 1 | 1.49mi |
Listing history 7 events
-
2026-06-18days on market $23,500 Active 68 DOM
-
2026-06-17days on market $23,500 Active 67 DOM
-
2026-06-16status $23,500 Active 66 DOM
-
2026-06-02status $23,500 Under Contract 66 DOM
-
2026-06-01days on market $23,500 Active 66 DOM
-
2026-05-31days on market $23,500 Active 65 DOM
-
2026-03-27$23,500 Active
ⓘ Source: listings_history table (triggers on properties + properties_extension) + one-shot
backfill from property_details.listing_events for pre-trigger history.
Climate risk First Street
- Flood 1/10 Low FEMA zone X (unshaded) · 0% chance over 30 yrs
- Wildfire 1/10 Low
- Heat 4/10 Moderate 6 d/yr ≥95°F today · 15 d/yr by 30 yrs out
- Wind 1/10 Low
- Air quality 4/10 Moderate 5 unhealthy d/yr today · 6 by 30 yrs out
Nearby sold comps map
Loading sold comps map…
Walkable amenities ~0.75 mi
Loading nearby amenities…
Taxation est. · year 1
- Rental income
- $17,960
- − Mortgage interest
- −$1,316
- − Property taxes
- −$352
- − Insurance
- −$118
- − Repairs & maintenance
- −$1,437
- − Management
- −$1,437
- − Depreciation
- −$684
- Taxable income
- $12,616
- Est. tax owed @ 24.0%
- −$3,028
- After-tax cash flow
- $9,212/yr
For passive investors: Depreciation is non-cash, so a rental often shows a tax loss while cash-flowing — sheltering income. Rental losses are passive: they offset passive income freely, and up to $25,000/yr can offset ordinary (W-2) income if you actively participate and your MAGI is under $100k (phasing out to $0 by $150k); unused losses carry forward. On sale, claimed depreciation is recaptured at up to 25%, and gains may owe capital-gains tax (a 1031 exchange can defer both). Figures are a year-1 estimate at your 24.0% rate — not tax advice; consult a CPA.
Schools (NCES district)
- District
- Granite District
- NCES district ID
- 4900360
- Math proficiency
- 26% ▼ -8.00%
- Reading proficiency
- 32% ▼ -3.00%
- Median HH income
- $55,971
- Composite
- 25.93/100
- National rank
- #7336
- State rank
- #69 of 80 in UT
Livability — West Valley City
- Score
- 76/100
- State rank
- #55
- US rank
- #3285
Category grades
Schools grade is shown separately in the Schools card above.
Census & demographics
- Census place
- West Valley City, UT
- County
- Salt Lake County · 1,195,750 people
- City population
- 132,995
- Metro
- Salt Lake City, UT
- Population (ZIP)
- 50,070
- Household income
- $71,378
- Rent vs Own
- Severe rent burden
- 1635.0
Population outlook (Salt Lake County) Hauer SSP2
- Today (2025)
- 1,305,860 people
- By 2030
- 1,402,611 · +7.4%
- By 2040
- 1,594,533 · +22.1%
- By 2050
- 1,787,244 · +36.9%
- By 2075
- 2,224,138 · +70.3%
- By 2100
- 2,551,390 · +95.4%
Race, ethnicity, and origin ACS 2023
- Neighborhood character
- Diverse neighborhood (Simpson 0.66)
- Race & ethnicity
- Hispanic / Latino 45% White 36% Two or more races 12% Black 5% Pacific Islander 4% Asian 4% Native American 3%
- Hispanic origin (detail)
- Mexican 36%
- Common ancestry
- Slovak 3% Portuguese 2% Italian 1%
- Foreign-born
- 27% · Canada, Vietnam, Jamaica
- Languages at home
- 54% English-only · Spanish 34% Other Asian/Pacific 3% Vietnamese 1%
Political lean MEDSL · Salt Lake
- 2024 margin
- D (+10.2) · D 53.7% · R 43.5% · Other 2.8%
- 2008→2024 swing
- +10.1pp toward D · 2008: 0.1pp · 2024: 10.2pp
- All cycles
- 2024: D+10.2 2020: D+11.0 2016: D+10.2 2012: R+19.3 2008: D+0.1
Not yet ingested
- Civics
- —
Market trends
- HPI YoY
- ▼ -332.72%
- Current HPI
- 327.1858
- Rent YoY
- ▲ 0.74%
- Metro
- Salt Lake City, UT
- State GDP YoY
- ▲ 3.54%
- F500 in state
- 2
Industry mix (Fortune 500 HQ in UT)
| Industry | F500 HQs | Revenue |
|---|---|---|
| Financial Services | 1 | $3B |
|
||
Price history
1 event — show timeline
- 2026-03-27 Listed $23,500 WFRMLS
Cash-flow waterfall
monthlySold comps — $/sqft
last 12 mo · ≤1 miLoading sold comps…