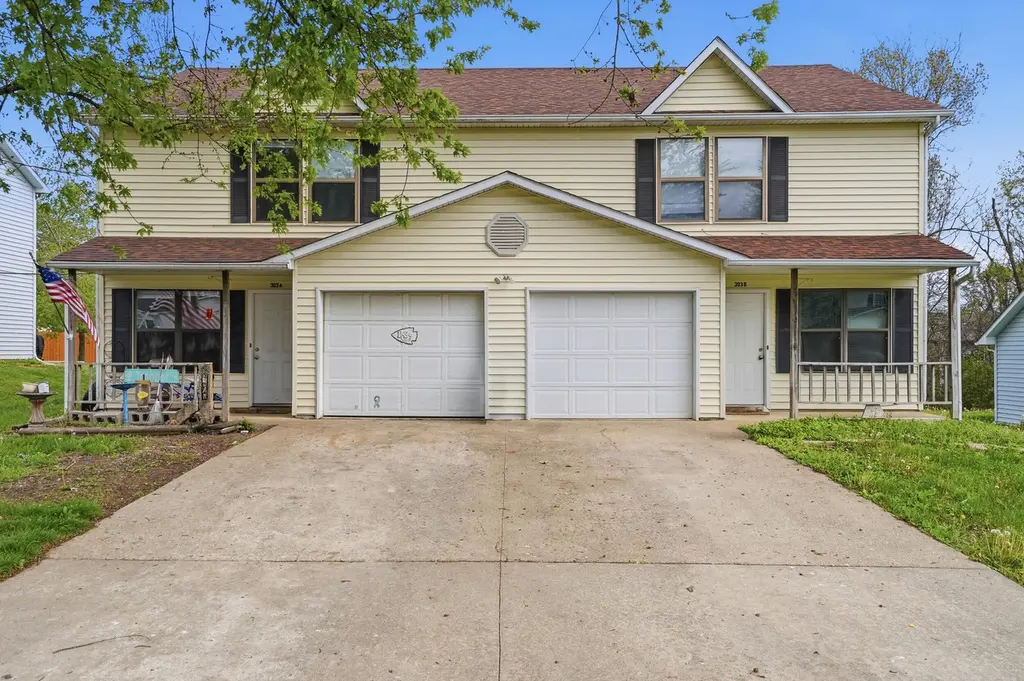
303 E Liberty Ln Unit A&B · Ashland, MO
Flood risk 1/10 · Minimal
- FEMA flood zone
- X (unshaded)
- Chance of flooding over 30 yrs
- 0.0%
- Est. flood insurance / yr
- $507 – $1,088
Fire risk 3/10 · Minor
- Est. fire insurance / yr
- $1,054 – $1,958
Heat risk 4/10 · Minor
- Hot days now (above 107°F)
- 7 days/yr
- Hot days in 30 yrs
- 19 days/yr
Wind risk 2/10 · Minimal
- Chance of severe wind over 30 yrs
- —
Air-quality risk 1/10 · Minimal
- Unhealthy air days now
- 0 days/yr
- Unhealthy air days in 30 yrs
- 0 days/yr
Risk factors via First Street. Map © Google.
Why this score? — see what drove the F grade
The composite is a weighted blend of 9 inputs, each scored 0–100. Each bar is that input's sub-score; the figure is the points it added to the 100-point composite (weight × sub-score).
- ARV discount +7.5/15.0
- Cash flow +5.0/30.0
- Schools +4.0/10.0
- Condition / age +3.8/5.0
- Livability +3.5/5.0
- Rent growth +2.5/5.0
- 1% rule +0.8/10.0
- DSCR +0.0/10.0
- Appreciation +0.0/10.0
$370,000
🖨 Deal sheet 📄 Offer letter ✓ Due diligence
Listing remarks MLS
Investor's Dream! This passive income-producing property features spacious units, each offering 3 bedrooms and 2.5 bathrooms. Both units have been thoughtfully updated in 2023 and 2024, providing modern finishes and turnkey appeal. Located in a desirable area with strong rental demand, this is a fantastic opportunity to add a solid, income-generating asset to your portfolio.
Key facts
- 0.24 acre lot
- Built 1991
- Listed 62 days
Neighborhood map
What this means for you Summary
Snapshot
- This is a condo listed at $370k. Condition is rated good.
Deal economics
- At list price, monthly cash flow is $-870 ($-10k/yr) — negative.
- To cash-flow at today's rent, offer at most $244k (34.0% below list).
- To meet the 1% rule (rent ≥ 1% of price), the offer needs to be $214k (42.3% below list).
- Recommended offer: $214k (42.3% below list) — sets the bar for 1% rule.
Location & tenants
- Location reads 69/100 on livability (#155 in MO) — a middle-class / working-renter tenant base. Strengths: employment A+, cost of living A+, housing A+; Watch: amenities F, commute F, health & safety F.
- Southern Boone County R-I (rural): math 42% / reading 48% proficiency, ranked #66 of 324 in MO (top 20%) — families likely to look elsewhere, expect single-tenant / working-renter base with shorter leases; only 16% free/reduced lunch — higher-income household profile.
- Market conditions: 133 active listings in the ZIP; 4 comparable units currently listed for rent nearby; rentals leasing fast (median 13d on market — plan ~1-2 weeks tenant-placement turnaround); 1,303 units permitted in Boone County in 2024 (549 in 5+ unit buildings).
Forward outlook
- Local home prices are declining (-3.0%/yr); year-one equity from $3k of loan paydown is wiped out by about $11k of value loss. Plan a longer hold.
- Boone County population projected at +36% by 2050 — long-run rental-demand tailwind backs the buy-and-hold thesis.
Negotiation context
- It's been on market 62 days — a 6% lower offer ($348k) is reasonable based on typical stale-listing flexibility.
- 7 sale attempts since 10y ago with the ask held roughly flat each time — persistent listings suggest the price (not the market) is what's stuck; bring a comps-based counter.
Questions for the listing agent
- What do current leases actually rent for vs. the listed asking? Can we see a recent rent roll and the last 12 months of T-12 income?
- It's been on market 62 days. Have you received any prior offers? Is the seller open to a 42% concession, seller financing, or rate buy-down credit?
- Any open or pending special assessments — roof, HVAC, plumbing, elevator, façade? What's the per-unit balance and payoff schedule, and is the seller paying it off at close or rolling it to the buyer?
- Why hasn't it sold? Are there any deal-killer items the seller is aware of (foundation, flood, title, zoning, code violations)?
- Is there a deadline driving the sale (1031 exchange, divorce, estate, relocation)? That informs how much negotiation room exists.
- The area grade is low — what's the realistic commute time and amenity access for the typical tenant pool here? Any planned neighborhood developments (good or bad) we should know about?
- What's the average days-on-market for RENTAL listings here right now (not sales)? A rising rental-DOM trend means longer vacancies and softer asking-rent achievability than the comps imply.
- What's the recent tenant-quality profile in this submarket — average credit score on applications, eviction rate, late-payment / NSF rate, and stable-employment percentage? A property-management company in the area should have these aggregated.
- How much new apartment / multifamily construction is in the pipeline within 1–3 miles? Heavy new supply (>2% of stock underway) typically softens rents 12–24 months out; light construction supports rent growth.
Investment metrics
- 1% rule
- 0.58% ✗
- Cap rate
- 3.47%
- Cash-on-cash
- -10.07%
- DSCR
- 0.55
- GRM
- 14.4
CMA / ARV
No comps found within radius.
Projected returns pro-forma
-3.0% appreciation · 3.0% rent growth · sell at horizon
- IRR
- -34.4%
- Equity multiple
- -0.11×
- Total profit
- $-115,313
- Equity at exit
- $55,168
- IRR
- -44.0%
- Equity multiple
- -0.66×
- Total profit
- $-171,604
- Equity at exit
- $31,991
Cash invested: $103,600 (down + closing). Projections, not guarantees.
Landlord ↔ Tenant lean methodology
- Overall (STATE)
- 81 Strongly Landlord-Friendly
- State Missouri
- 81 Strongly Landlord-Friendly · R+10
- County
- — inherits STATE
- City
- — inherits STATE
ZIP-level market 65010
- Home prices YoY
- -22.9%
- Active inventory
- 133
- Price-to-rent
- 14.4×
Monthly cashflow live
- Estimated rent
- $2,136 medium interval (Pro) →
- Mortgage (P&I)
- −$1,940
- Tax est. 1.5%
- −$462 /mo · $5,550/yr
- Insurance
- −$154
- HOA
- −$0
- Vacancy / Maint / Mgmt
- −$449
- Net cashflow
- $-870
Break-even live
UW: 25.0% down · 7.5% · 30yr · 1.5% tax · 5.0% vac · 8.0% maint · 8.0% mgmt
Financing live
Cash to close
- Down payment
- $92,500
- Closing costs
- $11,100
- Reserves months
- —
- Total cash needed
- —
Loan-product check · same deal, 3 products live
Conventional
25% down · 7.5% · 30yr
- Down + closing
- —
- Monthly P&I
- —
- Monthly cashflow
- —
- DSCR
- —
- Eligible?
- —
Personal DTI + credit; lowest rate.
DSCR
20% down · 8.5% · 30yr
- Down + closing
- —
- Monthly P&I
- —
- Monthly cashflow
- —
- DSCR
- —
- Eligible?
- —
No personal income docs; deal must DSCR.
Hard money
10% down · 12.0% · 12mo
- Down + closing
- —
- Monthly P&I
- —
- Monthly cashflow
- —
- DSCR
- —
- Eligible?
- —
Short-term bridge; refi at stabilization.
Rent comps 4 comps
| Address | Beds | Baths | Sqft | Rent | $/sqft | DOM | Units | Dist |
|---|---|---|---|---|---|---|---|---|
| 511 Turner Ave Ashland, MO | 3.0 | 1.5 | 1285 | $1,900 | $1.48 | 13d | 1 | 0.66mi |
| 15245 Regiment Dr Ashland, MO | 3.0 | 2.0 | 1503 | $2,200 | $1.46 | 13d | 1 | 0.79mi |
| 4680 Treaty Dr Ashland, MO | 3.0 | 2.0 | 1650 | $2,200 | $1.33 | 13d | 1 | 0.82mi |
| 15285 General Dr Ashland, MO | 3.0 | 2.0 | — | $2,300 | — | 13d | 1 | 0.82mi |
HOA detail condo
- Monthly dues
- $0 · $0/yr
- Assessments
- None detected in remarks — confirm with the listing agent.
Listing history 28 events
-
2026-06-19days on market $370,000 Active 62 DOM
-
2026-06-18days on market $370,000 Active 61 DOM
-
2026-06-17days on market $370,000 Active 60 DOM
-
2026-06-16days on market $370,000 Active 59 DOM
-
2026-06-15days on market $370,000 Active 58 DOM
-
2026-06-14days on market $370,000 Active 56 DOM
-
2026-06-13days on market $370,000 Active 55 DOM
-
2026-06-10days on market $370,000 Active 53 DOM
-
2026-06-09days on market $370,000 Active 52 DOM
-
2026-06-08days on market $370,000 Active 51 DOM
-
2026-06-07days on market $370,000 Active 50 DOM
-
2026-06-02days on market $370,000 Active 45 DOM
-
2026-06-01days on market $370,000 Active 44 DOM
-
2026-05-31days on market $370,000 Active 43 DOM
-
2026-05-30days on market $370,000 Active 42 DOM
-
2026-04-18$370,000 Active 377-char remark
Show marketing remark (377 chars)
Investor's Dream! This passive income-producing property features spacious units, each offering 3 bedrooms and 2.5 bathrooms. Both units have been thoughtfully updated in 2023 and 2024, providing modern finishes and turnkey appeal. Located in a desirable area with strong rental demand, this is a fantastic opportunity to add a solid, income-generating asset to your portfolio.
-
2026-04-14historical $370,000 377-char remark
Show marketing remark (377 chars)
Investor's Dream! This passive income-producing property features spacious units, each offering 3 bedrooms and 2.5 bathrooms. Both units have been thoughtfully updated in 2023 and 2024, providing modern finishes and turnkey appeal. Located in a desirable area with strong rental demand, this is a fantastic opportunity to add a solid, income-generating asset to your portfolio.
-
2025-11-25soldstatus Closed
-
2025-10-22status Pending
-
2025-06-06status Active
-
2025-06-06status Active
-
2025-05-25historical
-
2025-05-25status Pending
-
2025-05-13$350,000 Active
-
2025-05-06$350,000 Active
-
2016-09-17$165,775
ⓘ Source: listings_history table (triggers on properties + properties_extension) + one-shot
backfill from property_details.listing_events for pre-trigger history.
Climate risk First Street
- Flood 1/10 Low FEMA zone X (unshaded) · 0% chance over 30 yrs
- Wildfire 3/10 Moderate
- Heat 4/10 Moderate 7 d/yr ≥107°F today · 19 d/yr by 30 yrs out
- Wind 2/10 Low
- Air quality 1/10 Low 0 unhealthy d/yr today · 0 by 30 yrs out
Nearby sold comps map
Loading sold comps map…
Walkable amenities ~0.75 mi
Loading nearby amenities…
Taxation est. · year 1
- Rental income
- $25,630
- − Mortgage interest
- −$20,726
- − Property taxes
- −$5,550
- − Insurance
- −$1,850
- − Repairs & maintenance
- −$2,050
- − Management
- −$2,050
- − Depreciation
- −$10,764
- Taxable loss
- −$17,360
- Est. tax savings @ 24.0%
- +$4,166
- After-tax cash flow
- $-6,270/yr
For passive investors: Depreciation is non-cash, so a rental often shows a tax loss while cash-flowing — sheltering income. Rental losses are passive: they offset passive income freely, and up to $25,000/yr can offset ordinary (W-2) income if you actively participate and your MAGI is under $100k (phasing out to $0 by $150k); unused losses carry forward. On sale, claimed depreciation is recaptured at up to 25%, and gains may owe capital-gains tax (a 1031 exchange can defer both). Figures are a year-1 estimate at your 24.0% rate — not tax advice; consult a CPA.
Condition & rehab AI · 12 photos
This multi-family property offers spacious units with updated finishes and is located in a desirable area with strong rental demand. While it is in good condition, some cosmetic updates to the kitchen and bathrooms would significantly enhance its value.
Repairs flagged
- Moderate kitchen cabinets — dated and worn
- Moderate bathroom fixtures — dated and worn
- Minor kitchen flooring — slight wear
Value-add opportunities
- Both update kitchen cabinets and appliances — modernizing the kitchen would appeal to both buyers and renters
- Both update bathrooms with new fixtures and cabinetry — modernizing bathrooms would appeal to both buyers and renters
- Both replace carpet with hardwood flooring — hardwood flooring would increase both resale and rental value
Renovation cost estimate screening
| Repair item | Severity | Est. cost |
|---|---|---|
| kitchen cabinets · dated and worn | Moderate | $3,000–15,000 |
| bathroom fixtures · dated and worn | Moderate | $3,000–15,000 |
| kitchen flooring · slight wear | Minor | $500–3,000 |
| Total estimated repair cost · 3 items | $6,500–33,000 |
Value-add ROI direction
- Both update kitchen cabinets and appliances — modernizing the kitchen would appeal to both buyers and renters ↑
- Both update bathrooms with new fixtures and cabinetry — modernizing bathrooms would appeal to both buyers and renters ↑
- Both replace carpet with hardwood flooring — hardwood flooring would increase both resale and rental value ↑
ⓘ Cost ranges are severity-bucket heuristics (US national rule-of-thumb). Get contractor quotes + a written scope before underwriting a rehab budget.
Schools (NCES district)
- District
- Southern Boone County R-I
- NCES district ID
- 2928560
- Math proficiency
- 42% ▼ -3.00%
- Reading proficiency
- 48% ▼ -2.00%
- Median HH income
- $64,240
- Composite
- 39.98/100
- National rank
- #3833
- State rank
- #66 of 324 in MO
Livability — Ashland
- Score
- 69/100
- State rank
- #155
- US rank
- #8688
Category grades
Schools grade is shown separately in the Schools card above.
Census & demographics
- Census place
- Ashland, MO
- City population
- 7,105
- Population (ZIP)
- 7,105
Population outlook (Boone County) Hauer SSP2
- Today (2025)
- 202,891 people
- By 2030
- 217,799 · +7.3%
- By 2040
- 246,789 · +21.6%
- By 2050
- 276,116 · +36.1%
- By 2075
- 348,426 · +71.7%
- By 2100
- 400,856 · +97.6%
Race, ethnicity, and origin ACS 2023
- Neighborhood character
- Predominantly White (93%)
- Race & ethnicity
- White 93% Two or more races 5% Hispanic / Latino 2%
- Common ancestry
- Lithuanian 2% Romanian 2% Slovak 1%
- Foreign-born
- 1%
- Languages at home
- 99% English-only · Other Indo-European 1%
Political lean MEDSL · Boone
- 2024 margin
- Lean D (+9.8) · D 53.9% · R 44.1% · Other 2.1%
- 2008→2024 swing
- -2.2pp toward R · 2008: 12.0pp · 2024: 9.8pp
- All cycles
- 2024: D+9.8 2020: D+12.5 2016: D+5.9 2012: D+3.1 2008: D+12.0
Not yet ingested
- Civics
- —
Market trends
- HPI YoY
- ▼ -67.49%
- Current HPI
- 227.6769
- Rent YoY
- —
- Metro
- —
- State GDP YoY
- ▲ 1.84%
- F500 in state
- 20
Industry mix (Fortune 500 HQ in MO)
| Industry | F500 HQs | Revenue |
|---|---|---|
| Healthcare | 1 | $163B |
|
||
| Insurance | 1 | $21B |
|
||
| Industrial Technology | 1 | $17B |
|
||
| Retail | 1 | $16B |
|
||
| Industrial Distribution | 1 | $10B |
|
||
| Utilities | 1 | $9B |
|
||
Price history
+123.2% since first listed13 events — show timeline
- 2026-04-18 Listed $370,000 JCMLS
- 2026-04-18 Listed $370,000 CBORMLS
- 2026-04-14 Coming Soon $370,000 JCMLS
- 2026-04-14 Coming Soon $370,000 CBORMLS
- 2025-11-25 Sold (MLS) — JCMLS
- 2025-10-22 Pending — JCMLS
- 2025-06-06 Relisted — JCMLS
- 2025-06-06 Relisted — CBORMLS
- 2025-05-25 Delisted — CBORMLS
- 2025-05-25 Pending — JCMLS
- 2025-05-13 Listed $350,000 CBORMLS
- 2025-05-06 Listed $350,000 JCMLS
- 2016-09-17 Listed $165,775 CBORMLS
Cash-flow waterfall
monthlySold comps — $/sqft
last 12 mo · ≤1 miLoading sold comps…