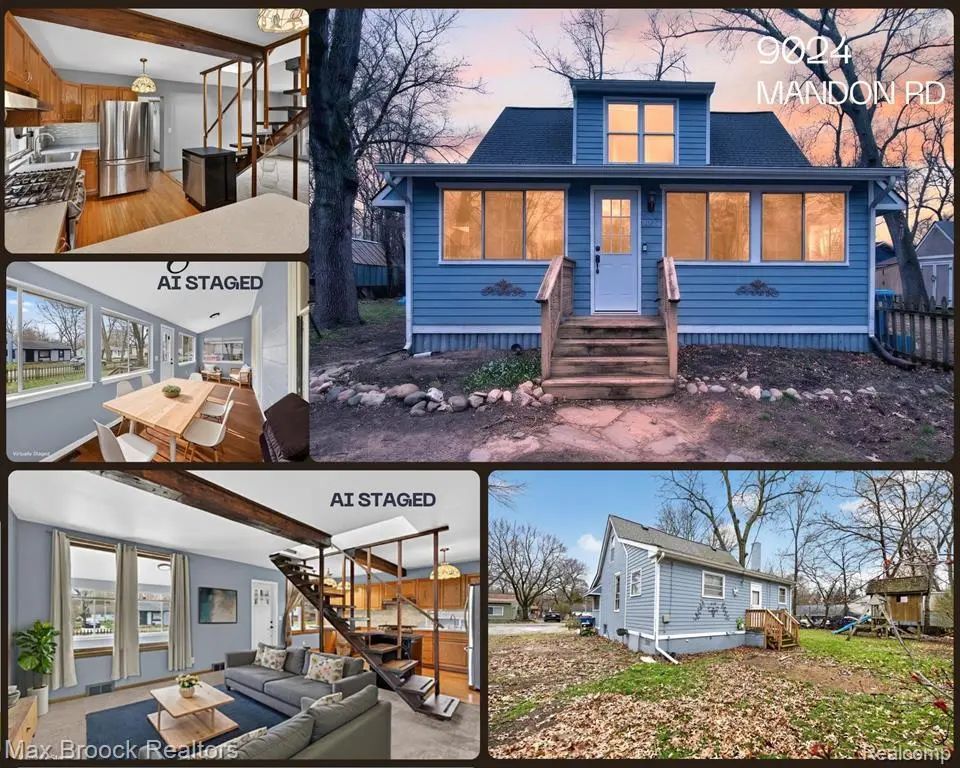
9024 Mandon Rd · White Lake, MI
Flood risk 1/10 · Minimal
- FEMA flood zone
- X (unshaded)
- Chance of flooding over 30 yrs
- 0.0%
- Est. flood insurance / yr
- $473 – $860
Fire risk 1/10 · Minimal
- Est. fire insurance / yr
- $784 – $1,456
Heat risk 2/10 · Minimal
- Hot days now (above 95°F)
- 7 days/yr
- Hot days in 30 yrs
- 14 days/yr
Wind risk 2/10 · Minimal
- Chance of severe wind over 30 yrs
- —
Air-quality risk 3/10 · Minor
- Unhealthy air days now
- 2 days/yr
- Unhealthy air days in 30 yrs
- 4 days/yr
Risk factors via First Street. Map © Google.
Why this score? — see what drove the F grade
The composite is a weighted blend of 9 inputs, each scored 0–100. Each bar is that input's sub-score; the figure is the points it added to the 100-point composite (weight × sub-score).
- Cash flow +7.7/30.0
- Schools +5.0/10.0
- 1% rule +2.6/10.0
- Rent growth +2.5/5.0
- Livability +2.5/5.0
- Condition / age +2.5/5.0
- DSCR +1.8/10.0
- ARV discount +0.3/15.0
- Appreciation +0.0/10.0
$245,000
🖨 Deal sheet 📄 Offer letter ✓ Due diligence
Listing remarks MLS
NEW WELL AND NEW SEPTIC! Welcome to worry-free White Lake living with major big-ticket improvements already taken care of! The seller will install a brand-new well prior to closing and will escrow funds for a new septic field, giving the next owner the peace of mind of having a new well and new septic system that should provide reliable service for decades to come. In addition, private well and septic systems can save homeowners thousands of dollars over time by eliminating monthly municipal water and sewer bills. Located on an oversized triple lot (120' x 100'), this move-in ready 3-bedroom bungalow offers plenty of room to spread out, store your toys, and enjoy the outdoors. Enjoy lake privileges on Mandon Lake just two blocks away, with Cedar Island Lake only five blocks away and access to the incredible recreation opportunities of White Lake Township's many lakes. Inside, you'll find a great open layout with the living room flowing into the kitchen and dining area, perfect for everyday living and entertaining. The first floor features a primary bedroom, full bath, convenient laundry area, and a bonus four-season sunroom. Upstairs bedrooms offer built-in dressers and cabinetry, providing exceptional storage. Outside, the partially fenced yard, two storage sheds (one with electricity), and abundant parking for an RV, boat, or multiple vehicles make this property as practical as it is charming. Situated on a quiet dead-end street with convenient access to M-59 and M-5 and located within the highly regarded Walled Lake School District, this home offers a rare combination of space, lake access, and major infrastructure improvements that are already accounted for.
Key facts
- Oversized triple lot
- New well
- Lake privileges
Tags
Property features AI
Exterior
- Parking: No garage
- Utilities: Private well water; Septic tank sewer
- Home design: Single family residence; One and one-half stories; Ground-level entry with steps
- Construction: Built with block, concrete and wood siding; Asphalt roof
- Exterior features: Outdoor lighting; Enclosed porch; Open porch; Shed(s); Fenced front and back yard; Paved road access; Located on Mandon Lake
Interior
- Kitchen: Dishwasher; Free‑standing gas oven; Free‑standing gas range; Free‑standing refrigerator; Microwave; Stainless steel appliances
- Bathrooms: 1 full bathroom
- Heating & cooling: Forced air heating (natural gas); Ceiling fans; Window air conditioning units
- Interior features: Entrance foyer; Smart thermostat; Crawl space basement
- Laundry & utility: Stacked washer and dryer; Laundry room; Gas water heater; Owned water softener
Neighborhood map
What this means for you Summary
Snapshot
- This is a 3-bed/1.0-bath single-family listed at $245k.
Deal economics
- At list price, monthly cash flow is $-283 ($-3k/yr) — negative.
- To cash-flow at today's rent, offer at most $195k (20.4% below list).
- To meet the 1% rule (rent ≥ 1% of price), the offer needs to be $187k (23.9% below list).
- Recommended offer: $187k (23.9% below list) — sets the bar for 1% rule.
Location & tenants
- Location reads: area grade F — affects rentability + tenant quality, not the cash-flow math above.
- Walled Lake Consolidated Schools (suburban): math 52% / reading 60% proficiency, ranked #58 of 540 in MI (top 11%) — acceptable for families but not a draw, mixed tenant base, ~2y average lease; only 20% free/reduced lunch — higher-income household profile.
- Market conditions: 145 active listings in the ZIP; 4 comparable units currently listed for rent nearby; rentals leasing fast (median 4d on market — plan ~1-2 weeks tenant-placement turnaround); solid renter incomes; 2,614 units permitted in Oakland County in 2024 (721 in 5+ unit buildings).
Forward outlook
- Local home prices are declining (-3.0%/yr); year-one equity from $2k of loan paydown is wiped out by about $7k of value loss. Plan a longer hold.
- Oakland County population projected at +10% by 2050 — modest demand growth; plan on rents tracking national, not racing it.
Negotiation context
- Only 8 days on market — expect competitive offers; lowballing is unlikely to land.
- 11 sale attempts since 3y ago with the ask held roughly flat each time — persistent listings suggest the price (not the market) is what's stuck; bring a comps-based counter.
- Current owner paid $195k; 25% above their basis — modest negotiation headroom, anchor on the comps not their cost.
Risks & watch-outs
- Watch-outs: built in 1948 — expect roof / HVAC / electrical / plumbing capex.
Questions for the listing agent
- What do current leases actually rent for vs. the listed asking? Can we see a recent rent roll and the last 12 months of T-12 income?
- Built in 1948 — when were the roof, HVAC, electrical panel, plumbing, and water heater last replaced?
- Is there a deadline driving the sale (1031 exchange, divorce, estate, relocation)? That informs how much negotiation room exists.
- The area grade is low — what's the realistic commute time and amenity access for the typical tenant pool here? Any planned neighborhood developments (good or bad) we should know about?
- What's the average days-on-market for RENTAL listings here right now (not sales)? A rising rental-DOM trend means longer vacancies and softer asking-rent achievability than the comps imply.
- What's the recent tenant-quality profile in this submarket — average credit score on applications, eviction rate, late-payment / NSF rate, and stable-employment percentage? A property-management company in the area should have these aggregated.
- How much new for-sale + rental construction is in the pipeline within 1–3 miles? Heavy new supply typically softens prices + rents 12–24 months out; constrained supply supports both.
Investment metrics
- 1% rule
- 0.76% ✗
- Cap rate
- 4.91%
- Cash-on-cash
- -4.94%
- DSCR
- 0.78
- GRM
- 10.9
CMA / ARV
- ARV (median comp)
- $211,062
- List price
- $245,000
- Delta
- 16.03%
- Verdict
- OVERPRICED
- Comps
- 20 within 1.0 mi
Show comp detail 12 sales within ~0.75 mi
| Address | Dist | Beds/Ba | Sqft | Sold | Price | $/sf | Match |
|---|---|---|---|---|---|---|---|
| 9030 Funston Blvd | 0.09mi | 2/1.0 (-1) | 897 (+2%) | 2mo | $102,000 | $114 | 86 |
| 9145 Mandon Rd | 0.14mi | 3/1.0 | 940 (+6%) | 9mo | $165,000 | $176 | 76 |
| 9063 Ashdown Ave | 0.05mi | 3/1.0 | 1,016 (+15%) | 4mo | $252,000 | $248 | 69 |
| 9303 Beechcrest St | 0.30mi | 3/1.0 | 864 (-2%) | 21mo | $181,000 | $209 | 65 |
| 1177 Clearwater Blvd | 0.46mi | 3/1.0 | 920 (+4%) | 10mo | $195,100 | $212 | 64 |
| 9809 Mandon Rd | 0.72mi | 2/1.0 (-1) | 885 (+0%) | 0mo | $195,000 | $220 | 61 |
| 9128 Hickorywood Dr | 0.56mi | 3/1.0 | 970 (+10%) | 8mo | $235,000 | $242 | 51 |
| 9439 Garforth Dr | 0.44mi | 2/1.0 (-1) | 1,000 (+13%) | 2mo | $150,000 | $150 | 50 |
| 9526 Cedar Island Rd | 0.52mi | 3/1.0 | 1,000 (+13%) | 5mo | $215,000 | $215 | 50 |
| 8797 Cooley Beach Dr | 0.58mi | 2/1.0 (-1) | 958 (+8%) | 12mo | $368,000 | $384 | 44 |
| 8799 Cooley Beach Dr | 0.58mi | 2/2.0 (-1) | 917 (+4%) | 19mo | $550,000 | $600 | 41 |
| 9110 Georgette St | 0.67mi | 2/1.0 (-1) | 804 (-9%) | 13mo | $179,900 | $224 | 38 |
Match score weights: distance 35% · size 25% · config 20% · recency 20%. Top-matched comps best support the ARV.
Projected returns pro-forma
-3.0% appreciation · 3.0% rent growth · sell at horizon
- IRR
- -24.7%
- Equity multiple
- 0.16×
- Total profit
- $-57,637
- Equity at exit
- $36,530
- IRR
- -20.2%
- Equity multiple
- -0.07×
- Total profit
- $-73,100
- Equity at exit
- $21,183
Cash invested: $68,600 (down + closing). Projections, not guarantees.
Landlord ↔ Tenant lean methodology
- Overall (STATE)
- 62 Landlord-Friendly
- State Michigan
- 62 Landlord-Friendly · EVEN
- County
- — inherits STATE
- City
- — inherits STATE
ZIP-level market 48386
- Active inventory
- 145
- Price-to-rent
- 10.9×
Monthly cashflow live
- Estimated rent
- $1,865 medium interval (Pro) →
- Mortgage (P&I)
- −$1,285
- Tax from tax record
- −$369 /mo · $4,433/yr
- Insurance
- −$102
- HOA
- −$0
- Vacancy / Maint / Mgmt
- −$392
- Net cashflow
- $-283
Break-even live
UW: 25.0% down · 7.5% · 30yr · 1.5% tax · 5.0% vac · 8.0% maint · 8.0% mgmt
Financing live
Cash to close
- Down payment
- $61,250
- Closing costs
- $7,350
- Reserves months
- —
- Total cash needed
- —
Loan-product check · same deal, 3 products live
Conventional
25% down · 7.5% · 30yr
- Down + closing
- —
- Monthly P&I
- —
- Monthly cashflow
- —
- DSCR
- —
- Eligible?
- —
Personal DTI + credit; lowest rate.
DSCR
20% down · 8.5% · 30yr
- Down + closing
- —
- Monthly P&I
- —
- Monthly cashflow
- —
- DSCR
- —
- Eligible?
- —
No personal income docs; deal must DSCR.
Hard money
10% down · 12.0% · 12mo
- Down + closing
- —
- Monthly P&I
- —
- Monthly cashflow
- —
- DSCR
- —
- Eligible?
- —
Short-term bridge; refi at stabilization.
Rent comps 4 comps
| Address | Beds | Baths | Sqft | Rent | $/sqft | DOM | Units | Dist |
|---|---|---|---|---|---|---|---|---|
| 8020 Wadi White Lake, MI | 2.0 | 2.0 | 1352 | $2,512 | $1.86 | 1d | 16 | 1.10mi |
| 211 Summit Ridge Dr Unit D White Lake Charter Township, MI | 2.0 | 1.0 | 875 | $1,200 | $1.37 | 5d | 1 | 1.36mi |
| 211 Summit Ridge Dr Unit D White Lake Charter Township, MI | 2.0 | 1.0 | 912 | $1,200 | $1.32 | 3d | 1 | 1.36mi |
| 132 Huronview Ct White Lake Charter Township, MI | 2.0 | 1.5 | 920 | $1,425 | $1.55 | 1d | 1 | 1.44mi |
Listing history 36 events
-
2026-06-18days on market $245,000 Active 8 DOM
-
2026-06-17days on market $245,000 Active 7 DOM
-
2026-06-16days on market $245,000 Active 6 DOM
-
2026-06-15days on market $245,000 Active 5 DOM
-
2026-06-13days on market $245,000 Active 3 DOM
-
2026-06-13remarks 699-char remark
-
2026-06-13pricedays on market $245,000 Active 2 DOM
-
2026-06-09days on market $239,900 Active 11 DOM
-
2026-06-08days on market $239,900 Active 10 DOM
-
2026-06-07days on market $239,900 Active 9 DOM
-
2026-06-04days on market $239,900 Active 6 DOM
-
2026-06-03days on market $239,900 Active 5 DOM
-
2026-06-02days on market $239,900 Active 4 DOM
-
2026-06-01days on market $239,900 Active 3 DOM
-
2026-05-31days on market $239,900 Active 2 DOM
-
2026-04-27$244,900 Active 803-char remark
-
2026-04-27$244,900 Active 803-char remark
-
2026-04-27historical
-
2026-04-27historical
-
2026-04-15$249,900 Active
-
2026-04-15$249,900 Active
-
2026-04-13historical
-
2023-11-22historical $1,675
-
2023-11-10$1,675
-
2023-10-04soldstatus $195,260
-
2023-08-30soldstatus $195,260 Sold
-
2023-08-30soldstatus $195,260 Closed
-
2023-07-31status Pending
-
2023-07-31status Pending
-
2023-07-28$189,900 Active
-
2023-07-28$189,900 Active
-
2023-07-23historical $189,900
-
2023-07-23historical $189,900
-
1997-12-04soldstatus $80,000
-
1992-10-22soldstatus $63,000
-
1992-06-01soldstatus $45,000
ⓘ Source: listings_history table (triggers on properties + properties_extension) + one-shot
backfill from property_details.listing_events for pre-trigger history.
Tax reassessment forecast MI · Partial reset (capped growth)
- Current annual tax
- $4,433 · $369/mo
- Projected year-2 tax
- $4,433 · $369/mo
- Expected delta
- $0/yr ($0/mo · 0.0%)
ⓘ Screening estimate from a state-policy table — verify with the county assessor before closing.
Climate risk First Street
- Flood 1/10 Low FEMA zone X (unshaded) · 0% chance over 30 yrs
- Wildfire 1/10 Low
- Heat 2/10 Low 7 d/yr ≥95°F today · 14 d/yr by 30 yrs out
- Wind 2/10 Low
- Air quality 3/10 Moderate 2 unhealthy d/yr today · 4 by 30 yrs out
Nearby sold comps map
Loading sold comps map…
Walkable amenities ~0.75 mi
Loading nearby amenities…
Taxation est. · year 1
- Rental income
- $22,384
- − Mortgage interest
- −$13,724
- − Property taxes
- −$4,433
- − Insurance
- −$1,225
- − Repairs & maintenance
- −$1,791
- − Management
- −$1,791
- − Depreciation
- −$7,127
- Taxable loss
- −$7,706
- Est. tax savings @ 24.0%
- +$1,849
- After-tax cash flow
- $-1,543/yr
For passive investors: Depreciation is non-cash, so a rental often shows a tax loss while cash-flowing — sheltering income. Rental losses are passive: they offset passive income freely, and up to $25,000/yr can offset ordinary (W-2) income if you actively participate and your MAGI is under $100k (phasing out to $0 by $150k); unused losses carry forward. On sale, claimed depreciation is recaptured at up to 25%, and gains may owe capital-gains tax (a 1031 exchange can defer both). Figures are a year-1 estimate at your 24.0% rate — not tax advice; consult a CPA.
Schools (NCES district)
- District
- Walled Lake Consolidated Schools
- NCES district ID
- 2635160
- Math proficiency
- 52% ▼ -4.00%
- Reading proficiency
- 60% ▼ -1.00%
- Median HH income
- $69,184
- Composite
- 49.57/100
- National rank
- #1987
- State rank
- #58 of 540 in MI
Livability — White Lake
No livability data for this city. (Only ~50 U.S. cities are tracked.)
Census & demographics
- County
- Oakland County · 1,009,092 people
- City population
- 17,856
- Metro
- Detroit-Warren-Dearborn, MI
- Population (ZIP)
- 17,856
- Household income
- $89,702
- Rent vs Own
- Severe rent burden
- 664.0
Population outlook (Oakland County) Hauer SSP2
- Today (2025)
- 1,335,747 people
- By 2030
- 1,375,100 · +2.9%
- By 2040
- 1,435,385 · +7.5%
- By 2050
- 1,469,250 · +10.0%
- By 2075
- 1,531,946 · +14.7%
- By 2100
- 1,450,485 · +8.6%
Race, ethnicity, and origin ACS 2023
- Neighborhood character
- Predominantly White (90%)
- Race & ethnicity
- White 90% Two or more races 6% Hispanic / Latino 4% Black 1%
- Common ancestry
- Romanian 12% Lithuanian 6% Slovak 4%
- Foreign-born
- 5% · Canada
- Languages at home
- 95% English-only · Russian/Polish/Slavic 2% Spanish 1% Arabic 1%
Political lean MEDSL · Oakland
- 2024 margin
- D (+10.6) · D 54.4% · R 43.8% · Other 1.9%
- 2008→2024 swing
- -3.9pp toward R · 2008: 14.5pp · 2024: 10.6pp
- All cycles
- 2024: D+10.6 2020: D+14.1 2016: D+8.1 2012: D+8.1 2008: D+14.5
Not yet ingested
- Civics
- —
Market trends
- HPI YoY
- ▼ -269.78%
- Current HPI
- 207.917
- Rent YoY
- —
- Metro
- Detroit-Warren-Dearborn, MI
- State GDP YoY
- ▲ 1.37%
- F500 in state
- 28
Industry mix (Fortune 500 HQ in MI)
| Industry | F500 HQs | Revenue |
|---|---|---|
| Automotive Parts | 3 | $48B |
|
||
| Automotive | 2 | $372B |
|
||
| Chemicals | 1 | $45B |
|
||
| Automotive Retail | 1 | $29B |
|
||
| Healthcare / Medical Devices | 1 | $23B |
|
||
| Automotive Technology | 1 | $20B |
|
||
Price history
+444.4% since first listed29 events — show timeline
- 2026-06-10 Listed $245,000 REALCOMP
- 2026-06-10 Listing Removed — MiRealSource-MiMLS
- 2026-06-10 Listing Removed — REALCOMP
- 2026-06-10 Listed $245,000 MiRealSource-MiMLS
- 2026-05-29 Listing Removed — MiRealSource-MiMLS
- 2026-05-29 Listing Removed — REALCOMP
- 2026-05-29 Listed $239,900 MiRealSource-MiMLS
- 2026-05-29 Listed $239,900 REALCOMP
- 2026-04-27 Listed $244,900 REALCOMP
- 2026-04-27 Listing Removed — REALCOMP
- 2026-04-27 Listing Removed — MiRealSource-MiMLS
- 2026-04-27 Listed $244,900 MiRealSource-MiMLS
- 2026-04-15 Listed $249,900 MiRealSource-MiMLS
- 2026-04-15 Listed $249,900 REALCOMP
- 2026-04-13 Coming Soon — MiRealSource-MiMLS
- 2023-11-22 Rental Removed $1,675 REALSOURCE
- 2023-11-10 Listed for Rent $1,675 REALSOURCE
- 2023-10-04 Sold (Public Records) $195,260 Public Records
- 2023-08-30 Sold (MLS) $195,260 MiRealSource-MiMLS
- 2023-08-30 Sold (MLS) $195,260 REALCOMP
- 2023-07-31 Pending — MiRealSource-MiMLS
- 2023-07-31 Pending — REALCOMP
- 2023-07-28 Listed $189,900 MiRealSource-MiMLS
- 2023-07-28 Listed $189,900 REALCOMP
- 2023-07-23 Coming Soon $189,900 MiRealSource-MiMLS
- 2023-07-23 Coming Soon $189,900 REALCOMP
- 1997-12-04 Sold (Public Records) $80,000 Public Records
- 1992-10-22 Sold (Public Records) $63,000 Public Records
- 1992-06-01 Sold (Public Records) $45,000 Public Records
Property tax history
+10.6%/yrLatest (2025): $4,433 · +4.5% YoY. Source: county tax records.
Cash-flow waterfall
monthlySold comps — $/sqft
last 12 mo · ≤1 miLoading sold comps…