 🏗️ New Construction
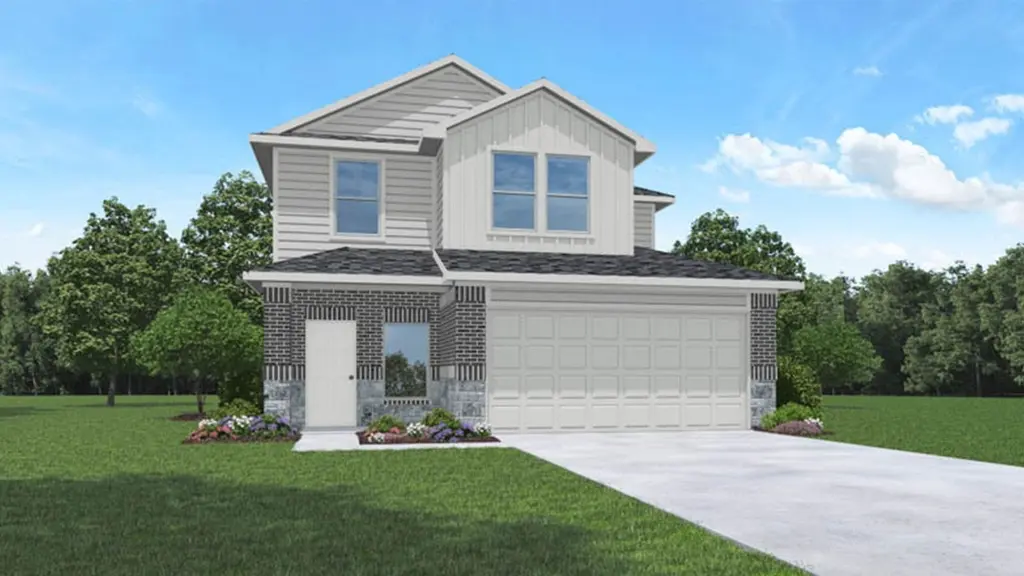
Hanna Plan · Houston, TX
Flood risk No data
- FEMA flood zone
- —
- Chance of flooding over 30 yrs
- —
- Est. flood insurance / yr
- —
Fire risk No data
- Est. fire insurance / yr
- —
Heat risk No data
- Hot days now (above threshold)
- —
- Hot days in 30 yrs
- —
Wind risk No data
- Chance of severe wind over 30 yrs
- —
Air-quality risk No data
- Unhealthy air days now
- —
- Unhealthy air days in 30 yrs
- —
Risk factors via First Street. Map © Google.
Why this score? — see what drove the D+ grade
The composite is a weighted blend of 9 inputs, each scored 0–100. Each bar is that input's sub-score; the figure is the points it added to the 100-point composite (weight × sub-score).
- Cash flow +15.7/30.0
- ARV discount +7.5/15.0
- DSCR +4.8/10.0
- 1% rule +4.3/10.0
- Condition / age +4.0/5.0
- Livability +3.7/5.0
- Schools +3.5/10.0
- Rent growth +2.9/5.0
- Appreciation +0.0/10.0
$272,990
🖨 Deal sheet (PDF) 📄 Offer letter ✓ Due diligence
Listing remarks MLS
You have arrived at the Hanna Plan, this spacious two-story home spans 2,042 square feet and holds four bedrooms, two and a half bathrooms, and a loft, making it perfect for a family-style floor plan! Upon arrival, if guests need to freshen up, there is a convenient half bathroom just a few steps away in the foyer. A coat closet is also located in the foyer, perfectly positioned to welcome guests. Near the end of the foyer is the carpeted stairway, leading up to the second story of the home. The heart of this home revolves around the family room, dining room, and kitchen, which lie at the end of the foyer. With an open floor plan perfect for a busy life or entertainment, this home is ideal for handling a busy life. In the kitchen, you will find stainless steel appliances, abundant cabinet storage, an L-shaped pantry, and an island for additional countertop space. The utility room, which sits behind the kitchen, has vinyl floors and provides space for a washer, dryer, and some storage. When moving to the primary bedroom, you will notice that the primary bedroom is the only bedroom on the first floor of the home. The bedroom has carpet flooring and two bright windows opening to the back of the property, allowing for sunlight to adorn the room with its rays. The primary bathroom is practical with dual sinks, vinyl floors, a linen nook, a standing shower, and a separate toilet room. The bathroom opens to a sizeable walk-in closet, finished with carpet flooring and providing sp
Key facts
- Open floor plan
- Carpeted stairway
- Coat closet
Tags
Neighborhood map
What this means for you Summary
Snapshot
- This is a 4-bed/2.5-bath single-family listed at $273k. Condition is rated good.
Deal economics
- At list price, monthly cash flow is $116 ($1k/yr) — positive.
- The deal already cash-flows at list — no discount required.
- To meet the 1% rule (rent ≥ 1% of price), the offer needs to be $247k (9.6% below list).
- Recommended offer: $247k (9.6% below list) — sets the bar for 1% rule.
- Cap rate 6.8% vs local median 3.2% in Houston — top-decile yield for the area; either an underpriced asset or a hidden risk that comps aren't pricing in. Stress-test before assuming the spread holds.
Location & tenants
- Location reads 74/100 on livability (#184 in TX, #4,771 nationally) — a middle-class / working-renter tenant base. Strengths: amenities A+, cost of living A+, housing A+; Watch: crime F.
- Crosby ISD (rural): math 39% / reading 40% proficiency, ranked #369 of 826 in TX (top 45%) — families likely to look elsewhere, expect single-tenant / working-renter base with shorter leases.
- Zoned schools: Crosby Middle (math 36% / reading 37%, grade F, #786 of 1,662 statewide, top 48%, 1,549 students, 60% FRL); Crosby H S (math 44% / reading 45%, grade F, #652 of 1,632 statewide, top 43%, 1,937 students, 54% FRL).
- Market conditions: Rents rising (+1.5%/yr); 1189 active listings in the ZIP; 2 comparable units currently listed for rent nearby; solid renter incomes; 29,883 units permitted in Harris County in 2024 (8,621 in 5+ unit buildings).
- This rent runs 32% of the median local income ($92k/yr) — at the standard rent-burdened threshold; future hikes will face affordability resistance.
Forward outlook
- Local home prices are declining (-3.0%/yr); year-one equity from $2k of loan paydown is wiped out by about $8k of value loss. Plan a longer hold.
- Harris County population projected at +47% by 2050 — long-run rental-demand tailwind backs the buy-and-hold thesis.
Negotiation context
- It's been on market 78 days — a 6% lower offer ($257k) is reasonable based on typical stale-listing flexibility.
Questions for the listing agent
- It's been on market 78 days. Have you received any prior offers? Is the seller open to a 10% concession, seller financing, or rate buy-down credit?
- Why hasn't it sold? Are there any deal-killer items the seller is aware of (foundation, flood, title, zoning, code violations)?
- Is there a deadline driving the sale (1031 exchange, divorce, estate, relocation)? That informs how much negotiation room exists.
- Schools are D-rated, which usually means shorter tenancies and higher turnover. Who's the typical renter profile here, and what's been the actual vacancy rate?
- Crime grade is F in this area — have there been break-ins, vandalism, or insurance claims at this property in the last 3 years? What carrier currently insures it and at what premium?
- The area grade is low — what's the realistic commute time and amenity access for the typical tenant pool here? Any planned neighborhood developments (good or bad) we should know about?
- What's the average days-on-market for RENTAL listings here right now (not sales)? A rising rental-DOM trend means longer vacancies and softer asking-rent achievability than the comps imply.
- What's the recent tenant-quality profile in this submarket — average credit score on applications, eviction rate, late-payment / NSF rate, and stable-employment percentage? A property-management company in the area should have these aggregated.
- How much new for-sale + rental construction is in the pipeline within 1–3 miles? Heavy new supply typically softens prices + rents 12–24 months out; constrained supply supports both.
Investment metrics
- 1% rule
- 0.93% ✗
- Cap rate
- 6.82%
- Cash-on-cash
- 1.87%
- DSCR
- 1.08
- GRM
- 9.0
CMA / ARV
- ARV (median comp)
- $265,462
- List price
- $272,990
- Delta
- 2.84%
- Verdict
- FAIR
- Comps
- 20 within 1.0 mi
Show comp detail 12 sales within ~0.75 mi
| Address | Dist | Beds/Ba | Sqft | Sold | Price | $/sf | Match |
|---|---|---|---|---|---|---|---|
| 1735 Green Warbler Ln | 0.13mi | 4/2.5 | 2,042 (0%) | 1mo | $273,190 | $134 | 94 |
| 1719 Green Warbler Ln | 0.11mi | 4/2.5 | 1,968 (-4%) | 0mo | $269,190 | $137 | 88 |
| 1730 Green Warbler Ln | 0.11mi | 4/2.5 | 2,107 (+3%) | 2mo | $274,990 | $131 | 88 |
| 1703 Indian Shores Rd | 0.13mi | 3/3.0 (-1) | 1,943 (-5%) | 0mo | $367,500 | $189 | 79 |
| 1406 Indian Shores Rd | 0.27mi | 3/2.0 (-1) | 2,005 (-2%) | 3mo | $200,000 | $100 | 75 |
| 20038 White Dove Trl | 0.47mi | 4/2.0 | 1,979 (-3%) | 0mo | $218,990 | $111 | 70 |
| 20027 White Dove Trl | 0.50mi | 4/2.5 | 1,979 (-3%) | 2mo | $283,990 | $144 | 70 |
| 20018 White Dove Trl | 0.50mi | 4/2.5 | 1,979 (-3%) | 2mo | $279,990 | $141 | 70 |
| 2002 Indian Shores Rd | 0.39mi | 3/2.0 (-1) | 1,975 (-3%) | 1mo | $350,000 | $177 | 68 |
| 2159 Silver Moon Trl | 0.58mi | 3/2.5 (-1) | 2,074 (+2%) | 3mo | $510,000 | $246 | 62 |
| 1306 W Stroker Rd | 0.34mi | 3/2.0 (-1) | 2,304 (+13%) | 2mo | $310,000 | $135 | 54 |
| 1823 White Feather Trl | 0.72mi | 3/2.5 (-1) | 2,151 (+5%) | 2mo | $239,000 | $111 | 52 |
Match score weights: distance 35% · size 25% · config 20% · recency 20%. Top-matched comps best support the ARV.
Projected returns pro-forma
-3.0% appreciation · 1.48% rent growth · sell at horizon
- IRR
- -15.0%
- Equity multiple
- 0.47×
- Total profit
- $-39,330
- Equity at exit
- $39,581
- IRR
- -9.2%
- Equity multiple
- 0.47×
- Total profit
- $-39,411
- Equity at exit
- $22,952
Cash invested: $74,329 (down + closing). Projections, not guarantees.
Landlord ↔ Tenant lean methodology
- Overall (STATE)
- 87 Strongly Landlord-Friendly
- State Texas
- 87 Strongly Landlord-Friendly · R+5
- County
- — inherits STATE
- City
- — inherits STATE
ZIP-level market 77532
- Home prices YoY
- -28.6%
- Rents YoY
- 1.5%
- Active inventory
- 1189
- Price-to-rent
- 9.2×
Monthly cashflow live
- Estimated rent
- $2,469 medium interval (Pro) →
- Mortgage (P&I)
- −$1,392
- Tax est. 1.5%
- −$332 /mo · $3,982/yr
- Insurance
- −$111
- HOA
- −$0
- Vacancy / Maint / Mgmt
- −$518
- Net cashflow
- $116
Break-even live
Sensitivity live
| Price | -10% $299 | -5% $207 | +0% $116 | +5% $24 | +10% $-68 |
|---|---|---|---|---|---|
| Rent | -10% $-79 | -5% $18 | +0% $116 | +5% $213 | +10% $311 |
| Rate | -1.0pp $249 | -0.5pp $183 | base $116 | +0.5pp $47 | +1.0pp $-23 |
UW: 25.0% down · 7.5% · 30yr · 1.5% tax · 5.0% vac · 8.0% maint · 8.0% mgmt
Financing live
Cash to close
- Down payment
- $66,366
- Closing costs
- $7,964
- Reserves months
- —
- Total cash needed
- —
Loan-product check · same deal, 3 products live
Conventional
25% down · 7.5% · 30yr
- Down + closing
- —
- Monthly P&I
- —
- Monthly cashflow
- —
- DSCR
- —
- Eligible?
- —
Personal DTI + credit; lowest rate.
DSCR
20% down · 8.5% · 30yr
- Down + closing
- —
- Monthly P&I
- —
- Monthly cashflow
- —
- DSCR
- —
- Eligible?
- —
No personal income docs; deal must DSCR.
Hard money
10% down · 12.0% · 12mo
- Down + closing
- —
- Monthly P&I
- —
- Monthly cashflow
- —
- DSCR
- —
- Eligible?
- —
Short-term bridge; refi at stabilization.
Rent comps 2 comps
| Address | Beds | Baths | Sqft | Rent | $/sqft | DOM | Units | Dist |
|---|---|---|---|---|---|---|---|---|
| 20119 Iron Winds St Crosby, TX | 3.0 | 2.0 | 1418 | $1,875 | $1.32 | 14d | 1 | 0.20mi |
| 1823 Black Bear Dr Crosby, TX | 3.0 | 2.5 | 2564 | $2,395 | $0.93 | 45d | 1 | 1.11mi |
Listing history 14 events
-
2026-06-21days on market $272,990 Active 78 DOM
-
2026-06-18days on market $272,990 Active 75 DOM
-
2026-06-17days on market $272,990 Active 74 DOM
-
2026-06-16days on market $272,990 Active 73 DOM
-
2026-06-15days on market $272,990 Active 72 DOM
-
2026-06-13days on market $272,990 Active 70 DOM
-
2026-06-09days on market $272,990 Active 66 DOM
-
2026-06-08days on market $272,990 Active 65 DOM
-
2026-06-07days on market $272,990 Active 64 DOM
-
2026-06-04days on market $272,990 Active 61 DOM
-
2026-06-02days on market $272,990 Active 59 DOM
-
2026-06-01days on market $272,990 Active 58 DOM
-
2026-05-31days on market $272,990 Active 57 DOM
-
2026-04-04$272,990 Active 1498-char remark
Show marketing remark (1498 chars)
You have arrived at the Hanna Plan, this spacious two-story home spans 2,042 square feet and holds four bedrooms, two and a half bathrooms, and a loft, making it perfect for a family-style floor plan! Upon arrival, if guests need to freshen up, there is a convenient half bathroom just a few steps away in the foyer. A coat closet is also located in the foyer, perfectly positioned to welcome guests. Near the end of the foyer is the carpeted stairway, leading up to the second story of the home. The heart of this home revolves around the family room, dining room, and kitchen, which lie at the end of the foyer. With an open floor plan perfect for a busy life or entertainment, this home is ideal for handling a busy life. In the kitchen, you will find stainless steel appliances, abundant cabinet storage, an L-shaped pantry, and an island for additional countertop space. The utility room, which sits behind the kitchen, has vinyl floors and provides space for a washer, dryer, and some storage. When moving to the primary bedroom, you will notice that the primary bedroom is the only bedroom on the first floor of the home. The bedroom has carpet flooring and two bright windows opening to the back of the property, allowing for sunlight to adorn the room with its rays. The primary bathroom is practical with dual sinks, vinyl floors, a linen nook, a standing shower, and a separate toilet room. The bathroom opens to a sizeable walk-in closet, finished with carpet flooring and providing sp
ⓘ Source: listings_history table (triggers on properties + properties_extension) + one-shot
backfill from property_details.listing_events for pre-trigger history.
Nearby sold comps map
Loading sold comps map…
Walkable amenities ~0.75 mi
Loading nearby amenities…
Taxation est. · year 1
- Rental income
- $29,624
- − Mortgage interest
- −$14,870
- − Property taxes
- −$3,982
- − Insurance
- −$1,327
- − Repairs & maintenance
- −$2,370
- − Management
- −$2,370
- − Depreciation
- −$7,723
- Taxable loss
- −$3,018
- Est. tax savings @ 24.0%
- +$724
- After-tax cash flow
- $2,113/yr
For passive investors: Depreciation is non-cash, so a rental often shows a tax loss while cash-flowing — sheltering income. Rental losses are passive: they offset passive income freely, and up to $25,000/yr can offset ordinary (W-2) income if you actively participate and your MAGI is under $100k (phasing out to $0 by $150k); unused losses carry forward. On sale, claimed depreciation is recaptured at up to 25%, and gains may owe capital-gains tax (a 1031 exchange can defer both). Figures are a year-1 estimate at your 24.0% rate — not tax advice; consult a CPA.
Condition & rehab AI · 6 photos
This Hanna Plan home is in good condition with a spacious floor plan and modern features. It is move-in ready and has the potential for further value increases through minor updates and improvements.
Value-add opportunities
- Both Painting the exterior and interior walls — Fresh paint can enhance curb appeal and interior aesthetics.
- Both Landscaping improvements — Enhanced landscaping can improve curb appeal and attract potential buyers/tenants.
- Both Adding smart home features — Smart home features can increase the home's value and appeal to tech-savvy buyers/tenants.
- Both Upgrading the kitchen appliances — Modern appliances can make the kitchen more functional and appealing to potential buyers/tenants.
Renovation cost estimate screening
Value-add ROI direction
- Both Painting the exterior and interior walls — Fresh paint can enhance curb appeal and interior aesthetics. ↑
- Both Landscaping improvements — Enhanced landscaping can improve curb appeal and attract potential buyers/tenants. ↑
- Both Adding smart home features — Smart home features can increase the home's value and appeal to tech-savvy buyers/tenants. ↑
- Both Upgrading the kitchen appliances — Modern appliances can make the kitchen more functional and appealing to potential buyers/tenants. ↑
ⓘ Cost ranges are severity-bucket heuristics (US national rule-of-thumb). Get contractor quotes + a written scope before underwriting a rehab budget.
Schools (NCES district)
- District
- Crosby ISD
- NCES district ID
- 4815750
- Math proficiency
- 39% ▼ -13.00%
- Reading proficiency
- 40% ▼ -5.00%
- Median HH income
- $61,079
- Composite
- 35.14/100
- National rank
- #5012
- State rank
- #369 of 826 in TX
Livability — Houston
- Score
- 74/100
- State rank
- #184
- US rank
- #4771
Category grades
Schools grade is shown separately in the Schools card above.
Census & demographics
- County
- Harris County · 4,702,590 people
- City population
- 3,226,434
- Metro
- Houston-The Woodlands-Sugar Land, TX
- Population (ZIP)
- 33,780
- Household income
- $92,201
- Rent vs Own
- Severe rent burden
- 382.0
Population outlook (Harris County) Hauer SSP2
- Today (2025)
- 5,571,493 people
- By 2030
- 6,089,821 · +9.3%
- By 2040
- 7,142,806 · +28.2%
- By 2050
- 8,185,864 · +46.9%
- By 2075
- 10,574,329 · +89.8%
- By 2100
- 12,109,958 · +117.4%
Race, ethnicity, and origin ACS 2023
- Neighborhood character
- Diverse neighborhood (Simpson 0.60)
- Race & ethnicity
- White 54% Hispanic / Latino 31% Two or more races 16% Black 9%
- Hispanic origin (detail)
- Mexican 24%
- Common ancestry
- Lithuanian 4% Romanian 3% Italian 2%
- Foreign-born
- 10% · Canada
- Languages at home
- 78% English-only · Spanish 21%
Political lean MEDSL · Harris
- 2024 margin
- Lean D (+5.5) · D 52.0% · R 46.4% · Other 1.6%
- 2008→2024 swing
- +3.9pp toward D · 2008: 1.6pp · 2024: 5.5pp
- All cycles
- 2024: D+5.5 2020: D+13.3 2016: D+12.4 2012: D+0.1 2008: D+1.6
Not yet ingested
- Civics
- —
Market trends
- HPI YoY
- ▼ -105.63%
- Current HPI
- 264.0126
- Rent YoY
- ▲ 1.48%
- Metro
- Houston-The Woodlands-Sugar Land, TX
- State GDP YoY
- ▲ 3.95%
- F500 in state
- 110
Industry mix (Fortune 500 HQ in TX)
| Industry | F500 HQs | Revenue |
|---|---|---|
| Energy | 16 | $1,198B |
|
||
| Technology | 5 | $198B |
|
||
| Engineering / Construction | 4 | $72B |
|
||
| Energy Services | 3 | $60B |
|
||
| Utilities | 3 | $41B |
|
||
| Healthcare | 2 | $330B |
|
||
Price history
1 event — show timeline
- 2026-04-04 Listed $272,990 Zillow
Cash-flow waterfall
monthlySold comps — $/sqft
last 12 mo · ≤1 miLoading sold comps…