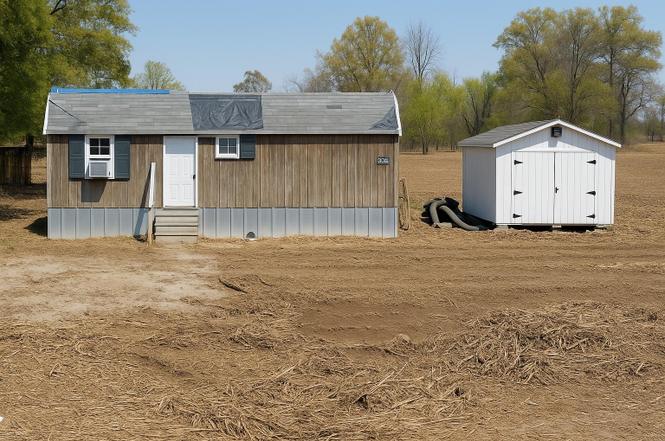
614 E Church St · Kenton, TN
Flood risk 5/10 · Moderate
- FEMA flood zone
- A
- Chance of flooding over 30 yrs
- 0.56%
- Est. flood insurance / yr
- $1,009 – $1,996
Fire risk 1/10 · Minimal
- Est. fire insurance / yr
- $949 – $1,763
Heat risk 6/10 · Moderate
- Hot days now (above 109°F)
- 7 days/yr
- Hot days in 30 yrs
- 21 days/yr
Wind risk 4/10 · Minor
- Chance of severe wind over 30 yrs
- 8.0%
Air-quality risk 1/10 · Minimal
- Unhealthy air days now
- 0 days/yr
- Unhealthy air days in 30 yrs
- 0 days/yr
Risk factors via First Street. Map © Google.
Why this score? — see what drove the D+ grade
The composite is a weighted blend of 9 inputs, each scored 0–100. Each bar is that input's sub-score; the figure is the points it added to the 100-point composite (weight × sub-score).
- Cash flow +15.0/30.0
- ARV discount +7.5/15.0
- Appreciation +5.3/10.0
- 1% rule +5.0/10.0
- DSCR +5.0/10.0
- Schools +3.2/10.0
- Livability +2.9/5.0
- Rent growth +2.5/5.0
- Condition / age +2.5/5.0
$15,000
🖨 Deal sheet 📄 Offer letter ✓ Due diligence
Listing remarks
Great investment opportunity in the heart of Kenton, TN! This property is being sold as-is and is perfect for buyers looking to renovate or invest. Conveniently located near local amenities with plenty of potential for the right vision. Cash or conventional financing only. Don’t miss this chance to make it your own! Purchaser will be responsible for conducting their own survey for correct dimensions of the property. Dimension of the property is calculated to 0.33 according to the county's tax assessor records.
Key facts
- Heart of kenton
- Local amenities
- Plenty of potential
Tags
Neighborhood map
What this means for you Summary
Snapshot
- This is a 1-bed/1.0-bath single-family listed at $15k.
Deal economics
- At list price, monthly cash flow is $416 ($5k/yr) — positive.
- The deal already cash-flows at list — no discount required.
- Meets the 1% rule at list price ($810 rent vs $15k).
- Recommended offer: $13k (12.0% below list) — sets the bar for market timing.
Location & tenants
- Location reads 58/100 on livability (#309 in TN) — a working-class tenant base; expect higher turnover. Strengths: cost of living A+, housing A+, crime B; Watch: health & safety C-, employment D, amenities F.
- Obion County (rural): math 40% / reading 37% proficiency, ranked #17 of 139 in TN (top 12%) — families likely to look elsewhere, expect single-tenant / working-renter base with shorter leases.
- Zoned schools: Ridgemont Elementary (math 35% / reading 30%, grade F, #365 of 952 statewide, top 39%, 379 students, 0% FRL); Obion County Central High School (math 22% / reading 32%, grade F, #104 of 332 statewide, top 33%, 745 students, 0% FRL) — zoned schools average 0% FRL vs 50% district-wide (50 pts lower); this property's tenant base skews higher-income than the district average.
- Market conditions: 15 active listings in the ZIP; 21 units permitted in Obion County in 2024 (0 in 5+ unit buildings).
Forward outlook
- In year one you build about $193 of equity ($104 loan paydown + $89 appreciation (0.6% local appreciation)).
- Obion County population projected at -22% by 2050 — secular population decline; favor cash flow + early exit over multi-decade hold.
- At projected returns (0.6% appreciation + 3.0% rent growth), your $4k cash investment doubles in ~1 year — after that, you're playing with house money.
Negotiation context
- It's been on market 320 days — a 12% lower offer ($13k) is reasonable based on typical stale-listing flexibility.
Risks & watch-outs
- Watch-outs: flood insurance adds $125/mo.
- Climate carrying-cost: in FEMA flood zone A (mandatory federal flood insurance); extreme-heat days projected 7→21/yr by 2055 (HVAC capex compounding) — expect insurance premiums to compound above CPI over the hold.
Questions for the listing agent
- It's been on market 320 days. Have you received any prior offers? Is the seller open to a 12% concession, seller financing, or rate buy-down credit?
- What's the actual annual flood-insurance premium (NFIP or private), and is the property in a SFHA with mandatory coverage?
- Why hasn't it sold? Are there any deal-killer items the seller is aware of (foundation, flood, title, zoning, code violations)?
- Is there a deadline driving the sale (1031 exchange, divorce, estate, relocation)? That informs how much negotiation room exists.
- Schools are F-rated, which usually means shorter tenancies and higher turnover. Who's the typical renter profile here, and what's been the actual vacancy rate?
- The area grade is low — what's the realistic commute time and amenity access for the typical tenant pool here? Any planned neighborhood developments (good or bad) we should know about?
- What's the average days-on-market for RENTAL listings here right now (not sales)? A rising rental-DOM trend means longer vacancies and softer asking-rent achievability than the comps imply.
- What's the recent tenant-quality profile in this submarket — average credit score on applications, eviction rate, late-payment / NSF rate, and stable-employment percentage? A property-management company in the area should have these aggregated.
- How much new for-sale + rental construction is in the pipeline within 1–3 miles? Heavy new supply typically softens prices + rents 12–24 months out; constrained supply supports both.
Investment metrics
- 1% rule
- 5.40% ✓
- Cap rate
- 49.58%
- Cash-on-cash
- 154.58%
- DSCR
- 7.88
- GRM
- 1.5
CMA / ARV
No comps found within radius.
Projected returns pro-forma
0.6% appreciation · 3.0% rent growth · sell at horizon
- IRR
- —
- Equity multiple
- 7.32×
- Total profit
- $26,558
- Equity at exit
- $4,808
- IRR
- —
- Equity multiple
- 15.30×
- Total profit
- $60,041
- Equity at exit
- $6,155
Cash invested: $4,200 (down + closing). Projections, not guarantees.
Landlord ↔ Tenant lean methodology
- Overall (STATE)
- 87 Strongly Landlord-Friendly
- State Tennessee
- 87 Strongly Landlord-Friendly · R+13
- County
- — inherits STATE
- City
- — inherits STATE
ZIP-level market 38233
- Home prices YoY
- 0.3%
- Active inventory
- 15
- Price-to-rent
- 1.5×
Monthly cashflow live
- Estimated rent
- $810 medium interval (Pro) →
- Mortgage (P&I)
- −$79
- Tax from tax record
- −$14 /mo · $170/yr
- Insurance
- −$6
- Flood insurance flood zone
- −$125 /mo · $1,502/yr
- HOA
- −$0
- Vacancy / Maint / Mgmt
- −$170
- Net cashflow
- $416
Break-even live
UW: 25.0% down · 7.5% · 30yr · 1.5% tax · 5.0% vac · 8.0% maint · 8.0% mgmt
Financing live
Cash to close
- Down payment
- $3,750
- Closing costs
- $450
- Reserves months
- —
- Total cash needed
- —
Loan-product check · same deal, 3 products live
Conventional
25% down · 7.5% · 30yr
- Down + closing
- —
- Monthly P&I
- —
- Monthly cashflow
- —
- DSCR
- —
- Eligible?
- —
Personal DTI + credit; lowest rate.
DSCR
20% down · 8.5% · 30yr
- Down + closing
- —
- Monthly P&I
- —
- Monthly cashflow
- —
- DSCR
- —
- Eligible?
- —
No personal income docs; deal must DSCR.
Hard money
10% down · 12.0% · 12mo
- Down + closing
- —
- Monthly P&I
- —
- Monthly cashflow
- —
- DSCR
- —
- Eligible?
- —
Short-term bridge; refi at stabilization.
Listing history 3 events
-
2026-03-01status Pending
-
2025-12-14price $15,000
-
2025-04-15$20,000 Active
ⓘ Source: listings_history table (triggers on properties + properties_extension) + one-shot
backfill from property_details.listing_events for pre-trigger history.
Tax reassessment forecast TN · Resets to sale price
- Current annual tax
- $170 · $14/mo
- Projected year-2 tax
- $170 · $14/mo
- Expected delta
- $0/yr ($0/mo · 0.0%)
ⓘ Screening estimate from a state-policy table — verify with the county assessor before closing.
Climate risk First Street
- Flood 5/10 Major FEMA zone A · 56% chance over 30 yrs
- Wildfire 1/10 Low
- Heat 6/10 Major 7 d/yr ≥109°F today · 21 d/yr by 30 yrs out
- Wind 4/10 Moderate 8% chance of damaging wind over 30 yrs
- Air quality 1/10 Low 0 unhealthy d/yr today · 0 by 30 yrs out
Nearby sold comps map
Loading sold comps map…
Walkable amenities ~0.75 mi
Loading nearby amenities…
Taxation est. · year 1
- Rental income
- $9,724
- − Mortgage interest
- −$840
- − Property taxes
- −$170
- − Insurance
- −$1,577
- − Repairs & maintenance
- −$778
- − Management
- −$778
- − Depreciation
- −$436
- Taxable income
- $5,144
- Est. tax owed @ 24.0%
- −$1,234
- After-tax cash flow
- $3,756/yr
For passive investors: Depreciation is non-cash, so a rental often shows a tax loss while cash-flowing — sheltering income. Rental losses are passive: they offset passive income freely, and up to $25,000/yr can offset ordinary (W-2) income if you actively participate and your MAGI is under $100k (phasing out to $0 by $150k); unused losses carry forward. On sale, claimed depreciation is recaptured at up to 25%, and gains may owe capital-gains tax (a 1031 exchange can defer both). Figures are a year-1 estimate at your 24.0% rate — not tax advice; consult a CPA.
Schools (NCES district)
- District
- Obion County
- NCES district ID
- 4703270
- Math proficiency
- 40% ▲ 2.00%
- Reading proficiency
- 37% ▼ -2.00%
- Median HH income
- $41,678
- Composite
- 32.48/100
- National rank
- #5710
- State rank
- #17 of 139 in TN
Livability — Kenton
- Score
- 58/100
- State rank
- #309
- US rank
- #21028
Category grades
Schools grade is shown separately in the Schools card above.
Census & demographics
- Census place
- Kenton, TN
- Population (ZIP)
- 2,795
Population outlook (Obion County) Hauer SSP2
- Today (2025)
- 28,434 people
- By 2030
- 27,100 · -4.7%
- By 2040
- 24,381 · -14.3%
- By 2050
- 22,043 · -22.5%
- By 2075
- 18,236 · -35.9%
- By 2100
- 16,435 · -42.2%
Race, ethnicity, and origin ACS 2023
- Neighborhood character
- Predominantly White (85%)
- Race & ethnicity
- White 85% Two or more races 9% Black 5%
- Common ancestry
- Slovak 2% Italian 1% Portuguese 1%
- Foreign-born
- 0%
- Languages at home
- 98% English-only · German/W. Germanic 1% Spanish 1%
Political lean MEDSL · Obion
- 2024 margin
- Solid R (+64.9) · D 17.2% · R 82.1%
- 2008→2024 swing
- -30.8pp toward R · 2008: -34.1pp · 2024: -64.9pp
- All cycles
- 2024: R+64.9 2020: R+60.6 2016: R+58.1 2012: R+44.7 2008: R+34.1
Not yet ingested
- Civics
- —
Market trends
- HPI YoY
- ▲ 0.60%
- Current HPI
- 211.069
- Rent YoY
- —
- Metro
- —
- State GDP YoY
- ▲ 2.78%
- F500 in state
- 22
Industry mix (Fortune 500 HQ in TN)
| Industry | F500 HQs | Revenue |
|---|---|---|
| Healthcare | 3 | $91B |
|
||
| Retail | 3 | $72B |
|
||
| Transportation / Logistics | 1 | $88B |
|
||
| Paper / Packaging | 1 | $19B |
|
||
| Insurance | 1 | $13B |
|
||
| Energy | 1 | $12B |
|
||
Price history
-25.0% since first listed3 events — show timeline
- 2026-03-01 Pending — REALTRACS as Distributed by MLS Grid
- 2025-12-14 Price Changed $15,000 REALTRACS as Distributed by MLS Grid
- 2025-04-15 Listed $20,000 REALTRACS as Distributed by MLS Grid
Property tax history
-2.7%/yrLatest (2025): $170 · +3.1% YoY. Source: county tax records.
Cash-flow waterfall
monthlySold comps — $/sqft
last 12 mo · ≤1 miLoading sold comps…