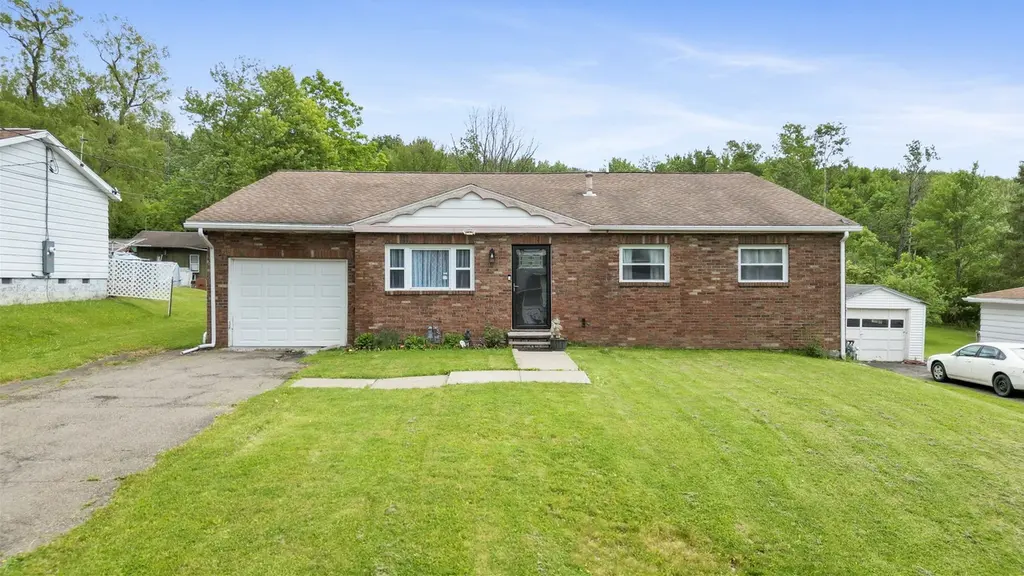
1024 Reynolds Rd · Johnson City, NY
Flood risk 4/10 · Minor
- FEMA flood zone
- X
- Chance of flooding over 30 yrs
- 0.24%
- Est. flood insurance / yr
- $507 – $1,088
Fire risk 2/10 · Minimal
- Est. fire insurance / yr
- $691 – $1,283
Heat risk 2/10 · Minimal
- Hot days now (above 94°F)
- 7 days/yr
- Hot days in 30 yrs
- 16 days/yr
Wind risk 2/10 · Minimal
- Chance of severe wind over 30 yrs
- 2.0%
Air-quality risk 2/10 · Minimal
- Unhealthy air days now
- 0 days/yr
- Unhealthy air days in 30 yrs
- 1 days/yr
Risk factors via First Street. Map © Google.
Why this score? — see what drove the F grade
The composite is a weighted blend of 9 inputs, each scored 0–100. Each bar is that input's sub-score; the figure is the points it added to the 100-point composite (weight × sub-score).
- Appreciation +10.0/10.0
- Rent growth +4.9/5.0
- Cash flow +4.8/30.0
- Livability +3.8/5.0
- Schools +3.3/10.0
- Condition / age +2.5/5.0
- ARV discount +1.9/15.0
- 1% rule +1.6/10.0
- DSCR +0.0/10.0
$255,000
🖨 Deal sheet (PDF) 📄 Offer letter ✓ Due diligence
Listing remarks MLS
Need a project this winter? This is the perfect one! This brink Ranch in Johnson City features a master suite, den that walks out to the enclosed patio, and a large laundry room. Fully fenced yard, hot tub and in-ground pool. Home, pool and hot tub sold AS-IS, where-is, cash only sale.
Key facts
- 8,712 sq ft lot
- Garage
- Pool
Property features AI
Exterior
- Parking: Detached 1-car garage
- Utilities: Public water; Public sewer
- Home design: Single-family residence; Residential property
- Construction: Brick construction; Slab foundation; Above-grade finished area: 1,596
- Exterior features: Covered, enclosed patio
Interior
- Flooring: Hardwood
- Bathrooms: 2 full bathrooms; 1 half bathroom
- Heating & cooling: Baseboard heating
- Interior features: Gas water heater; Hardwood floors; 9 total rooms
Neighborhood map
What this means for you Summary
Snapshot
- This is a 3-bed/1.5-bath single-family listed at $255k.
Deal economics
- At list price, monthly cash flow is $-625 ($-8k/yr) — negative.
- To cash-flow at today's rent, offer at most $145k (43.3% below list).
- To meet the 1% rule (rent ≥ 1% of price), the offer needs to be $168k (33.9% below list).
- Recommended offer: $145k (43.3% below list) — sets the bar for cash-flow.
- Cap rate 3.4% vs local median 6.2% in Johnson City — below-typical yield; the buyer is paying a premium for something (appreciation thesis, condition, location) that the cap rate doesn't capture.
Location & tenants
- Location reads 76/100 on livability (#238 in NY, #3,739 nationally) — a middle-class / working-renter tenant base. Strengths: cost of living A+, housing A+, health & safety A+; Watch: crime F, employment D-.
- Johnson City Central School District (suburban): math 38% / reading 41% proficiency, ranked #535 of 590 in NY (top 91%) — families likely to look elsewhere, expect single-tenant / working-renter base with shorter leases.
- Zoned schools: Johnson City Elementary/Primary School (496 students, 55% FRL) — zoned schools at 55% FRL track the district average.
- Market conditions: Rents rising fast (+9.5%/yr); 99 active listings in the ZIP; 340 units permitted in Broome County in 2024 (269 in 5+ unit buildings).
- This rent runs 34% of the median local income ($59k/yr) — at the standard rent-burdened threshold; future hikes will face affordability resistance.
Forward outlook
- In year one you build about $27k of equity ($2k loan paydown + $26k appreciation (10.0% local appreciation)).
- Broome County population projected at -13% by 2050 — secular population decline; favor cash flow + early exit over multi-decade hold.
- By year 2, paydown + projected appreciation supports a ~$44k cash-out refi (75% LTV) — recoverable capital for the next deal without selling this one.
Negotiation context
- Only 1 days on market — expect competitive offers; lowballing is unlikely to land.
- 2 sale attempts since 5y ago with the ask held roughly flat each time — persistent listings suggest the price (not the market) is what's stuck; bring a comps-based counter.
- Current owner paid $75k; list at $255k implies a 240% gain — meaningful room to come down on a strong offer.
Questions for the listing agent
- What do current leases actually rent for vs. the listed asking? Can we see a recent rent roll and the last 12 months of T-12 income?
- Built in 1968 — when were the roof, HVAC, electrical panel, plumbing, and water heater last replaced?
- Is there a deadline driving the sale (1031 exchange, divorce, estate, relocation)? That informs how much negotiation room exists.
- Crime grade is F in this area — have there been break-ins, vandalism, or insurance claims at this property in the last 3 years? What carrier currently insures it and at what premium?
- The area grade is low — what's the realistic commute time and amenity access for the typical tenant pool here? Any planned neighborhood developments (good or bad) we should know about?
- What's the average days-on-market for RENTAL listings here right now (not sales)? A rising rental-DOM trend means longer vacancies and softer asking-rent achievability than the comps imply.
- What's the recent tenant-quality profile in this submarket — average credit score on applications, eviction rate, late-payment / NSF rate, and stable-employment percentage? A property-management company in the area should have these aggregated.
- How much new for-sale + rental construction is in the pipeline within 1–3 miles? Heavy new supply typically softens prices + rents 12–24 months out; constrained supply supports both.
Investment metrics
- 1% rule
- 0.66% ✗
- Cap rate
- 3.35%
- Cash-on-cash
- -10.50%
- DSCR
- 0.53
- GRM
- 12.6
CMA / ARV
- ARV (on-the-fly)
- $226,632
- Comps found
- 6
Show comp detail 6 sales within ~0.75 mi
| Address | Dist | Beds/Ba | Sqft | Sold | Price | $/sf | Match |
|---|---|---|---|---|---|---|---|
| 904 Dellapenna Dr | 0.20mi | 3/2.0 | 1,765 (+11%) | 7mo | $290,000 | $164 | 65 |
| 1116 Tamara Ln | 0.46mi | 3/1.5 | 1,662 (+4%) | 15mo | $244,329 | $147 | 59 |
| 802 Oakdale Rd | 0.47mi | 3/1.5 | 1,449 (-9%) | 5mo | $206,000 | $142 | 58 |
| 16 Penna Rd | 0.37mi | 3/2.0 | 1,777 (+11%) | 6mo | $220,000 | $124 | 57 |
| 512 Nelson Rd | 0.70mi | 3/1.0 | 1,419 (-11%) | 5mo | $165,000 | $116 | 43 |
| 901 Dellapenna Dr | 0.24mi | 3/2.0 | 1,832 (+15%) | 24mo | $250,000 | $136 | 43 |
Match score weights: distance 35% · size 25% · config 20% · recency 20%. Top-matched comps best support the ARV.
Projected returns pro-forma
10.0% appreciation · 8.0% rent growth · sell at horizon
- IRR
- 18.3%
- Equity multiple
- 2.51×
- Total profit
- $108,118
- Equity at exit
- $229,724
- IRR
- 18.2%
- Equity multiple
- 6.21×
- Total profit
- $372,037
- Equity at exit
- $495,409
Cash invested: $71,400 (down + closing). Projections, not guarantees.
Landlord ↔ Tenant lean methodology
- Overall (STATE)
- 15 Strongly Tenant-Friendly
- State New York
- 15 Strongly Tenant-Friendly · D+10
- County
- — inherits STATE
- City
- — inherits STATE
ZIP-level market 13790
- Home prices YoY
- 6.8%
- Rents YoY
- 9.5%
- Active inventory
- 99
- Price-to-rent
- 12.6×
Monthly cashflow live
- Estimated rent
- $1,685 medium interval (Pro) →
- Mortgage (P&I)
- −$1,337
- Tax from tax record
- −$512 /mo · $6,147/yr
- Insurance
- −$106
- HOA
- −$0
- Vacancy / Maint / Mgmt
- −$354
- Net cashflow
- $-625
Break-even live
Sensitivity live
| Price | -10% $-481 | -5% $-553 | +0% $-625 | +5% $-697 | +10% $-769 |
|---|---|---|---|---|---|
| Rent | -10% $-758 | -5% $-692 | +0% $-625 | +5% $-558 | +10% $-492 |
| Rate | -1.0pp $-497 | -0.5pp $-560 | base $-625 | +0.5pp $-691 | +1.0pp $-758 |
UW: 25.0% down · 7.5% · 30yr · 1.5% tax · 5.0% vac · 8.0% maint · 8.0% mgmt
Financing live
Cash to close
- Down payment
- $63,750
- Closing costs
- $7,650
- Reserves months
- —
- Total cash needed
- —
Loan-product check · same deal, 3 products live
Conventional
25% down · 7.5% · 30yr
- Down + closing
- —
- Monthly P&I
- —
- Monthly cashflow
- —
- DSCR
- —
- Eligible?
- —
Personal DTI + credit; lowest rate.
DSCR
20% down · 8.5% · 30yr
- Down + closing
- —
- Monthly P&I
- —
- Monthly cashflow
- —
- DSCR
- —
- Eligible?
- —
No personal income docs; deal must DSCR.
Hard money
10% down · 12.0% · 12mo
- Down + closing
- —
- Monthly P&I
- —
- Monthly cashflow
- —
- DSCR
- —
- Eligible?
- —
Short-term bridge; refi at stabilization.
Listing history 2 events
-
2026-06-18remarks 128-char remark
-
2026-06-18$255,000 Active 1 DOM
ⓘ Source: listings_history table (triggers on properties + properties_extension) + one-shot
backfill from property_details.listing_events for pre-trigger history.
Tax reassessment forecast NY · Partial reset (capped growth)
- Current annual tax
- $6,147 · $512/mo
- Projected year-2 tax
- $6,147 · $512/mo
- Expected delta
- $0/yr ($0/mo · 0.0%)
ⓘ Screening estimate from a state-policy table — verify with the county assessor before closing.
Climate risk First Street
- Flood 4/10 Moderate FEMA zone X · 24% chance over 30 yrs
- Wildfire 2/10 Low
- Heat 2/10 Low 7 d/yr ≥94°F today · 16 d/yr by 30 yrs out
- Wind 2/10 Low 2% chance of damaging wind over 30 yrs
- Air quality 2/10 Low 0 unhealthy d/yr today · 1 by 30 yrs out
Nearby sold comps map
Loading sold comps map…
Walkable amenities ~0.75 mi
Loading nearby amenities…
Taxation est. · year 1
- Rental income
- $20,214
- − Mortgage interest
- −$14,284
- − Property taxes
- −$6,147
- − Insurance
- −$1,275
- − Repairs & maintenance
- −$1,617
- − Management
- −$1,617
- − Depreciation
- −$7,418
- Taxable loss
- −$12,145
- Est. tax savings @ 24.0%
- +$2,915
- After-tax cash flow
- $-4,586/yr
For passive investors: Depreciation is non-cash, so a rental often shows a tax loss while cash-flowing — sheltering income. Rental losses are passive: they offset passive income freely, and up to $25,000/yr can offset ordinary (W-2) income if you actively participate and your MAGI is under $100k (phasing out to $0 by $150k); unused losses carry forward. On sale, claimed depreciation is recaptured at up to 25%, and gains may owe capital-gains tax (a 1031 exchange can defer both). Figures are a year-1 estimate at your 24.0% rate — not tax advice; consult a CPA.
Schools (NCES district)
- District
- Johnson City Central School District
- NCES district ID
- 3615900
- Math proficiency
- 38% ▼ -8.00%
- Reading proficiency
- 41% ▲ 2.00%
- Median HH income
- $40,514
- Composite
- 33.17/100
- National rank
- #5545
- State rank
- #535 of 590 in NY
Livability — Johnson City
- Score
- 76/100
- State rank
- #238
- US rank
- #3739
Category grades
Schools grade is shown separately in the Schools card above.
Census & demographics
- Census place
- Johnson City, NY
- County
- Broome County · 126,805 people
- City population
- 18,739
- Metro
- Binghamton, NY
- Population (ZIP)
- 18,739
- Household income
- $59,045
- Rent vs Own
- Severe rent burden
- 1233.0
Population outlook (Broome County) Hauer SSP2
- Today (2025)
- 187,989 people
- By 2030
- 183,066 · -2.6%
- By 2040
- 172,228 · -8.4%
- By 2050
- 163,161 · -13.2%
- By 2075
- 153,641 · -18.3%
- By 2100
- 140,851 · -25.1%
Race, ethnicity, and origin ACS 2023
- Neighborhood character
- Predominantly White (75%)
- Race & ethnicity
- White 75% Two or more races 9% Asian 8% Black 6% Hispanic / Latino 4%
- Common ancestry
- Romanian 6% Lithuanian 3% Scotch-Irish 2%
- Foreign-born
- 9% · Canada, China, Vietnam
- Languages at home
- 88% English-only · Other Indo-European 4% French/Haitian/Cajun 2% Spanish 2%
Political lean MEDSL · Broome
- 2024 margin
- Toss-up / Even · D 50.2% · R 49.8%
- 2008→2024 swing
- -7.6pp toward R · 2008: 8.0pp · 2024: 0.4pp
- All cycles
- 2024: D+0.4 2020: D+3.5 2016: R+3.7 2012: D+4.6 2008: D+8.0
Not yet ingested
- Civics
- —
Market trends
- HPI YoY
- ▲ 18.06%
- Current HPI
- 285.3668
- Rent YoY
- ▲ 9.47%
- Metro
- Binghamton, NY
- State GDP YoY
- ▲ 2.60%
- F500 in state
- 92
Industry mix (Fortune 500 HQ in NY)
| Industry | F500 HQs | Revenue |
|---|---|---|
| Financial Services | 10 | $950B |
|
||
| Consumer Goods | 9 | $162B |
|
||
| Insurance | 4 | $225B |
|
||
| Telecommunications | 2 | $144B |
|
||
| Pharmaceuticals | 2 | $112B |
|
||
| Media / Entertainment | 2 | $69B |
|
||
Price history
+96.2% since first listed4 events — show timeline
- 2026-06-15 Listed $255,000 GBAOR
- 2021-11-15 Sold (MLS) $75,000 GBAOR
- 2021-09-14 Listed $69,900 GBAOR
- 2008-09-09 Sold (Public Records) $130,000 Public Records
Property tax history
+2.2%/yrLatest (2025): $6,147 · +1.7% YoY. Source: county tax records.
Cash-flow waterfall
monthlySold comps — $/sqft
last 12 mo · ≤1 miLoading sold comps…