8400 Lagos De Campo Blvd #303 · Tamarac, FL
Flood risk 1/10 · Minimal
- FEMA flood zone
- AH
- Chance of flooding over 30 yrs
- 0.0%
- Est. flood insurance / yr
- $1,142 – $2,507
Fire risk 1/10 · Minimal
- Est. fire insurance / yr
- $947 – $1,759
Heat risk 9/10 · Severe
- Hot days now (above 105°F)
- 7 days/yr
- Hot days in 30 yrs
- 25 days/yr
Wind risk 10/10 · Severe
- Chance of severe wind over 30 yrs
- 99.0%
Air-quality risk 3/10 · Minor
- Unhealthy air days now
- 2 days/yr
- Unhealthy air days in 30 yrs
- 3 days/yr
Risk factors via First Street. Map © Google.
Why this score? — see what drove the C- grade
The composite is a weighted blend of 9 inputs, each scored 0–100. Each bar is that input's sub-score; the figure is the points it added to the 100-point composite (weight × sub-score).
- Cash flow +16.2/30.0
- 1% rule +10.0/10.0
- ARV discount +7.5/15.0
- DSCR +5.0/10.0
- Schools +4.1/10.0
- Livability +3.8/5.0
- Condition / age +2.5/5.0
- Rent growth +2.0/5.0
- Appreciation +0.0/10.0
$130,000
🖨 Deal sheet (PDF) 📄 Offer letter ✓ Due diligence
Listing remarks
Price is down! $145,000 now down $130,000! Seller will provide new aircon and pay the assessment in full prior closing. 2023 Roof, building will be painted brand new. All furnishings can be included in the sale. Impact windows wrapped around the balcony and door, offering peace of mind for the Florida storm and energy efficiency. The association has reserves, allows eligible first time homebuyers to make a small down payment for conventional lending through most lenders. The community is well-managed and allows additional adult occupants (18+), an assigned parking, and ample addtl. permit parking available for residents. HOA reqts. include a minimum annual income of $30,000 and a 650 credi
Key facts
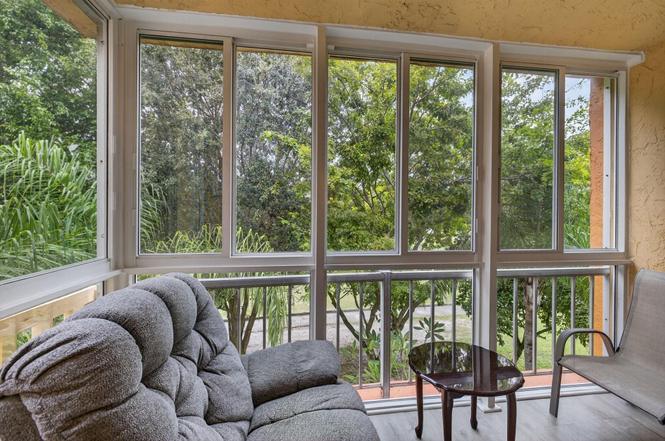
- Enclosed balcony
- Ample parking
- Top-floor condo
Tags
Property features AI
Finance
- HOA & community: Has association; Monthly HOA fee (included items: common areas, elevator, recreation facility); Association amenities: Elevator(s), Management, Parking, Pool, Manager on site, Community room, Maintained community; Senior community
Exterior
- Parking: Association-managed parking
- Security: Other security features
- Utilities: Cable not available
- Home design: Condominium; Resale; Third-floor entry; 3-story building
- Construction: Block construction
- Exterior features: On golf course
Interior
- Kitchen: Dishwasher; Electric range; Microwave; Refrigerator
- Bedrooms: 2 bedrooms on the main level
- Flooring: Tile
- Bathrooms: 2 full bathrooms on the main level
- Heating & cooling: Central heating; Central air; Ceiling fan(s)
- Interior features: Dishwasher; Electric range; Microwave; Refrigerator; Furnished negotiable
- Laundry & utility: Laundry in hall
Neighborhood map
What this means for you Summary
Snapshot
- This is a 2-bed/2.0-bath condo listed at $130k.
Deal economics
- At list price, monthly cash flow is $-83 ($-992/yr) — negative.
- To cash-flow at today's rent, offer at most $115k (11.2% below list).
- Meets the 1% rule at list price ($2k rent vs $130k).
- Recommended offer: $115k (11.2% below list) — sets the bar for cash-flow.
- Cap rate 6.9% vs local median 3.9% in Tamarac — top-decile yield for the area; either an underpriced asset or a hidden risk that comps aren't pricing in. Stress-test before assuming the spread holds.
Location & tenants
- Location reads 76/100 on livability (#239 in FL, #3,785 nationally) — a middle-class / working-renter tenant base. Strengths: housing A+, health & safety A+, cost of living A-; Watch: employment C-, amenities F, commute F.
- Broward (suburban): math 42% / reading 53% proficiency, ranked #46 of 73 in FL (top 63%) — families likely to look elsewhere, expect single-tenant / working-renter base with shorter leases.
- Zoned schools: Challenger Elementary School (math 37% / reading 53%, grade D-, #1,271 of 2,144 statewide, top 60%, 909 students, 62% FRL); Nova Middle School (math 44% / reading 53%, grade C-, #274 of 571 statewide, top 50%, 1,284 students, 68% FRL); J. P. Taravella High School (math 19% / reading 45%, grade F, #415 of 667 statewide, top 63%, 2,586 students, 54% FRL).
- Market conditions: Rents soft (-1.9%/yr); 594 active listings in the ZIP; 40 comparable units currently listed for rent nearby; rentals at typical pace (median 21d on market — plan ~3-4 weeks tenant-placement turnaround); 2,111 units permitted in Broward County in 2024 (1,265 in 5+ unit buildings).
- This rent runs 38% of the median local income ($62k/yr) — at the standard rent-burdened threshold; future hikes will face affordability resistance.
Forward outlook
- Local home prices are declining (-3.0%/yr); year-one equity from $899 of loan paydown is wiped out by about $4k of value loss. Plan a longer hold.
- Broward County population projected at +34% by 2050 — long-run rental-demand tailwind backs the buy-and-hold thesis.
Negotiation context
- It's been on market 102 days — a 9% lower offer ($118k) is reasonable based on typical stale-listing flexibility.
- 3 sale attempts since 24y ago; this cycle's ask has dropped $15k (10%) from the opening price — seller is motivated, your offer sets the floor, not the list.
- Current owner paid $65k; list at $130k implies a 99% gain — meaningful room to come down on a strong offer.
Risks & watch-outs
- Watch-outs: flood insurance adds $152/mo; HOA is 27% of rent.
- Climate carrying-cost: in FEMA flood zone AH (mandatory federal flood insurance); severe wind risk, 99% chance of damaging wind over 30y; extreme-heat days projected 7→25/yr by 2055 (HVAC capex compounding) — expect insurance premiums to compound above CPI over the hold.
Questions for the listing agent
- What do current leases actually rent for vs. the listed asking? Can we see a recent rent roll and the last 12 months of T-12 income?
- It's been on market 102 days. Have you received any prior offers? Is the seller open to a 11% concession, seller financing, or rate buy-down credit?
- Built in 1973 — when were the roof, HVAC, electrical panel, plumbing, and water heater last replaced?
- What's the actual annual flood-insurance premium (NFIP or private), and is the property in a SFHA with mandatory coverage?
- What does the HOA fee cover, when was the last increase, and are there any pending special assessments or reserve-fund shortfalls?
- Any open or pending special assessments — roof, HVAC, plumbing, elevator, façade? What's the per-unit balance and payoff schedule, and is the seller paying it off at close or rolling it to the buyer?
- Why hasn't it sold? Are there any deal-killer items the seller is aware of (foundation, flood, title, zoning, code violations)?
- Is there a deadline driving the sale (1031 exchange, divorce, estate, relocation)? That informs how much negotiation room exists.
- Schools are B-rated — typically a magnet for longer-tenancy family renters. What's the average tenant stay here, and is there a school-zone premium baked into asking?
- What's the average days-on-market for RENTAL listings here right now (not sales)? A rising rental-DOM trend means longer vacancies and softer asking-rent achievability than the comps imply.
- What's the recent tenant-quality profile in this submarket — average credit score on applications, eviction rate, late-payment / NSF rate, and stable-employment percentage? A property-management company in the area should have these aggregated.
- How much new apartment / multifamily construction is in the pipeline within 1–3 miles? Heavy new supply (>2% of stock underway) typically softens rents 12–24 months out; light construction supports rent growth.
Investment metrics
- 1% rule
- 1.50% ✓
- Cap rate
- 6.93%
- Cash-on-cash
- 2.29%
- DSCR
- 1.10
- GRM
- 5.6
CMA / ARV
No comps found within radius.
Projected returns pro-forma
-3.0% appreciation · 0.0% rent growth · sell at horizon
- IRR
- -27.0%
- Equity multiple
- 0.13×
- Total profit
- $-31,564
- Equity at exit
- $19,383
- IRR
- -66.0%
- Equity multiple
- -0.49×
- Total profit
- $-54,392
- Equity at exit
- $11,240
Cash invested: $36,400 (down + closing). Projections, not guarantees.
Landlord ↔ Tenant lean methodology
- Overall (STATE)
- 87 Strongly Landlord-Friendly
- State Florida
- 87 Strongly Landlord-Friendly · R+3
- County
- — inherits STATE
- City
- — inherits STATE
ZIP-level market 33321
- Home prices YoY
- -30.4%
- Rents YoY
- -1.9%
- Active inventory
- 594
- Price-to-rent
- 5.6×
Monthly cashflow live
- Estimated rent
- $1,947 high interval (Pro) →
- Mortgage (P&I)
- −$682
- Tax from tax record
- −$198 /mo · $2,370/yr
- Insurance
- −$54
- Flood insurance flood zone
- −$152 /mo · $1,824/yr
- HOA
- −$535
- Vacancy / Maint / Mgmt
- −$409
- Net cashflow
- $-83
Break-even live
Sensitivity live
| Price | -10% $-9 | -5% $-46 | +0% $-83 | +5% $-119 | +10% $-156 |
|---|---|---|---|---|---|
| Rent | -10% $-236 | -5% $-160 | +0% $-83 | +5% $-6 | +10% $71 |
| Rate | -1.0pp $-17 | -0.5pp $-50 | base $-83 | +0.5pp $-116 | +1.0pp $-151 |
UW: 25.0% down · 7.5% · 30yr · 1.5% tax · 5.0% vac · 8.0% maint · 8.0% mgmt
Financing live
Cash to close
- Down payment
- $32,500
- Closing costs
- $3,900
- Reserves months
- —
- Total cash needed
- —
Loan-product check · same deal, 3 products live
Conventional
25% down · 7.5% · 30yr
- Down + closing
- —
- Monthly P&I
- —
- Monthly cashflow
- —
- DSCR
- —
- Eligible?
- —
Personal DTI + credit; lowest rate.
DSCR
20% down · 8.5% · 30yr
- Down + closing
- —
- Monthly P&I
- —
- Monthly cashflow
- —
- DSCR
- —
- Eligible?
- —
No personal income docs; deal must DSCR.
Hard money
10% down · 12.0% · 12mo
- Down + closing
- —
- Monthly P&I
- —
- Monthly cashflow
- —
- DSCR
- —
- Eligible?
- —
Short-term bridge; refi at stabilization.
Rent comps 40 comps
| Address | Beds | Baths | Sqft | Rent | $/sqft | DOM | Units | Dist |
|---|---|---|---|---|---|---|---|---|
| 8301 Sands Point Blvd Tamarac, FL | 1.0–2.0 | 1.5–2.0 | 937 | $1,800 | $1.92 | 0d | 2 | 0.13mi |
| 8405 NW 61st St Unit D305 Tamarac, FL | 2.0 | 2.0 | 1040 | $1,770 | $1.70 | 9d | 1 | 0.13mi |
| 8311 Sands Point Blvd Unit 106 Tamarac, FL | 1.0 | 1.5 | 825 | $1,750 | $2.12 | 9d | 1 | 0.15mi |
| 8310 Sands Point Blvd Unit L305 Tamarac, FL | 1.0 | 1.5 | 825 | $1,600 | $1.94 | 9d | 1 | 0.16mi |
| 8051 S Colony Cir Apt S205 Tamarac, FL | 2.0 | 2.0 | 949 | $1,750 | $1.84 | 0d | 1 | 0.26mi |
| 8205 NW 61st St Unit B202 Tamarac, FL | 2.0 | 2.0 | 1100 | $2,000 | $1.82 | 26d | 1 | 0.29mi |
| 8060 Colony Cir N Tamarac, FL | 1.0 | 1.5 | 750 | $1,600 | $2.13 | 19d | 2 | 0.31mi |
| 8060 Colony Cir N #208 Tamarac, FL | 1.0 | 1.5 | 750 | $1,700 | $2.27 | 17d | 1 | 0.31mi |
| 8000 Colony Cir S #305 Tamarac, FL | 2.0 | 2.0 | 949 | $1,800 | $1.90 | 9d | 1 | 0.34mi |
| 8000 Colony Cir S Tamarac, FL | 2.0 | 2.0 | 949 | $1,875 | $1.98 | 21d | 2 | 0.34mi |
| 8000 S Colony Cir Apt S305 Tamarac, FL | 2.0 | 2.0 | 949 | $1,750 | $1.84 | 0d | 1 | 0.34mi |
| 8000 Colony Cir S #309 Tamarac, FL | 2.0 | 2.0 | 949 | $1,950 | $2.05 | 26d | 1 | 0.34mi |
| 8001 Fairview Dr #106 Tamarac, FL | 2.0 | 2.0 | 949 | $1,900 | $2.00 | 26d | 1 | 0.35mi |
| 5908 NW 81st Ave Tamarac, FL | 2.0 | 1.0 | 1062 | $2,100 | $1.98 | 20d | 1 | 0.36mi |
| 8051 Colony Cir S #205 Tamarac, FL | 2.0 | 2.0 | 949 | $1,650 | $1.74 | 15d | 1 | 0.37mi |
| 8040 Colony Cir N #207 Tamarac, FL | 1.0 | 1.5 | 750 | $1,475 | $1.97 | 26d | 1 | 0.37mi |
| 7960 Colony Cir N #206 Tamarac, FL | 2.0 | 2.0 | 949 | $1,800 | $1.90 | 26d | 1 | 0.37mi |
| 8650 NW 61st St Tamarac, FL | 2.0 | 1.0 | 925 | $2,881 | $3.11 | 20d | 1 | 0.38mi |
| 8650 NW 61st St Tamarac, FL | 1.0–2.0 | 1.0 | 866 | $2,446 | $2.82 | 0d | 16 | 0.38mi |
| 8650 NW 61st St Tamarac, FL | 2.0 | 1.0 | 925 | $3,870 | $4.18 | 26d | 1 | 0.38mi |
| 8000 Lagos De Campo Blvd Unit A-303 Tamarac, FL | 1.0 | 1.5 | 746 | $1,775 | $2.38 | 26d | 1 | 0.39mi |
| 8000 Lagos De Campo Blvd Unit A-307 Tamarac, FL | 2.0 | 2.0 | 1078 | $2,250 | $2.09 | 22d | 1 | 0.39mi |
| 7910 Colony Cir N #308 Tamarac, FL | 1.0 | 1.5 | 750 | $1,600 | $2.13 | 26d | 1 | 0.41mi |
| 8107 NW 58th Pl Unit 8107 Tamarac, FL | 2.0 | 1.0 | 1082 | $2,200 | $2.03 | 26d | 1 | 0.41mi |
| 7900 Colony Cir S #303 Tamarac, FL | 1.0 | 1.5 | 750 | $1,680 | $2.24 | 26d | 1 | 0.42mi |
| 8002 Lagos de Campo Blvd Unit 101B Tamarac, FL | 2.0 | 2.0 | 1078 | $2,200 | $2.04 | 26d | 1 | 0.43mi |
| 8050 W McNab Rd #206 Tamarac, FL | 2.0 | 2.0 | 1040 | $1,890 | $1.82 | 16d | 1 | 0.43mi |
| 8050 W McNab Rd #206 Tamarac, FL | 2.0 | 2.0 | 1040 | $1,890 | $1.82 | 9d | 1 | 0.43mi |
| 7900 Fairview Dr #105 Tamarac, FL | 2.0 | 2.0 | 949 | $2,050 | $2.16 | 7d | 1 | 0.44mi |
| 7900 Fairview Dr Tamarac, FL | 2.0 | 2.0 | 949 | $2,050 | $2.16 | 4d | 1 | 0.44mi |
| 8601 W McNab Rd Tamarac, FL | 3.0 | 1.0–2.0 | 993 | $2,586 | $2.60 | 0d | 12 | 0.46mi |
| 7820 Colony Cir S #109 Tamarac, FL | 2.0 | 2.0 | 949 | $1,725 | $1.82 | 22d | 1 | 0.47mi |
| 7800 S Colony Cir Tamarac, FL | 2.0 | 2.0 | 949 | $1,725 | $1.82 | 0d | 1 | 0.48mi |
| 7831 Colony Cir N #201 Tamarac, FL | 2.0 | 2.0 | 949 | $2,000 | $2.11 | 15d | 1 | 0.50mi |
| 7950 W McNab Rd #214 Tamarac, FL | 2.0 | 2.0 | 1040 | $1,950 | $1.88 | 5d | 1 | 0.51mi |
| 6301 N University Dr Tamarac, FL | 2.0 | 2.0 | 865 | $1,925 | $2.23 | 26d | 1 | 0.63mi |
| 9065 Preston Pl Unit 16202 Tamarac, FL | 2.0 | 2.0 | 1036 | $2,650 | $2.56 | 26d | 1 | 0.65mi |
| 9091 Lime Bay Blvd #212 Tamarac, FL | 1.0 | 1.0 | 700 | $1,500 | $2.14 | 12d | 1 | 0.65mi |
| 9315 Wedgewood Dr Unit B19 Tamarac, FL | 2.0 | 2.0 | 1060 | $2,495 | $2.35 | 26d | 1 | 0.66mi |
| 9070 Preston Pl #9070 Tamarac, FL | 2.0 | 2.0 | 1036 | $2,500 | $2.41 | 24d | 1 | 0.66mi |
HOA detail condo
- Monthly dues
- $535 · $6,420/yr
- Likely covers
- parking
- Assessments
- None detected in remarks — confirm with the listing agent.
Listing history 25 events
-
2026-06-21pricedays on market $130,000 Active 102 DOM
-
2026-06-18days on market $128,000 Active 99 DOM
-
2026-06-17days on market $128,000 Active 98 DOM
-
2026-06-16days on market $128,000 Active 97 DOM
-
2026-06-15days on market $128,000 Active 96 DOM
-
2026-06-13days on market $128,000 Active 94 DOM
-
2026-06-09days on market $128,000 Active 90 DOM
-
2026-06-07days on market $128,000 Active 88 DOM
-
2026-06-04days on market $128,000 Active 85 DOM
-
2026-06-03days on market $128,000 Active 84 DOM
-
2026-06-02days on market $128,000 Active 83 DOM
-
2026-06-01days on market $128,000 Active 82 DOM
-
2026-05-31days on market $128,000 Active 81 DOM
-
2026-04-24price $128,000
-
2026-02-17$145,000 Active
-
2021-05-11status Pending
-
2021-05-11historical
-
2021-04-20price $89,900
-
2021-03-03price $94,900
-
2021-02-09$99,000 Active
-
2004-04-08soldstatus $65,300
-
2003-02-06historical
-
2002-12-22$86,500
-
2000-12-14soldstatus $40,700
-
1996-12-23soldstatus $35,000
ⓘ Source: listings_history table (triggers on properties + properties_extension) + one-shot
backfill from property_details.listing_events for pre-trigger history.
Tax reassessment forecast FL · Resets to sale price
- Current annual tax
- $2,370 · $198/mo
- Projected year-2 tax
- $2,370 · $198/mo
- Expected delta
- $0/yr ($0/mo · 0.0%)
ⓘ Screening estimate from a state-policy table — verify with the county assessor before closing.
Climate risk First Street
- Flood 1/10 Low FEMA zone AH · 0% chance over 30 yrs
- Wildfire 1/10 Low
- Heat 9/10 Extreme 7 d/yr ≥105°F today · 25 d/yr by 30 yrs out
- Wind 10/10 Extreme 99% chance of damaging wind over 30 yrs
- Air quality 3/10 Moderate 2 unhealthy d/yr today · 3 by 30 yrs out
Nearby sold comps map
Loading sold comps map…
Walkable amenities ~0.75 mi
Loading nearby amenities…
Taxation est. · year 1
- Rental income
- $23,358
- − Mortgage interest
- −$7,282
- − Property taxes
- −$2,370
- − Insurance
- −$2,474
- − Repairs & maintenance
- −$1,869
- − Management
- −$1,869
- − HOA
- −$6,420
- − Depreciation
- −$3,782
- Taxable loss
- −$2,708
- Est. tax savings @ 24.0%
- +$650
- After-tax cash flow
- $-343/yr
For passive investors: Depreciation is non-cash, so a rental often shows a tax loss while cash-flowing — sheltering income. Rental losses are passive: they offset passive income freely, and up to $25,000/yr can offset ordinary (W-2) income if you actively participate and your MAGI is under $100k (phasing out to $0 by $150k); unused losses carry forward. On sale, claimed depreciation is recaptured at up to 25%, and gains may owe capital-gains tax (a 1031 exchange can defer both). Figures are a year-1 estimate at your 24.0% rate — not tax advice; consult a CPA.
Schools (NCES district)
- District
- Broward
- NCES district ID
- 1200180
- Math proficiency
- 42% ▼ -18.00%
- Reading proficiency
- 53% ▼ -5.00%
- Median HH income
- $52,139
- Composite
- 40.88/100
- National rank
- #3621
- State rank
- #46 of 73 in FL
Livability — Tamarac
- Score
- 76/100
- State rank
- #239
- US rank
- #3785
Category grades
Schools grade is shown separately in the Schools card above.
Census & demographics
- Census place
- Tamarac, FL
- County
- Broward County · 1,963,430 people
- City population
- 105,666
- Metro
- Miami-Fort Lauderdale-Pompano Beach, FL
- Population (ZIP)
- 51,216
- Household income
- $62,066
- Rent vs Own
- Severe rent burden
- 1394.0
Population outlook (Broward County) Hauer SSP2
- Today (2025)
- 2,207,033 people
- By 2030
- 2,360,704 · +7.0%
- By 2040
- 2,661,208 · +20.6%
- By 2050
- 2,946,698 · +33.5%
- By 2075
- 3,602,273 · +63.2%
- By 2100
- 3,970,984 · +79.9%
Race, ethnicity, and origin ACS 2023
- Neighborhood character
- Highly diverse neighborhood (Simpson 0.70)
- Race & ethnicity
- Hispanic / Latino 34% White 33% Black 27% Two or more races 20% Asian 3%
- Hispanic origin (detail)
- Mexican 2% Puerto Rican 5% Cuban 5% Dominican 3%
- Common ancestry
- Romanian 3% Hispanic 3% Scotch-Irish 2%
- Foreign-born
- 38% · Canada, Jamaica, Dominican Republic
- Languages at home
- 63% English-only · Spanish 29% French/Haitian/Cajun 4% Other Indo-European 1%
Political lean MEDSL · Broward
- 2024 margin
- D (+17.0) · D 58.0% · R 41.0%
- 2008→2024 swing
- -17.8pp toward R · 2008: 34.7pp · 2024: 17.0pp
- All cycles
- 2024: D+17.0 2020: D+29.8 2016: D+35.0 2012: D+34.9 2008: D+34.7
Not yet ingested
- Civics
- —
Market trends
- HPI YoY
- ▼ -158.63%
- Current HPI
- 362.2989
- Rent YoY
- ▼ -1.86%
- Metro
- Miami-Fort Lauderdale-Pompano Beach, FL
- State GDP YoY
- ▲ 3.28%
- F500 in state
- 36
Industry mix (Fortune 500 HQ in FL)
| Industry | F500 HQs | Revenue |
|---|---|---|
| Industrial Technology | 2 | $29B |
|
||
| Insurance | 2 | $17B |
|
||
| Retail | 1 | $60B |
|
||
| Technology Distribution | 1 | $58B |
|
||
| Homebuilding | 1 | $35B |
|
||
| Technology Manufacturing | 1 | $35B |
|
||
Price history
+265.7% since first listed12 events — show timeline
- 2026-04-24 Price Changed $128,000 Beaches MLS
- 2026-02-17 Listed $145,000 Beaches MLS
- 2021-05-11 Pending — MARMLS
- 2021-05-11 Listing Removed — MARMLS
- 2021-04-20 Price Changed $89,900 MARMLS
- 2021-03-03 Price Changed $94,900 MARMLS
- 2021-02-09 Listed $99,000 MARMLS
- 2004-04-08 Sold (Public Records) $65,300 Public Records
- 2003-02-06 Listing Removed — Beaches MLS
- 2002-12-22 Listed $86,500 Beaches MLS
- 2000-12-14 Sold (Public Records) $40,700 Public Records
- 1996-12-23 Sold (Public Records) $35,000 Public Records
Property tax history
+16.9%/yrLatest (2025): $2,370 · +4.1% YoY. Source: county tax records.
Cash-flow waterfall
monthlySold comps — $/sqft
last 12 mo · ≤1 miLoading sold comps…