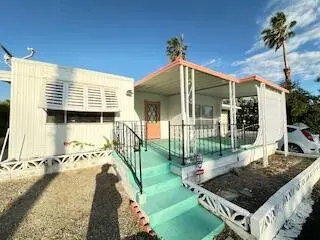
18131 Langlois Rd Unit F16 · Desert Edge, CA
Flood risk 1/10 · Minimal
- FEMA flood zone
- X (unshaded)
- Chance of flooding over 30 yrs
- 0.0%
- Est. flood insurance / yr
- $507 – $1,088
Fire risk 5/10 · Moderate
- Est. fire insurance / yr
- $659 – $1,223
Heat risk 8/10 · Major
- Hot days now (above 109°F)
- 2 days/yr
- Hot days in 30 yrs
- 5 days/yr
Wind risk 1/10 · Minimal
- Chance of severe wind over 30 yrs
- —
Air-quality risk 5/10 · Moderate
- Unhealthy air days now
- 6 days/yr
- Unhealthy air days in 30 yrs
- 8 days/yr
Risk factors via First Street. Map © Google.
Why this score? — see what drove the B grade
The composite is a weighted blend of 9 inputs, each scored 0–100. Each bar is that input's sub-score; the figure is the points it added to the 100-point composite (weight × sub-score).
- Cash flow +30.0/30.0
- 1% rule +10.0/10.0
- DSCR +10.0/10.0
- ARV discount +8.1/15.0
- Condition / age +3.8/5.0
- Livability +3.4/5.0
- Schools +2.7/10.0
- Rent growth +2.5/5.0
- Appreciation +0.0/10.0
$69,000
🖨 Deal sheet 📄 Offer letter ✓ Due diligence
Listing remarks
Step onto the front covered porch and into this Unique Mid-Century themed, updated home to find a welcoming array of warmth inside. To the right of the entry is the great room area combined with the kitchen that features a breakfast bar. This space is perfect for entertaining your family and friends. The built in hutch is between the dining area and kitchen and will provide storage for your treasures. To the left of the entry is an office and combo dining area featuring arched doorways, wood beam ceilings and a sky light. The main bedroom is spacious and has custom built in cabinets/closet space. The second bedroom has a separate sitting area to the right and there are two closets. The ba
Key facts
- Great room area
- Front covered porch
- Built in hutch
Tags
Property features AI
Finance
- Other: Rental restrictions apply; Included in sale: refrigerator, gas stove, some furnishings may be negotiable; Sale terms: cash or cash to new loan; Possession at close of escrow; Property sold as-is; owner has real estate license; pet restrictions
- Financial info: Land lease (space rent) with annual amount noted; Monthly space rent charged in park
- HOA & community: No monthly association fee listed; Senior community; Park manager approval required
Exterior
- Parking: Driveway parking; Covered parking / carport (1 uncovered/assigned space indicated)
- Security: Leased security system
- Utilities: Sewer: unknown
- Home design: One-story; Mobile/manufactured home (Lakewood); Skirted with aluminum; Pier jacks / raised foundation; Other building style
- Construction: Siding exterior
- Exterior features: Corner lot; Community in-ground heated pool and community heated in-ground spa; Pickleball courts; Has hill views; Detached property; Security system (leased)
Interior
- Kitchen: Formica counters; Pantry; Refrigerator; Dishwasher; Gas stove
- Bedrooms: Bedroom information not provided
- Flooring: Laminate and mixed flooring
- Bathrooms: One full bathroom; Shower over tub; Low-flow toilets
- Heating & cooling: Wall furnace heating; Electric cooling; Evaporative cooling; Ceiling fan(s); Wall/window unit(s)
- Interior features: Partially furnished; Living room entry; Dining area / living-dining combo; Great room; Entry; Updated / remodeled condition
- Laundry & utility: Washer; Dryer; Utility room
Neighborhood map
What this means for you Summary
Snapshot
- This is a 2-bed/1.0-bath manufactured listed at $69k. Condition is rated good.
Deal economics
- At list price, monthly cash flow is $942 ($11k/yr) — positive.
- The deal already cash-flows at list — no discount required.
- Meets the 1% rule at list price ($2k rent vs $69k).
- Recommended offer: $68k (1.5% below list) — sets the bar for market timing.
- Cap rate 22.7% vs local median 14.8% in Desert Edge — top-decile yield for the area; either an underpriced asset or a hidden risk that comps aren't pricing in. Stress-test before assuming the spread holds.
Location & tenants
- Location reads 68/100 on livability (#297 in CA) — a middle-class / working-renter tenant base. Strengths: cost of living A+, housing A+; Watch: crime C-, schools F, commute D-.
- Palm Springs Unified (suburban): math 21% / reading 42% proficiency, ranked #328 of 517 in CA (top 63%) — families likely to look elsewhere, expect single-tenant / working-renter base with shorter leases; 73% free/reduced lunch — lower-income household profile, screen leases tightly.
- Market conditions: 216 active listings in the ZIP; 4 comparable units currently listed for rent nearby; rentals lingering (median 44d on market — plan ~5-8 weeks vacancy on turnover, expect pricing pressure); 75% of comp listings sitting > 30 days — soft ceiling on asking rent; 9,195 units permitted in Riverside County in 2024 (1,512 in 5+ unit buildings).
Forward outlook
- Local home prices are declining (-3.0%/yr); year-one equity from $477 of loan paydown is wiped out by about $2k of value loss. Plan a longer hold.
- Riverside County population projected at +22% by 2050 — long-run rental-demand tailwind backs the buy-and-hold thesis.
- At projected returns (-3.0% appreciation + 3.0% rent growth), your $19k cash investment doubles in ~2 years — after that, you're playing with house money.
Negotiation context
- It's been on market 20 days — a 2% lower offer ($68k) is reasonable based on typical stale-listing flexibility.
- 5 sale attempts since 2y ago with the ask held roughly flat each time — persistent listings suggest the price (not the market) is what's stuck; bring a comps-based counter.
Risks & watch-outs
- Climate carrying-cost: moderate wildfire risk; extreme-heat days projected 2→5/yr by 2055 (HVAC capex compounding) — expect insurance premiums to compound above CPI over the hold.
Questions for the listing agent
- Built in 1962 — when were the roof, HVAC, electrical panel, plumbing, and water heater last replaced?
- Is there a deadline driving the sale (1031 exchange, divorce, estate, relocation)? That informs how much negotiation room exists.
- Schools are F-rated, which usually means shorter tenancies and higher turnover. Who's the typical renter profile here, and what's been the actual vacancy rate?
- What's the average days-on-market for RENTAL listings here right now (not sales)? A rising rental-DOM trend means longer vacancies and softer asking-rent achievability than the comps imply.
- What's the recent tenant-quality profile in this submarket — average credit score on applications, eviction rate, late-payment / NSF rate, and stable-employment percentage? A property-management company in the area should have these aggregated.
- How much new for-sale + rental construction is in the pipeline within 1–3 miles? Heavy new supply typically softens prices + rents 12–24 months out; constrained supply supports both.
Investment metrics
- 1% rule
- 2.60% ✓
- Cap rate
- 22.68%
- Cash-on-cash
- 58.54%
- DSCR
- 3.60
- GRM
- 3.2
CMA / ARV
- ARV (on-the-fly)
- $70,000
- Comps found
- 12
Show comp detail 12 sales within ~0.75 mi
| Address | Dist | Beds/Ba | Sqft | Sold | Price | $/sf | Match |
|---|---|---|---|---|---|---|---|
| 18070 Langlois #206 | 0.19mi | 2/2.0 | 1,250 (0%) | 1mo | $185,000 | $148 | 86 |
| 18070 Langlois Rd #245 | 0.19mi | 2/2.0 | 1,248 (-0%) | 12mo | $89,000 | $71 | 77 |
| 18131 Langlois Rd Unit G-14 | 0.00mi | 2/1.5 | 1,104 (-12%) | 7mo | $55,000 | $50 | 73 |
| 17640 Corkill #78 Rd | 0.49mi | 2/2.0 | 1,248 (-0%) | 1mo | $69,999 | $56 | 72 |
| 18555 Roberts Rd #10 | 0.29mi | 2/2.0 | 1,300 (+4%) | 11mo | $90,000 | $69 | 67 |
| 17625 Langlois Rd Spc 13 | 0.38mi | 2/2.0 | 1,344 (+8%) | 0mo | $65,000 | $48 | 65 |
| 17640 Corkill Rd #27 | 0.49mi | 3/2.0 (+1) | 1,248 (-0%) | 7mo | $60,000 | $48 | 62 |
| 18555 Roberts Rd #20 | 0.29mi | 2/2.0 | 1,344 (+8%) | 12mo | $55,900 | $42 | 60 |
| 17640 Corkill Rd #22 | 0.49mi | 2/2.0 | 1,200 (-4%) | 12mo | $65,000 | $54 | 56 |
| 17640 Corkill Rd #46 | 0.49mi | 3/2.0 (+1) | 1,200 (-4%) | 7mo | $58,000 | $48 | 55 |
| 17555 Corkill Rd | 0.58mi | 2/2.0 | 1,344 (+8%) | 7mo | $105,000 | $78 | 50 |
| 17640 Corkill Rd #61 | 0.50mi | 2/2.0 | 1,152 (-8%) | 12mo | $100,000 | $87 | 49 |
Match score weights: distance 35% · size 25% · config 20% · recency 20%. Top-matched comps best support the ARV.
Projected returns pro-forma
-3.0% appreciation · 3.0% rent growth · sell at horizon
- IRR
- 57.1%
- Equity multiple
- 3.53×
- Total profit
- $48,874
- Equity at exit
- $10,288
- IRR
- 62.1%
- Equity multiple
- 7.21×
- Total profit
- $119,964
- Equity at exit
- $5,966
Cash invested: $19,320 (down + closing). Projections, not guarantees.
Landlord ↔ Tenant lean methodology
- Overall (STATE)
- 18 Strongly Tenant-Friendly
- State California
- 18 Strongly Tenant-Friendly · D+13
- County
- — inherits STATE
- City
- — inherits STATE
ZIP-level market 92241
- Home prices YoY
- -22.8%
- Active inventory
- 216
- Price-to-rent
- 3.2×
Monthly cashflow live
- Estimated rent
- $1,797 medium interval (Pro) →
- Mortgage (P&I)
- −$362
- Tax est. 1.5%
- −$86 /mo · $1,035/yr
- Insurance
- −$29
- HOA
- −$0
- Vacancy / Maint / Mgmt
- −$377
- Net cashflow
- $942
Break-even live
UW: 25.0% down · 7.5% · 30yr · 1.5% tax · 5.0% vac · 8.0% maint · 8.0% mgmt
Financing live
Cash to close
- Down payment
- $17,250
- Closing costs
- $2,070
- Reserves months
- —
- Total cash needed
- —
Loan-product check · same deal, 3 products live
Conventional
25% down · 7.5% · 30yr
- Down + closing
- —
- Monthly P&I
- —
- Monthly cashflow
- —
- DSCR
- —
- Eligible?
- —
Personal DTI + credit; lowest rate.
DSCR
20% down · 8.5% · 30yr
- Down + closing
- —
- Monthly P&I
- —
- Monthly cashflow
- —
- DSCR
- —
- Eligible?
- —
No personal income docs; deal must DSCR.
Hard money
10% down · 12.0% · 12mo
- Down + closing
- —
- Monthly P&I
- —
- Monthly cashflow
- —
- DSCR
- —
- Eligible?
- —
Short-term bridge; refi at stabilization.
Rent comps 4 comps
| Address | Beds | Baths | Sqft | Rent | $/sqft | DOM | Units | Dist |
|---|---|---|---|---|---|---|---|---|
| 18070 Langlois Rd Dsrt Hot Spgs, CA | 2.0 | 2.0 | 950 | $1,850 | $1.95 | 24d | 1 | 0.18mi |
| 18070 Langlois Rd #257 Desert Hot Springs, CA | 2.0 | 2.0 | 1056 | $1,850 | $1.75 | 43d | 1 | 0.18mi |
| 69510 Parkside Dr Desert Hot Springs, CA | 1.0 | 1.0 | 1150 | $1,450 | $1.26 | 43d | 1 | 1.26mi |
| 69470 Midpark Dr Desert Hot Springs, CA | 1.0 | 1.0 | 1298 | $1,500 | $1.16 | 43d | 1 | 1.30mi |
Listing history 14 events
-
2026-06-18days on market $69,000 Active 20 DOM
-
2026-06-17days on market $69,000 Active 19 DOM
-
2026-06-16days on market $69,000 Active 18 DOM
-
2026-06-15days on market $69,000 Active 17 DOM
-
2026-06-13days on market $69,000 Active 15 DOM
-
2026-06-13days on market $69,000 Active 14 DOM
-
2026-06-09days on market $69,000 Active 11 DOM
-
2026-06-08days on market $69,000 Active 10 DOM
-
2026-06-07days on market $69,000 Active 9 DOM
-
2026-06-04days on market $69,000 Active 6 DOM
-
2026-06-03days on market $69,000 Active 5 DOM
-
2026-06-02days on market $69,000 Active 4 DOM
-
2026-06-01days on market $69,000 Active 3 DOM
-
2026-05-31days on market $69,000 Active 2 DOM
ⓘ Source: listings_history table (triggers on properties + properties_extension) + one-shot
backfill from property_details.listing_events for pre-trigger history.
Climate risk First Street
- Flood 1/10 Low FEMA zone X (unshaded) · 0% chance over 30 yrs
- Wildfire 5/10 Major
- Heat 8/10 Severe 2 d/yr ≥109°F today · 5 d/yr by 30 yrs out
- Wind 1/10 Low
- Air quality 5/10 Major 6 unhealthy d/yr today · 8 by 30 yrs out
Nearby sold comps map
Loading sold comps map…
Walkable amenities ~0.75 mi
Loading nearby amenities…
Taxation est. · year 1
- Rental income
- $21,560
- − Mortgage interest
- −$3,865
- − Property taxes
- −$1,035
- − Insurance
- −$345
- − Repairs & maintenance
- −$1,725
- − Management
- −$1,725
- − Depreciation
- −$2,007
- Taxable income
- $10,858
- Est. tax owed @ 24.0%
- −$2,606
- After-tax cash flow
- $8,704/yr
For passive investors: Depreciation is non-cash, so a rental often shows a tax loss while cash-flowing — sheltering income. Rental losses are passive: they offset passive income freely, and up to $25,000/yr can offset ordinary (W-2) income if you actively participate and your MAGI is under $100k (phasing out to $0 by $150k); unused losses carry forward. On sale, claimed depreciation is recaptured at up to 25%, and gains may owe capital-gains tax (a 1031 exchange can defer both). Figures are a year-1 estimate at your 24.0% rate — not tax advice; consult a CPA.
Condition & rehab AI · 12 photos
This mid-century themed home is in good condition with cosmetic updates needed for curb appeal and value enhancement.
Value-add opportunities
- Both Paint exterior trim — Enhances curb appeal and value
- Both Clean gutters — Improves drainage and property value
Renovation cost estimate screening
Value-add ROI direction
- Both Paint exterior trim — Enhances curb appeal and value ↑
- Both Clean gutters — Improves drainage and property value ↑
ⓘ Cost ranges are severity-bucket heuristics (US national rule-of-thumb). Get contractor quotes + a written scope before underwriting a rehab budget.
Schools (NCES district)
- District
- Palm Springs Unified
- NCES district ID
- 0629550
- Math proficiency
- 21% ▼ -7.00%
- Reading proficiency
- 42% ▬ 0.00%
- Median HH income
- $43,638
- Composite
- 26.76/100
- National rank
- #7131
- State rank
- #328 of 517 in CA
Livability — Desert Edge
- Score
- 68/100
- State rank
- #297
- US rank
- #9953
Category grades
Schools grade is shown separately in the Schools card above.
Census & demographics
- Census place
- Desert Edge, CA
- Population (ZIP)
- 8,624
Population outlook (Riverside County) Hauer SSP2
- Today (2025)
- 2,664,475 people
- By 2030
- 2,802,692 · +5.2%
- By 2040
- 3,050,904 · +14.5%
- By 2050
- 3,256,783 · +22.2%
- By 2075
- 3,655,058 · +37.2%
- By 2100
- 3,766,594 · +41.4%
Race, ethnicity, and origin ACS 2023
- Race & ethnicity
- White 50% Hispanic / Latino 46% Two or more races 16% Asian 2% Native American 1%
- Hispanic origin (detail)
- Mexican 36%
- Common ancestry
- Lithuanian 3% Slovak 2% Portuguese 2%
- Foreign-born
- 28% · Canada, South Korea
- Languages at home
- 57% English-only · Spanish 38% Chinese 1% Russian/Polish/Slavic 1%
Political lean MEDSL · Riverside
- 2024 margin
- Toss-up / Even · D 48.0% · R 49.3% · Other 2.6%
- 2008→2024 swing
- -3.6pp toward R · 2008: 2.3pp · 2024: -1.3pp
- All cycles
- 2024: R+1.3 2020: D+8.0 2016: D+4.3 2012: R+0.4 2008: D+2.3
Not yet ingested
- Civics
- —
Market trends
- HPI YoY
- ▼ -118.23%
- Current HPI
- 400.5663
- Rent YoY
- —
- Metro
- —
- State GDP YoY
- ▲ 3.21%
- F500 in state
- 116
Industry mix (Fortune 500 HQ in CA)
| Industry | F500 HQs | Revenue |
|---|---|---|
| Technology | 27 | $1,492B |
|
||
| Financial Services | 3 | $174B |
|
||
| Retail | 3 | $44B |
|
||
| Insurance | 3 | $26B |
|
||
| Media / Entertainment | 2 | $115B |
|
||
| Pharmaceuticals / Biotech | 2 | $62B |
|
||
Price history
-42.3% since first listed12 events — show timeline
- 2026-05-29 Listed $69,000 GPSMLS
- 2026-05-01 Listing Removed — GPSMLS
- 2026-01-21 Price Changed $79,900 GPSMLS
- 2025-10-30 Listed $89,500 GPSMLS
- 2025-07-23 Listing Removed — GPSMLS
- 2025-05-01 Listing Removed — GPSMLS
- 2025-04-30 Price Changed $98,000 GPSMLS
- 2025-02-07 Price Changed $105,900 GPSMLS
- 2024-11-10 Listed $115,900 GPSMLS
- 2024-11-10 Listed $98,000 GPSMLS
- 2024-11-01 Listing Removed — GPSMLS
- 2024-05-17 Listed $119,500 GPSMLS
Cash-flow waterfall
monthlySold comps — $/sqft
last 12 mo · ≤1 miLoading sold comps…