431 Charleston St St N · Blacksburg, SC
Flood risk 1/10 · Minimal
- FEMA flood zone
- X (unshaded)
- Chance of flooding over 30 yrs
- 0.0%
- Est. flood insurance / yr
- $507 – $1,088
Fire risk 4/10 · Minor
- Est. fire insurance / yr
- $783 – $1,453
Heat risk 6/10 · Moderate
- Hot days now (above 103°F)
- 7 days/yr
- Hot days in 30 yrs
- 17 days/yr
Wind risk 3/10 · Minor
- Chance of severe wind over 30 yrs
- 5.0%
Air-quality risk 4/10 · Minor
- Unhealthy air days now
- 4 days/yr
- Unhealthy air days in 30 yrs
- 4 days/yr
Risk factors via First Street. Map © Google.
Why this score? — see what drove the D grade
The composite is a weighted blend of 9 inputs, each scored 0–100. Each bar is that input's sub-score; the figure is the points it added to the 100-point composite (weight × sub-score).
- Cash flow +15.7/30.0
- ARV discount +7.5/15.0
- DSCR +4.8/10.0
- 1% rule +4.4/10.0
- Schools +2.8/10.0
- Livability +2.8/5.0
- Rent growth +2.5/5.0
- Condition / age +2.5/5.0
- Appreciation +0.0/10.0
$155,900
🖨 Deal sheet (PDF) 📄 Offer letter ✓ Due diligence
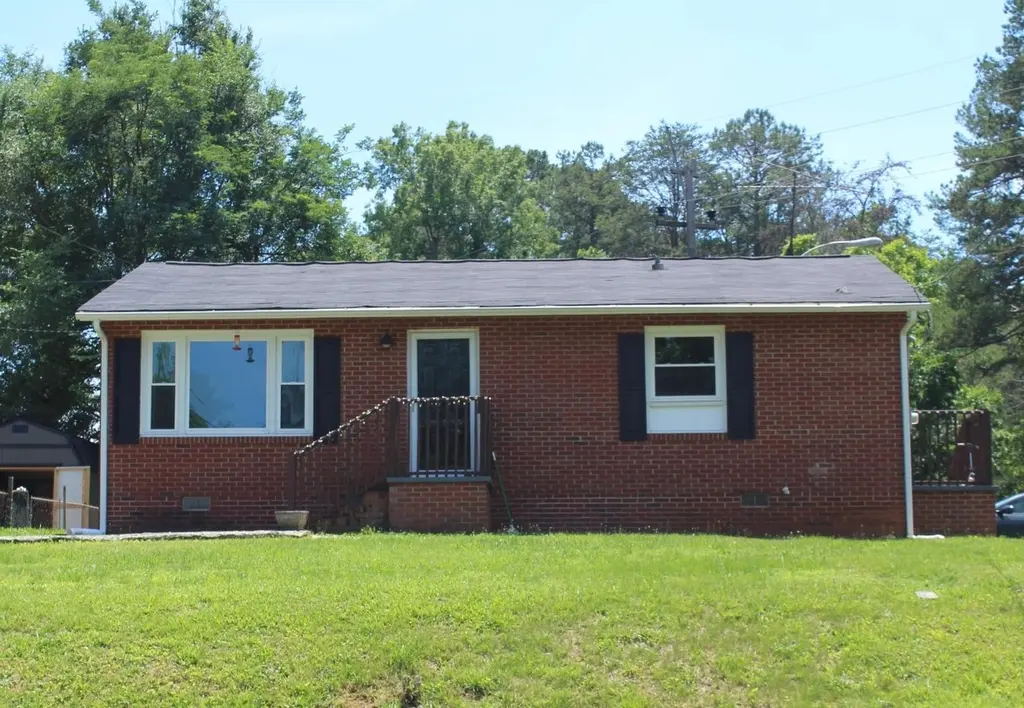
Listing remarks
Completely updated and move-in ready! This 3-bedroom, 1-bath brick home offers low-maintenance living with modern updates. Recent improvements completed in 2023 include a new roof, replacement windows, water heater, updated luxury vinyl plank flooring, updated kitchen cabinetry, modern lighting, and fresh finishes throughout. The functional floor plan makes excellent use of the home's smaller footprint while providing comfortable living spaces and three bedrooms. A large picture window fills the living room with natural light, creating a bright and welcoming space. The corner lot, brick exterior, and updated systems, including a 2020 HVAC, make this home an excellent option for first-time h
Key facts
- Updated systems
- Water heater
- New roof
Tags
Property features AI
Exterior
- Parking: Paved parking; Driveway; Garage faces side; On-street parking
- Security: Smoke detector(s)
- Utilities: Public water; Public sewer
- Home design: Single family residence; One story
- Construction: Brick veneer construction; Composition roof
- Exterior features: Porch; Storm door(s); Sloped, corner and level lot characteristics
Interior
- Kitchen: Range; Electric cooktop; Built-in range; Electric oven; Cooktop; Microwave; Refrigerator; Electric water heater
- Bedrooms: 3 main-level bedrooms
- Bathrooms: 1 full bathroom on the main level
- Interior features: Ceiling fan(s); Laminate counters; Insulated windows; Window treatments; Smoke detector(s)
- Laundry & utility: Washer hookup (main level / in kitchen); Electric dryer hookup; Dryer
Neighborhood map
What this means for you Summary
Snapshot
- This is a 3-bed/1.0-bath single-family listed at $156k.
Deal economics
- At list price, monthly cash flow is $69 ($829/yr) — positive.
- The deal already cash-flows at list — no discount required.
- To meet the 1% rule (rent ≥ 1% of price), the offer needs to be $147k (5.9% below list).
- Recommended offer: $147k (5.9% below list) — sets the bar for 1% rule.
Location & tenants
- Location reads 56/100 on livability (#289 in SC) — a working-class tenant base; expect higher turnover. Strengths: cost of living A+; Watch: amenities F, commute F, employment F.
- Cherokee 01 (rural): math 29% / reading 40% proficiency, ranked #47 of 80 in SC (top 59%) — families likely to look elsewhere, expect single-tenant / working-renter base with shorter leases; 64% free/reduced lunch — lower-income household profile, screen leases tightly.
- Zoned schools: Blacksburg Elementary (math 34% / reading 36%, grade F, #339 of 597 statewide, top 57%, 362 students, 100% FRL); Blacksburg Middle (math 23% / reading 32%, grade F, #147 of 229 statewide, top 66%, 360 students, 72% FRL); Blacksburg High (math 42% / reading 92%, grade B, #73 of 196 statewide, top 41%, 553 students, 80% FRL) — zoned schools average 84% FRL vs 64% district-wide (20 pts higher); higher-poverty schools than district average — tighter screening recommended.
- Market conditions: 45 active listings in the ZIP; 200 units permitted in Cherokee County in 2024 (0 in 5+ unit buildings).
Forward outlook
- Local home prices are declining (-3.0%/yr); year-one equity from $1k of loan paydown is wiped out by about $5k of value loss. Plan a longer hold.
Negotiation context
- It's been on market 15 days — a 2% lower offer ($154k) is reasonable based on typical stale-listing flexibility.
- Current owner paid $93k; list at $156k implies a 68% gain — meaningful room to come down on a strong offer.
Risks & watch-outs
- Watch-outs: built in 1940 — expect roof / HVAC / electrical / plumbing capex.
- Climate carrying-cost: extreme-heat days projected 7→17/yr by 2055 (HVAC capex compounding) — expect insurance premiums to compound above CPI over the hold.
Questions for the listing agent
- Built in 1940 — when were the roof, HVAC, electrical panel, plumbing, and water heater last replaced?
- Is there a deadline driving the sale (1031 exchange, divorce, estate, relocation)? That informs how much negotiation room exists.
- Schools are D-rated, which usually means shorter tenancies and higher turnover. Who's the typical renter profile here, and what's been the actual vacancy rate?
- The area grade is low — what's the realistic commute time and amenity access for the typical tenant pool here? Any planned neighborhood developments (good or bad) we should know about?
- What's the average days-on-market for RENTAL listings here right now (not sales)? A rising rental-DOM trend means longer vacancies and softer asking-rent achievability than the comps imply.
- What's the recent tenant-quality profile in this submarket — average credit score on applications, eviction rate, late-payment / NSF rate, and stable-employment percentage? A property-management company in the area should have these aggregated.
- How much new for-sale + rental construction is in the pipeline within 1–3 miles? Heavy new supply typically softens prices + rents 12–24 months out; constrained supply supports both.
Investment metrics
- 1% rule
- 0.94% ✗
- Cap rate
- 6.82%
- Cash-on-cash
- 1.90%
- DSCR
- 1.08
- GRM
- 8.9
CMA / ARV
No comps found within radius.
Projected returns pro-forma
-3.0% appreciation · 3.0% rent growth · sell at horizon
- IRR
- -13.3%
- Equity multiple
- 0.52×
- Total profit
- $-20,831
- Equity at exit
- $23,245
- IRR
- -4.3%
- Equity multiple
- 0.72×
- Total profit
- $-12,350
- Equity at exit
- $13,479
Cash invested: $43,652 (down + closing). Projections, not guarantees.
Landlord ↔ Tenant lean methodology
- Overall (STATE)
- 90 Strongly Landlord-Friendly
- State South Carolina
- 90 Strongly Landlord-Friendly · R+6
- County
- — inherits STATE
- City
- — inherits STATE
ZIP-level market 29702
- Home prices YoY
- -23.9%
- Active inventory
- 45
- Price-to-rent
- 8.9×
Monthly cashflow live
- Estimated rent
- $1,467 medium interval (Pro) →
- Mortgage (P&I)
- −$818
- Tax from tax record
- −$207 /mo · $2,486/yr
- Insurance
- −$65
- HOA
- −$0
- Vacancy / Maint / Mgmt
- −$308
- Net cashflow
- $69
Break-even live
Sensitivity live
| Price | -10% $157 | -5% $113 | +0% $69 | +5% $25 | +10% $-19 |
|---|---|---|---|---|---|
| Rent | -10% $-47 | -5% $11 | +0% $69 | +5% $127 | +10% $185 |
| Rate | -1.0pp $148 | -0.5pp $109 | base $69 | +0.5pp $29 | +1.0pp $-12 |
UW: 25.0% down · 7.5% · 30yr · 1.5% tax · 5.0% vac · 8.0% maint · 8.0% mgmt
Financing live
Cash to close
- Down payment
- $38,975
- Closing costs
- $4,677
- Reserves months
- —
- Total cash needed
- —
Loan-product check · same deal, 3 products live
Conventional
25% down · 7.5% · 30yr
- Down + closing
- —
- Monthly P&I
- —
- Monthly cashflow
- —
- DSCR
- —
- Eligible?
- —
Personal DTI + credit; lowest rate.
DSCR
20% down · 8.5% · 30yr
- Down + closing
- —
- Monthly P&I
- —
- Monthly cashflow
- —
- DSCR
- —
- Eligible?
- —
No personal income docs; deal must DSCR.
Hard money
10% down · 12.0% · 12mo
- Down + closing
- —
- Monthly P&I
- —
- Monthly cashflow
- —
- DSCR
- —
- Eligible?
- —
Short-term bridge; refi at stabilization.
Listing history 14 events
-
2026-06-21days on market $155,900 Active 15 DOM
-
2026-06-19days on market $155,900 Active 13 DOM
-
2026-06-18price $155,900 Active 12 DOM
-
2026-06-18days on market $157,000 Active 12 DOM
-
2026-06-17days on market $157,000 Active 11 DOM
-
2026-06-16days on market $157,000 Active 10 DOM
-
2026-06-15days on market $157,000 Active 9 DOM
-
2026-06-14days on market $157,000 Active 7 DOM
-
2026-06-13days on market $157,000 Active 6 DOM
-
2026-06-10days on market $157,000 Active 4 DOM
-
2026-06-09days on market $157,000 Active 3 DOM
-
2026-06-08days on market $157,000 Active 2 DOM
-
2026-06-07remarks 699-char remark
-
2026-06-07$157,000 Active 1 DOM
ⓘ Source: listings_history table (triggers on properties + properties_extension) + one-shot
backfill from property_details.listing_events for pre-trigger history.
Tax reassessment forecast SC · Resets to sale price
- Current annual tax
- $2,486 · $207/mo
- Projected year-2 tax
- $2,486 · $207/mo
- Expected delta
- $0/yr ($0/mo · 0.0%)
ⓘ Screening estimate from a state-policy table — verify with the county assessor before closing.
Climate risk First Street
- Flood 1/10 Low FEMA zone X (unshaded) · 0% chance over 30 yrs
- Wildfire 4/10 Moderate
- Heat 6/10 Major 7 d/yr ≥103°F today · 17 d/yr by 30 yrs out
- Wind 3/10 Moderate 5% chance of damaging wind over 30 yrs
- Air quality 4/10 Moderate 4 unhealthy d/yr today · 4 by 30 yrs out
Nearby sold comps map
Loading sold comps map…
Walkable amenities ~0.75 mi
Loading nearby amenities…
Taxation est. · year 1
- Rental income
- $17,602
- − Mortgage interest
- −$8,733
- − Property taxes
- −$2,486
- − Insurance
- −$780
- − Repairs & maintenance
- −$1,408
- − Management
- −$1,408
- − Depreciation
- −$4,535
- Taxable loss
- −$1,748
- Est. tax savings @ 24.0%
- +$419
- After-tax cash flow
- $1,249/yr
For passive investors: Depreciation is non-cash, so a rental often shows a tax loss while cash-flowing — sheltering income. Rental losses are passive: they offset passive income freely, and up to $25,000/yr can offset ordinary (W-2) income if you actively participate and your MAGI is under $100k (phasing out to $0 by $150k); unused losses carry forward. On sale, claimed depreciation is recaptured at up to 25%, and gains may owe capital-gains tax (a 1031 exchange can defer both). Figures are a year-1 estimate at your 24.0% rate — not tax advice; consult a CPA.
Schools (NCES district)
- District
- Cherokee 01
- NCES district ID
- 4501500
- Math proficiency
- 29% ▼ -9.00%
- Reading proficiency
- 40% ▼ -2.00%
- Median HH income
- $34,262
- Composite
- 28.39/100
- National rank
- #6768
- State rank
- #47 of 80 in SC
Livability — Blacksburg
- Score
- 56/100
- State rank
- #289
- US rank
- #22576
Category grades
Schools grade is shown separately in the Schools card above.
Census & demographics
- Census place
- Blacksburg, SC
- Population (ZIP)
- 9,855
Population outlook (Cherokee County) Hauer SSP2
- Today (2025)
- 58,602 people
- By 2030
- 59,336 · +1.3%
- By 2040
- 60,266 · +2.8%
- By 2050
- 60,314 · +2.9%
- By 2075
- 59,276 · +1.2%
- By 2100
- 53,788 · -8.2%
Race, ethnicity, and origin ACS 2023
- Neighborhood character
- Predominantly White (87%)
- Race & ethnicity
- White 87% Two or more races 5% Black 5% Hispanic / Latino 4%
- Common ancestry
- Serbian 1% Lithuanian 1% Scottish 1%
- Foreign-born
- 2% · Canada, Jamaica
- Languages at home
- 97% English-only · Spanish 2%
Political lean MEDSL · Cherokee
- 2024 margin
- Solid R (+51.4) · D 23.9% · R 75.3%
- 2008→2024 swing
- -22.0pp toward R · 2008: -29.3pp · 2024: -51.4pp
- All cycles
- 2024: R+51.4 2020: R+43.8 2016: R+41.7 2012: R+29.3 2008: R+29.3
Not yet ingested
- Civics
- —
Market trends
- HPI YoY
- ▼ -49.63%
- Current HPI
- 158.1138
- Rent YoY
- —
- Metro
- —
- State GDP YoY
- ▲ 4.51%
- F500 in state
- 2
Industry mix (Fortune 500 HQ in SC)
| Industry | F500 HQs | Revenue |
|---|---|---|
| Packaging | 1 | $7B |
|
||
Price history
+68.8% since first listed2 events — show timeline
- 2026-06-06 Listed $157,000 SPMLS
- 2022-12-28 Sold (Public Records) $93,000 Public Records
Property tax history
+10.9%/yrLatest (2025): $2,486 · +4.1% YoY. Source: county tax records.
Cash-flow waterfall
monthlySold comps — $/sqft
last 12 mo · ≤1 miLoading sold comps…