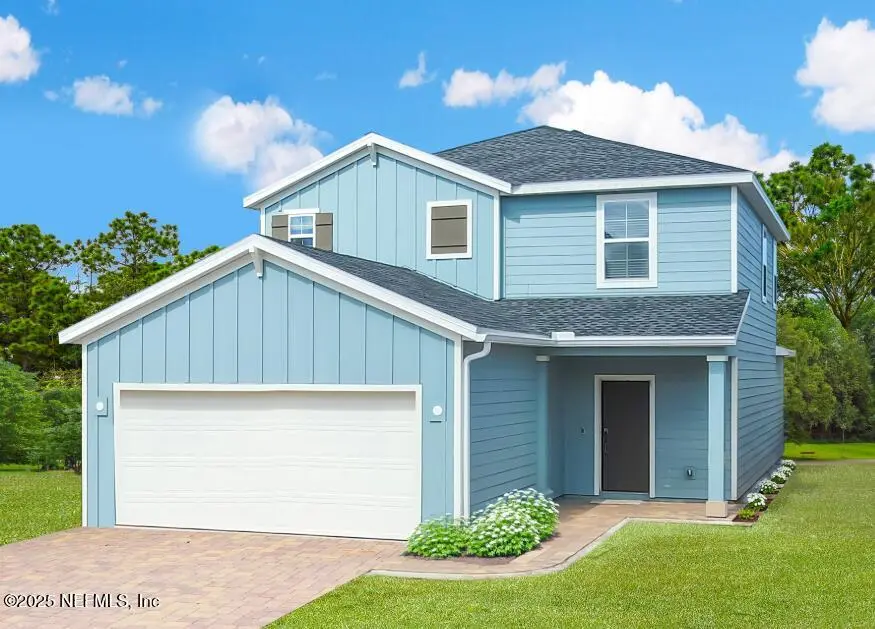
3018 Adelaide Rd · Asbury Lake, FL
Flood risk No data
- FEMA flood zone
- —
- Chance of flooding over 30 yrs
- —
- Est. flood insurance / yr
- —
Fire risk No data
- Est. fire insurance / yr
- —
Heat risk No data
- Hot days now (above threshold)
- —
- Hot days in 30 yrs
- —
Wind risk No data
- Chance of severe wind over 30 yrs
- —
Air-quality risk No data
- Unhealthy air days now
- —
- Unhealthy air days in 30 yrs
- —
Risk factors via First Street. Map © Google.
Why this score? — see what drove the F grade
The composite is a weighted blend of 9 inputs, each scored 0–100. Each bar is that input's sub-score; the figure is the points it added to the 100-point composite (weight × sub-score).
- Cash flow +7.6/30.0
- ARV discount +7.5/15.0
- Schools +5.1/10.0
- Livability +3.1/5.0
- Rent growth +2.6/5.0
- Condition / age +2.5/5.0
- 1% rule +1.7/10.0
- DSCR +1.7/10.0
- Appreciation +0.0/10.0
$364,999
🖨 Deal sheet 📄 Offer letter ✓ Due diligence
Listing remarks
MOVE IN READY! Welcome to the Boone II floor plan by Lennar offering 4 bedrooms, 3 bathrooms, and a 2-car garage. This home features white cabinets with white quartz kitchen countertops, 42'' uppers, and Frigidaire stainless steel appliances including range, microwave, dishwasher, and refrigerator. Ceramic wood-look tile in wet areas and extended through family, dining, and halls. Includes window blinds, water heater, screened lanai, and sprinkler system. Backed by a one-year builder warranty. Green Cove Springs combines small-town charm with modern conveniences. Nestled along the St. Johns River, it offers waterfront parks, boating, and the renowned spring fed pool. Residents enjoy top
Key facts
- Spring fed pool
- Newly built
- White cabinets
Tags
Property features AI
Finance
- Other: Private pool not present; community pool available
- HOA & community: Property is part of an association; Association amenities include clubhouse, fitness center, playground, and trash service; Annual association fee of $120; CDD fee applies
Exterior
- Parking: Attached garage with garage door opener (2-car)
- Security: Smoke detectors
- Utilities: Public sewer; Water connected; Electricity connected; Cable available; Windows listed as energy-efficient feature
- Home design: Two-story single family residence; Residential use
- Construction: Fiber cement and frame construction; Shingle roof
- Exterior features: Covered front porch with screened porch area; Patio/porch; Sprinklers in front and rear; Asphalt road access
Interior
- Kitchen: Dishwasher; Disposal; Electric cooktop and electric oven/range; Microwave; Refrigerator; Ice maker
- Bedrooms: 4 bedrooms (some located on the second floor, at least one on the first floor)
- Flooring: Carpet; Tile
- Bathrooms: 3 full bathrooms
- Heating & cooling: Central heating (electric, heat pump); Central air conditioning (electric)
- Interior features: Breakfast bar and breakfast nook; Entrance foyer; Kitchen island; Pantry; Primary bathroom with tub and separate shower; Split bedroom layout; Walk-in closets
- Laundry & utility: Washer hookup; Electric dryer hookup; Electric water heater
Neighborhood map
What this means for you Summary
Snapshot
- This is a 4-bed/3.0-bath land listed at $365k.
Deal economics
- At list price, monthly cash flow is $-438 ($-5k/yr) — negative.
- To cash-flow at today's rent, offer at most $288k (21.2% below list).
- To meet the 1% rule (rent ≥ 1% of price), the offer needs to be $243k (33.3% below list).
- Recommended offer: $243k (33.3% below list) — sets the bar for 1% rule.
Location & tenants
- Location reads 61/100 on livability (#776 in FL) — a middle-class / working-renter tenant base. Strengths: housing A+, employment A, crime A-; Watch: schools F, amenities F, commute F.
- Clay (suburban): math 58% / reading 59% proficiency, ranked #14 of 73 in FL (top 19%) — acceptable for families but not a draw, mixed tenant base, ~2y average lease.
- Market conditions: Rents flat; 885 active listings in the ZIP; 8 comparable units currently listed for rent nearby; rentals at typical pace (median 16d on market — plan ~3-4 weeks tenant-placement turnaround); solid renter incomes; 1,876 units permitted in Clay County in 2024 (14 in 5+ unit buildings).
- This rent runs 35% of the median local income ($84k/yr) — at the standard rent-burdened threshold; future hikes will face affordability resistance.
Forward outlook
- Local home prices are declining (-3.0%/yr); year-one equity from $3k of loan paydown is wiped out by about $11k of value loss. Plan a longer hold.
- Clay County population projected at +19% by 2050 — long-run rental-demand tailwind backs the buy-and-hold thesis.
Negotiation context
- It's been on market 28 days — a 2% lower offer ($360k) is reasonable based on typical stale-listing flexibility.
Questions for the listing agent
- What do current leases actually rent for vs. the listed asking? Can we see a recent rent roll and the last 12 months of T-12 income?
- What does the HOA fee cover, when was the last increase, and are there any pending special assessments or reserve-fund shortfalls?
- Is there a deadline driving the sale (1031 exchange, divorce, estate, relocation)? That informs how much negotiation room exists.
- Schools are F-rated, which usually means shorter tenancies and higher turnover. Who's the typical renter profile here, and what's been the actual vacancy rate?
- The area grade is low — what's the realistic commute time and amenity access for the typical tenant pool here? Any planned neighborhood developments (good or bad) we should know about?
- What's the average days-on-market for RENTAL listings here right now (not sales)? A rising rental-DOM trend means longer vacancies and softer asking-rent achievability than the comps imply.
- What's the recent tenant-quality profile in this submarket — average credit score on applications, eviction rate, late-payment / NSF rate, and stable-employment percentage? A property-management company in the area should have these aggregated.
- How much new for-sale + rental construction is in the pipeline within 1–3 miles? Heavy new supply typically softens prices + rents 12–24 months out; constrained supply supports both.
Investment metrics
- 1% rule
- 0.67% ✗
- Cap rate
- 4.85%
- Cash-on-cash
- -5.14%
- DSCR
- 0.77
- GRM
- 12.5
CMA / ARV
No comps found within radius.
Projected returns pro-forma
-3.0% appreciation · 0.46% rent growth · sell at horizon
- IRR
- -27.7%
- Equity multiple
- 0.09×
- Total profit
- $-93,149
- Equity at exit
- $54,423
- IRR
- -37.8%
- Equity multiple
- -0.38×
- Total profit
- $-140,914
- Equity at exit
- $31,558
Cash invested: $102,200 (down + closing). Projections, not guarantees.
Landlord ↔ Tenant lean methodology
- Overall (STATE)
- 87 Strongly Landlord-Friendly
- State Florida
- 87 Strongly Landlord-Friendly · R+3
- County
- — inherits STATE
- City
- — inherits STATE
ZIP-level market 32043
- Home prices YoY
- -26.3%
- Rents YoY
- 0.5%
- Active inventory
- 885
- Price-to-rent
- 12.5×
Monthly cashflow live
- Estimated rent
- $2,433 high interval (Pro) →
- Mortgage (P&I)
- −$1,914
- Tax from tax record
- −$284 /mo · $3,402/yr
- Insurance
- −$152
- HOA
- −$10
- Vacancy / Maint / Mgmt
- −$511
- Net cashflow
- $-438
Break-even live
UW: 25.0% down · 7.5% · 30yr · 1.5% tax · 5.0% vac · 8.0% maint · 8.0% mgmt
Financing live
Cash to close
- Down payment
- $91,250
- Closing costs
- $10,950
- Reserves months
- —
- Total cash needed
- —
Loan-product check · same deal, 3 products live
Conventional
25% down · 7.5% · 30yr
- Down + closing
- —
- Monthly P&I
- —
- Monthly cashflow
- —
- DSCR
- —
- Eligible?
- —
Personal DTI + credit; lowest rate.
DSCR
20% down · 8.5% · 30yr
- Down + closing
- —
- Monthly P&I
- —
- Monthly cashflow
- —
- DSCR
- —
- Eligible?
- —
No personal income docs; deal must DSCR.
Hard money
10% down · 12.0% · 12mo
- Down + closing
- —
- Monthly P&I
- —
- Monthly cashflow
- —
- DSCR
- —
- Eligible?
- —
Short-term bridge; refi at stabilization.
Rent comps 8 comps
| Address | Beds | Baths | Sqft | Rent | $/sqft | DOM | Units | Dist |
|---|---|---|---|---|---|---|---|---|
| 3549 Bella Sera Ln Green Cove Springs, FL | 3.0 | 2.0 | 1464 | $2,150 | $1.47 | 23d | 1 | 0.39mi |
| 2935 Darlington Oak Rd Green Cove Springs, FL | 3.0 | 2.5 | 2096 | $2,350 | $1.12 | 7d | 1 | 0.81mi |
| 2555 Bear Creek Way Green Cove Springs, FL | 3.0 | 2.0 | 1655 | $1,835 | $1.11 | 23d | 1 | 0.95mi |
| 2858 Buck Creek Pl Green Cove Springs, FL | 3.0 | 2.0 | 1647 | $1,829 | $1.11 | 16d | 1 | 0.99mi |
| 2506 Creekfront Dr Green Cove Springs, FL | 4.0 | 2.0 | 1638 | $2,554 | $1.56 | 23d | 1 | 1.06mi |
| 2653 Fernleaf Dr Green Cove Springs, FL | 4.0 | 2.0 | 1638 | $2,005 | $1.22 | 7d | 1 | 1.11mi |
| 2621 Fernleaf Dr Green Cove Springs, FL | 4.0 | 2.0 | 1870 | $2,135 | $1.14 | 4d | 1 | 1.13mi |
| 2836 Cross Creek Dr Green Cove Springs, FL | 3.0 | 2.0 | 1453 | $1,880 | $1.29 | 12d | 1 | 1.36mi |
HOA detail
- Monthly dues
- $10 · $120/yr
- Likely covers
- waterpool
Listing history 3 events
-
2026-05-07status Pending
-
2026-04-09$364,999 Active
-
2026-02-19soldstatus $353,800
ⓘ Source: listings_history table (triggers on properties + properties_extension) + one-shot
backfill from property_details.listing_events for pre-trigger history.
Tax reassessment forecast FL · Resets to sale price
- Current annual tax
- $3,402 · $284/mo
- Projected year-2 tax
- $3,402 · $284/mo
- Expected delta
- $0/yr ($0/mo · 0.0%)
ⓘ Screening estimate from a state-policy table — verify with the county assessor before closing.
Nearby sold comps map
Loading sold comps map…
Walkable amenities ~0.75 mi
Loading nearby amenities…
Taxation est. · year 1
- Rental income
- $29,195
- − Mortgage interest
- −$20,446
- − Property taxes
- −$3,402
- − Insurance
- −$1,825
- − Repairs & maintenance
- −$2,336
- − Management
- −$2,336
- − HOA
- −$120
- − Depreciation
- −$10,618
- Taxable loss
- −$11,887
- Est. tax savings @ 24.0%
- +$2,853
- After-tax cash flow
- $-2,399/yr
For passive investors: Depreciation is non-cash, so a rental often shows a tax loss while cash-flowing — sheltering income. Rental losses are passive: they offset passive income freely, and up to $25,000/yr can offset ordinary (W-2) income if you actively participate and your MAGI is under $100k (phasing out to $0 by $150k); unused losses carry forward. On sale, claimed depreciation is recaptured at up to 25%, and gains may owe capital-gains tax (a 1031 exchange can defer both). Figures are a year-1 estimate at your 24.0% rate — not tax advice; consult a CPA.
Schools (NCES district)
- District
- Clay
- NCES district ID
- 1200300
- Math proficiency
- 58% ▼ -8.00%
- Reading proficiency
- 59% ▼ -3.00%
- Median HH income
- $59,379
- Composite
- 50.73/100
- National rank
- #1815
- State rank
- #14 of 73 in FL
Livability — Asbury Lake
- Score
- 61/100
- State rank
- #776
- US rank
- #17575
Category grades
Schools grade is shown separately in the Schools card above.
Census & demographics
- Census place
- Asbury Lake, FL
- County
- Clay County · 208,450 people
- Metro
- Jacksonville, FL
- Population (ZIP)
- 34,562
- Household income
- $84,145
- Rent vs Own
- Severe rent burden
- 449.0
Population outlook (Clay County) Hauer SSP2
- Today (2025)
- 230,495 people
- By 2030
- 242,427 · +5.2%
- By 2040
- 262,244 · +13.8%
- By 2050
- 275,148 · +19.4%
- By 2075
- 295,397 · +28.2%
- By 2100
- 287,592 · +24.8%
Race, ethnicity, and origin ACS 2023
- Neighborhood character
- Predominantly White (77%)
- Race & ethnicity
- White 77% Black 10% Two or more races 7% Hispanic / Latino 6% Asian 2%
- Hispanic origin (detail)
- Mexican 2% Puerto Rican 1%
- Common ancestry
- Slovak 3% Romanian 2% Lithuanian 2%
- Foreign-born
- 5% · Canada
- Languages at home
- 92% English-only · Spanish 5% French/Haitian/Cajun 1% Other Indo-European 1%
Political lean MEDSL · Clay
- 2024 margin
- Solid R (+39.3) · D 29.9% · R 69.2%
- 2008→2024 swing
- +3.6pp toward D · 2008: -42.8pp · 2024: -39.3pp
- All cycles
- 2024: R+39.3 2020: R+37.1 2016: R+44.3 2012: R+45.8 2008: R+42.8
Not yet ingested
- Civics
- —
Market trends
- HPI YoY
- ▼ -107.34%
- Current HPI
- 301.3212
- Rent YoY
- ▲ 0.46%
- Metro
- Jacksonville, FL
- State GDP YoY
- ▲ 3.28%
- F500 in state
- 36
Industry mix (Fortune 500 HQ in FL)
| Industry | F500 HQs | Revenue |
|---|---|---|
| Industrial Technology | 2 | $29B |
|
||
| Insurance | 2 | $17B |
|
||
| Retail | 1 | $60B |
|
||
| Technology Distribution | 1 | $58B |
|
||
| Homebuilding | 1 | $35B |
|
||
| Technology Manufacturing | 1 | $35B |
|
||
Price history
+3.2% since first listed3 events — show timeline
- 2026-05-07 Pending — realMLS
- 2026-04-09 Listed $364,999 realMLS
- 2026-02-19 Sold (Public Records) $353,800 Public Records
Cash-flow waterfall
monthlySold comps — $/sqft
last 12 mo · ≤1 miLoading sold comps…