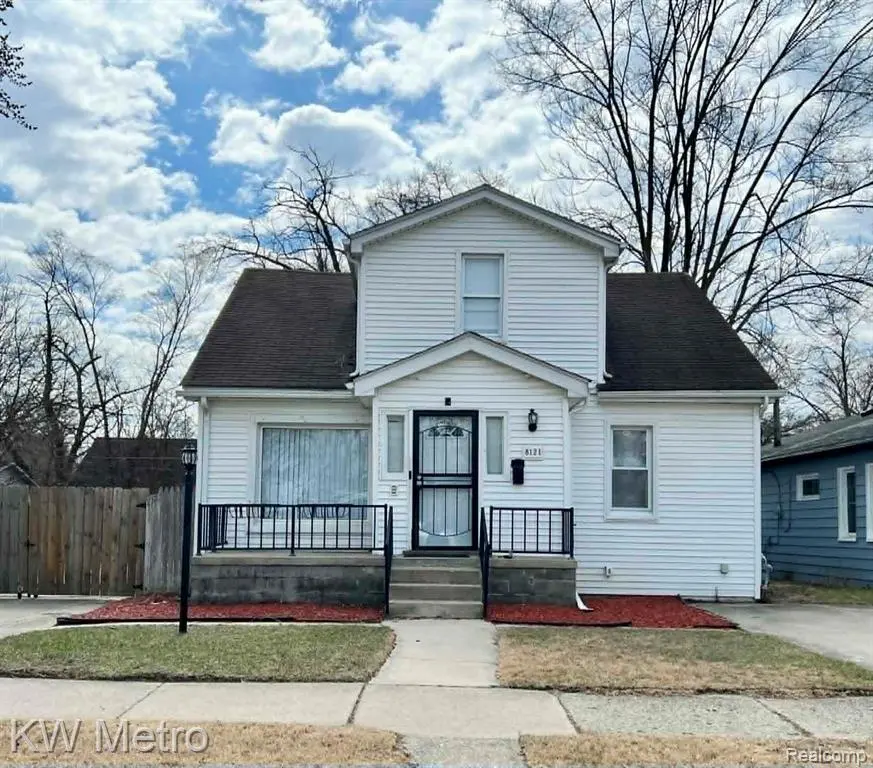
8121 Cloverdale Ave · Ferndale, MI
Flood risk 1/10 · Minimal
- FEMA flood zone
- X (unshaded)
- Chance of flooding over 30 yrs
- 0.0%
- Est. flood insurance / yr
- $507 – $1,088
Fire risk 1/10 · Minimal
- Est. fire insurance / yr
- $784 – $1,456
Heat risk 3/10 · Minor
- Hot days now (above 97°F)
- 7 days/yr
- Hot days in 30 yrs
- 14 days/yr
Wind risk 2/10 · Minimal
- Chance of severe wind over 30 yrs
- —
Air-quality risk 4/10 · Minor
- Unhealthy air days now
- 3 days/yr
- Unhealthy air days in 30 yrs
- 6 days/yr
Risk factors via First Street. Map © Google.
Why this score? — see what drove the C+ grade
The composite is a weighted blend of 9 inputs, each scored 0–100. Each bar is that input's sub-score; the figure is the points it added to the 100-point composite (weight × sub-score).
- Cash flow +21.9/30.0
- ARV discount +15.0/15.0
- DSCR +7.0/10.0
- 1% rule +5.6/10.0
- Livability +4.5/5.0
- Rent growth +4.1/5.0
- Schools +2.5/10.0
- Condition / age +2.5/5.0
- Appreciation +0.0/10.0
$224,900
🖨 Deal sheet (PDF) 📄 Offer letter ✓ Due diligence
Listing remarks MLS
Beautiful and spacious home awaiting your arrival! This home sits on a double lot with plenty of room to call your own. Updated kitchen and a full first and second floor bath. Formal dining room. Two driveways for your convenience. Finished basement contains recreation room and plumbing for a potential half bathroom. Move-in condition! BATVAD
Key facts
- Two driveways
- Formal dining room
- Recreation room
Tags
Property features AI
Finance
- Other: Subdivision: DETROYAL PARK; Directions: West of Livernois, south of Eight Mile; cross streets Mitchelldale and Eight Mile
Exterior
- Parking: No garage
- Utilities: Public water; Public sewer
- Home design: Single family residence; Two levels; Ground-level entry
- Construction: Aluminum and vinyl siding; Block foundation; Asphalt roof; Built area above grade 1,165 (sq ft); Finished area below grade 600 (sq ft)
- Exterior features: Front porch; Paved road access
Interior
- Kitchen: Free‑standing gas range; Free‑standing refrigerator
- Bedrooms: 5 total rooms (includes living spaces and bedrooms)
- Bathrooms: 2 full bathrooms
- Heating & cooling: Forced air heating (natural gas); No central cooling
- Interior features: Finished basement; Gas water heater
- Laundry & utility: Washer included
Neighborhood map
What this means for you Summary
Snapshot
- This is a 3-bed/2.0-bath single-family listed at $225k.
Deal economics
- At list price, monthly cash flow is $352 ($4k/yr) — positive.
- The deal already cash-flows at list — no discount required.
- Meets the 1% rule at list price ($2k rent vs $225k).
- Recommended offer: $218k (3.0% below list) — sets the bar for market timing.
- Cap rate 8.2% vs local median 4.5% in Ferndale — top-decile yield for the area; either an underpriced asset or a hidden risk that comps aren't pricing in. Stress-test before assuming the spread holds.
Location & tenants
- Location reads 90/100 on livability (#8 in MI, #103 nationally) — a professional / high-income tenant draw. Strengths: amenities A+, commute A+, employment A+.
- Ferndale Public Schools (suburban): math 18% / reading 39% proficiency, ranked #366 of 540 in MI (top 68%) — low school quality limits family demand, transient renter base, plan for 1-2y turnover.
- Zoned schools: Ferndale Lower Elementary Campus (476 students, 53% FRL); Ferndale Middle School (math 13% / reading 35%, grade F, #396 of 493 statewide, top 81%, 540 students, 62% FRL); Ferndale High School (math 32% / reading 57%, grade F, #214 of 713 statewide, top 36%, 712 students, 58% FRL).
- Market conditions: Rents rising fast (+6.2%/yr); 179 active listings in the ZIP; 4 comparable units currently listed for rent nearby; rentals at typical pace (median 20d on market — plan ~3-4 weeks tenant-placement turnaround); solid renter incomes; 2,614 units permitted in Oakland County in 2024 (721 in 5+ unit buildings).
- This rent runs 32% of the median local income ($90k/yr) — at the standard rent-burdened threshold; future hikes will face affordability resistance.
Forward outlook
- Local home prices are declining (-3.0%/yr); year-one equity from $2k of loan paydown is wiped out by about $7k of value loss. Plan a longer hold.
- Oakland County population projected at +10% by 2050 — modest demand growth; plan on rents tracking national, not racing it.
- At projected returns (-3.0% appreciation + 6.2% rent growth), your $63k cash investment doubles in ~10 years — after that, you're playing with house money.
Negotiation context
- It's been on market 35 days — a 3% lower offer ($218k) is reasonable based on typical stale-listing flexibility.
- 6 sale attempts since 23y ago with the ask held roughly flat each time — persistent listings suggest the price (not the market) is what's stuck; bring a comps-based counter.
Risks & watch-outs
- Watch-outs: built in 1936 — expect roof / HVAC / electrical / plumbing capex.
Questions for the listing agent
- It's been on market 35 days. Have you received any prior offers? Is the seller open to a 3% concession, seller financing, or rate buy-down credit?
- Built in 1936 — when were the roof, HVAC, electrical panel, plumbing, and water heater last replaced?
- Is there a deadline driving the sale (1031 exchange, divorce, estate, relocation)? That informs how much negotiation room exists.
- Schools are D-rated, which usually means shorter tenancies and higher turnover. Who's the typical renter profile here, and what's been the actual vacancy rate?
- What's the average days-on-market for RENTAL listings here right now (not sales)? A rising rental-DOM trend means longer vacancies and softer asking-rent achievability than the comps imply.
- What's the recent tenant-quality profile in this submarket — average credit score on applications, eviction rate, late-payment / NSF rate, and stable-employment percentage? A property-management company in the area should have these aggregated.
- How much new for-sale + rental construction is in the pipeline within 1–3 miles? Heavy new supply typically softens prices + rents 12–24 months out; constrained supply supports both.
Investment metrics
- 1% rule
- 1.06% ✓
- Cap rate
- 8.17%
- Cash-on-cash
- 6.71%
- DSCR
- 1.30
- GRM
- 7.9
CMA / ARV
- ARV (median comp)
- $296,520
- List price
- $224,900
- Delta
- -24.15%
- Verdict
- UNDERPRICED
- Comps
- 20 within 1.0 mi
Show comp detail 12 sales within ~0.75 mi
| Address | Dist | Beds/Ba | Sqft | Sold | Price | $/sf | Match |
|---|---|---|---|---|---|---|---|
| 21356 Ithaca Ave | 0.49mi | 3/1.5 | 2,052 (-0%) | 1mo | $222,000 | $108 | 73 |
| 20504 Cherrylawn St | 0.42mi | 3/2.0 | 2,150 (+4%) | 5mo | $125,000 | $58 | 69 |
| 1586 W Troy St | 0.60mi | 3/2.0 | 2,043 (-1%) | 4mo | $370,000 | $181 | 67 |
| 1677 Pearson St | 0.36mi | 3/2.0 | 1,815 (-12%) | 0mo | $295,000 | $163 | 63 |
| 1060 W Hazelhurst St | 0.48mi | 3/2.0 | 1,874 (-9%) | 2mo | $366,000 | $195 | 61 |
| 923 Gardendale St | 0.72mi | 3/2.0 | 1,992 (-3%) | 0mo | $375,000 | $188 | 60 |
| 10358 Cloverdale Ave | 0.62mi | 3/1.5 | 2,136 (+4%) | 5mo | $220,000 | $103 | 59 |
| 21040 Woodside Ave | 0.38mi | 3/1.0 | 1,858 (-10%) | 4mo | $145,000 | $78 | 58 |
| 21025 Glen Lodge Rd | 0.37mi | 3/2.0 | 1,774 (-14%) | 2mo | $201,500 | $114 | 58 |
| 20121 Woodingham Dr | 0.64mi | 4/3.0 (+1) | 2,105 (+2%) | 2mo | $300,000 | $143 | 56 |
| 860 Gardendale St | 0.73mi | 4/2.0 (+1) | 2,216 (+7%) | 4mo | $399,900 | $180 | 45 |
| 23031 Republic Ave | 0.72mi | 4/2.0 (+1) | 2,281 (+11%) | 1mo | $270,000 | $118 | 43 |
Match score weights: distance 35% · size 25% · config 20% · recency 20%. Top-matched comps best support the ARV.
Projected returns pro-forma
-3.0% appreciation · 6.24% rent growth · sell at horizon
- IRR
- -2.4%
- Equity multiple
- 0.90×
- Total profit
- $-6,004
- Equity at exit
- $33,533
- IRR
- 10.5%
- Equity multiple
- 1.93×
- Total profit
- $58,796
- Equity at exit
- $19,445
Cash invested: $62,972 (down + closing). Projections, not guarantees.
Landlord ↔ Tenant lean methodology
- Overall (STATE)
- 62 Landlord-Friendly
- State Michigan
- 62 Landlord-Friendly · EVEN
- County
- — inherits STATE
- City
- — inherits STATE
ZIP-level market 48220
- Rents YoY
- 6.2%
- Active inventory
- 179
- Price-to-rent
- 7.9×
Monthly cashflow live
- Estimated rent
- $2,376 medium interval (Pro) →
- Mortgage (P&I)
- −$1,179
- Tax from tax record
- −$252 /mo · $3,021/yr
- Insurance
- −$94
- HOA
- −$0
- Vacancy / Maint / Mgmt
- −$499
- Net cashflow
- $352
Break-even live
Sensitivity live
| Price | -10% $479 | -5% $416 | +0% $352 | +5% $288 | +10% $225 |
|---|---|---|---|---|---|
| Rent | -10% $164 | -5% $258 | +0% $352 | +5% $446 | +10% $540 |
| Rate | -1.0pp $465 | -0.5pp $409 | base $352 | +0.5pp $294 | +1.0pp $235 |
UW: 25.0% down · 7.5% · 30yr · 1.5% tax · 5.0% vac · 8.0% maint · 8.0% mgmt
Financing live
Cash to close
- Down payment
- $56,225
- Closing costs
- $6,747
- Reserves months
- —
- Total cash needed
- —
Loan-product check · same deal, 3 products live
Conventional
25% down · 7.5% · 30yr
- Down + closing
- —
- Monthly P&I
- —
- Monthly cashflow
- —
- DSCR
- —
- Eligible?
- —
Personal DTI + credit; lowest rate.
DSCR
20% down · 8.5% · 30yr
- Down + closing
- —
- Monthly P&I
- —
- Monthly cashflow
- —
- DSCR
- —
- Eligible?
- —
No personal income docs; deal must DSCR.
Hard money
10% down · 12.0% · 12mo
- Down + closing
- —
- Monthly P&I
- —
- Monthly cashflow
- —
- DSCR
- —
- Eligible?
- —
Short-term bridge; refi at stabilization.
Rent comps 4 comps
| Address | Beds | Baths | Sqft | Rent | $/sqft | DOM | Units | Dist |
|---|---|---|---|---|---|---|---|---|
| 695 Livernois St Unit 1 Ferndale, MI | 2.0 | 2.0 | 1500 | $2,750 | $1.83 | 14d | 1 | 0.52mi |
| 351 Edgewood Pl Unit 2 Ferndale, MI | 3.0 | 2.0 | 1600 | $2,200 | $1.38 | 19d | 1 | 1.08mi |
| 320 E Troy St Ferndale, MI | 4.0 | 2.0 | 1627 | $2,200 | $1.35 | 45d | 1 | 1.29mi |
| 2554 Woodstock Dr Highland Park, MI | 3.0 | 1.5 | 1929 | $2,250 | $1.17 | 16d | 1 | 1.30mi |
Listing history 16 events
-
2026-05-12historical Accepting Backup Offers 344-char remark
Show marketing remark (344 chars)
Beautiful and spacious home awaiting your arrival! This home sits on a double lot with plenty of room to call your own. Updated kitchen and a full first and second floor bath. Formal dining room. Two driveways for your convenience. Finished basement contains recreation room and plumbing for a potential half bathroom. Move-in condition! BATVAD
-
2026-05-12historical Active Under Contract 344-char remark
Show marketing remark (344 chars)
Beautiful and spacious home awaiting your arrival! This home sits on a double lot with plenty of room to call your own. Updated kitchen and a full first and second floor bath. Formal dining room. Two driveways for your convenience. Finished basement contains recreation room and plumbing for a potential half bathroom. Move-in condition! BATVAD
-
2026-04-23$224,900 Active 344-char remark
Show marketing remark (344 chars)
Beautiful and spacious home awaiting your arrival! This home sits on a double lot with plenty of room to call your own. Updated kitchen and a full first and second floor bath. Formal dining room. Two driveways for your convenience. Finished basement contains recreation room and plumbing for a potential half bathroom. Move-in condition! BATVAD
-
2005-12-12soldstatus $89,000
Show marketing remark (142 chars)
Home with many bedrooms and 2 lots (note 2 property Id numbers - 2533378019 & 253378020) Needs some interior updates but very nice home.
-
2005-12-12soldstatus $89,000
Show marketing remark (142 chars)
Home with many bedrooms and 2 lots (note 2 property Id numbers - 2533378019 & 253378020) Needs some interior updates but very nice home.
-
2005-12-09soldstatus $89,000
-
2005-11-23historical
-
2005-09-27$89,900
Show marketing remark (142 chars)
Home with many bedrooms and 2 lots (note 2 property Id numbers - 2533378019 & 253378020) Needs some interior updates but very nice home.
-
2005-09-27$89,900
Show marketing remark (142 chars)
Home with many bedrooms and 2 lots (note 2 property Id numbers - 2533378019 & 253378020) Needs some interior updates but very nice home.
-
2004-12-21soldstatus $152,990
-
2004-05-23historical
-
2004-02-23$174,000
-
2003-06-02soldstatus $160,000
-
2003-04-21historical
-
2003-02-27$159,900
ⓘ Source: listings_history table (triggers on properties + properties_extension) + one-shot
backfill from property_details.listing_events for pre-trigger history.
Tax reassessment forecast MI · Partial reset (capped growth)
- Current annual tax
- $3,021 · $252/mo
- Projected year-2 tax
- $3,242 · $270/mo
- Expected delta
- +$221/yr (+$18/mo · 7.3%)
ⓘ Screening estimate from a state-policy table — verify with the county assessor before closing.
Climate risk First Street
- Flood 1/10 Low FEMA zone X (unshaded) · 0% chance over 30 yrs
- Wildfire 1/10 Low
- Heat 3/10 Moderate 7 d/yr ≥97°F today · 14 d/yr by 30 yrs out
- Wind 2/10 Low
- Air quality 4/10 Moderate 3 unhealthy d/yr today · 6 by 30 yrs out
Nearby sold comps map
Loading sold comps map…
Walkable amenities ~0.75 mi
Loading nearby amenities…
Taxation est. · year 1
- Rental income
- $28,511
- − Mortgage interest
- −$12,598
- − Property taxes
- −$3,021
- − Insurance
- −$1,124
- − Repairs & maintenance
- −$2,281
- − Management
- −$2,281
- − Depreciation
- −$6,543
- Taxable income
- $663
- Est. tax owed @ 24.0%
- −$159
- After-tax cash flow
- $4,066/yr
For passive investors: Depreciation is non-cash, so a rental often shows a tax loss while cash-flowing — sheltering income. Rental losses are passive: they offset passive income freely, and up to $25,000/yr can offset ordinary (W-2) income if you actively participate and your MAGI is under $100k (phasing out to $0 by $150k); unused losses carry forward. On sale, claimed depreciation is recaptured at up to 25%, and gains may owe capital-gains tax (a 1031 exchange can defer both). Figures are a year-1 estimate at your 24.0% rate — not tax advice; consult a CPA.
Schools (NCES district)
- District
- Ferndale Public Schools
- NCES district ID
- 2614280
- Math proficiency
- 18% ▼ -3.00%
- Reading proficiency
- 39% ▲ 5.00%
- Median HH income
- $56,069
- Composite
- 25.46/100
- National rank
- #7449
- State rank
- #366 of 540 in MI
Livability — Ferndale
- Score
- 90/100
- State rank
- #8
- US rank
- #103
Category grades
Schools grade is shown separately in the Schools card above.
Census & demographics
- County
- Oakland County · 1,009,092 people
- City population
- 21,527
- Metro
- Detroit-Warren-Dearborn, MI
- Population (ZIP)
- 21,527
- Household income
- $89,881
- Rent vs Own
- Severe rent burden
- 670.0
Population outlook (Oakland County) Hauer SSP2
- Today (2025)
- 1,335,747 people
- By 2030
- 1,375,100 · +2.9%
- By 2040
- 1,435,385 · +7.5%
- By 2050
- 1,469,250 · +10.0%
- By 2075
- 1,531,946 · +14.7%
- By 2100
- 1,450,485 · +8.6%
Race, ethnicity, and origin ACS 2023
- Neighborhood character
- Predominantly White (72%)
- Race & ethnicity
- White 72% Black 15% Two or more races 6% Hispanic / Latino 5% Asian 3%
- Common ancestry
- Romanian 11% Lithuanian 6% Slovak 3%
- Foreign-born
- 4% · Canada, South Korea
- Languages at home
- 95% English-only · Spanish 2% Other Indo-European 1% German/W. Germanic 1%
Political lean MEDSL · Oakland
- 2024 margin
- D (+10.6) · D 54.4% · R 43.8% · Other 1.9%
- 2008→2024 swing
- -3.9pp toward R · 2008: 14.5pp · 2024: 10.6pp
- All cycles
- 2024: D+10.6 2020: D+14.1 2016: D+8.1 2012: D+8.1 2008: D+14.5
Not yet ingested
- Civics
- —
Market trends
- HPI YoY
- ▼ -394.92%
- Current HPI
- 273.0986
- Rent YoY
- ▲ 6.24%
- Metro
- Detroit-Warren-Dearborn, MI
- State GDP YoY
- ▲ 1.37%
- F500 in state
- 28
Industry mix (Fortune 500 HQ in MI)
| Industry | F500 HQs | Revenue |
|---|---|---|
| Automotive Parts | 3 | $48B |
|
||
| Automotive | 2 | $372B |
|
||
| Chemicals | 1 | $45B |
|
||
| Automotive Retail | 1 | $29B |
|
||
| Healthcare / Medical Devices | 1 | $23B |
|
||
| Automotive Technology | 1 | $20B |
|
||
Price history
+32.6% since first listed20 events — show timeline
- 2026-06-02 Sold (MLS) $212,000 MiRealSource-MiMLS
- 2026-06-02 Sold (MLS) $212,000 REALCOMP
- 2026-05-28 Pending — MiRealSource-MiMLS
- 2026-05-28 Pending — REALCOMP
- 2026-05-12 Contingent — MiRealSource-MiMLS
- 2026-05-12 Contingent — REALCOMP
- 2026-04-23 Listed $224,900 REALCOMP
- 2026-04-23 Listed $224,900 MiRealSource-MiMLS
- 2005-12-12 Sold (MLS) $89,000 MiRealSource-MiMLS
- 2005-12-12 Sold (MLS) $89,000 REALCOMP
- 2005-12-09 Sold (Public Records) $89,000 Public Records
- 2005-11-23 Listing Removed — MiRealSource-MiMLS
- 2005-09-27 Listed $89,900 MiRealSource-MiMLS
- 2005-09-27 Listed $89,900 REALCOMP
- 2004-12-21 Sold (Public Records) $152,990 Public Records
- 2004-05-23 Listing Removed — REALCOMP
- 2004-02-23 Listed $174,000 REALCOMP
- 2003-06-02 Sold (MLS) $160,000 MiRealSource-MiMLS
- 2003-04-21 Listing Removed — MiRealSource-MiMLS
- 2003-02-27 Listed $159,900 MiRealSource-MiMLS
Property tax history
+4.1%/yrLatest (2025): $3,021 · +95.0% YoY. Source: county tax records.
Cash-flow waterfall
monthlySold comps — $/sqft
last 12 mo · ≤1 miLoading sold comps…