 Multi-family
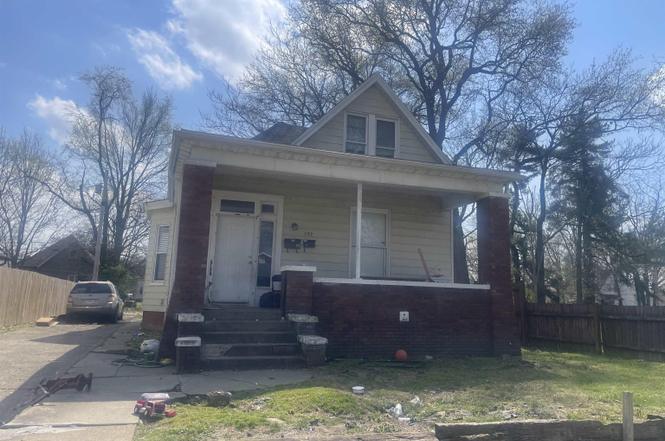
709 E Powell Ave · Evansville, IN
Flood risk 1/10 · Minimal
- FEMA flood zone
- X (unshaded)
- Chance of flooding over 30 yrs
- 0.0%
- Est. flood insurance / yr
- $473 – $860
Fire risk 1/10 · Minimal
- Est. fire insurance / yr
- $717 – $1,331
Heat risk 5/10 · Moderate
- Hot days now (above 107°F)
- 7 days/yr
- Hot days in 30 yrs
- 18 days/yr
Wind risk 2/10 · Minimal
- Chance of severe wind over 30 yrs
- 3.0%
Air-quality risk 4/10 · Minor
- Unhealthy air days now
- 3 days/yr
- Unhealthy air days in 30 yrs
- 5 days/yr
Risk factors via First Street. Map © Google.
Why this score? — see what drove the B- grade
The composite is a weighted blend of 9 inputs, each scored 0–100. Each bar is that input's sub-score; the figure is the points it added to the 100-point composite (weight × sub-score).
- Cash flow +30.0/30.0
- DSCR +10.0/10.0
- 1% rule +7.9/10.0
- ARV discount +7.5/15.0
- Rent growth +5.0/5.0
- Schools +3.3/10.0
- Livability +3.2/5.0
- Condition / age +2.5/5.0
- Appreciation +0.0/10.0
$119,000
🖨 Deal sheet 📄 Offer letter ✓ Due diligence
Multi-family units
County records classify this as Multi-Family (2-4 Unit). Listing-text estimate: 1 unit. estimate disagrees with records
Listing remarks MLS
Investment Opportunity! Fully occupied duplex with total rents at $1450/month with tenants paying all utilities.
Key facts
- 6,500 sq ft lot
- Built 1919
- Listed 277 days
Property features AI
Finance
- Other: Property listed as Residential; About 2,699 above-grade finished area
Exterior
- Utilities: Public water; Public sewer
- Home design: Single-family residence; Site-built home; One story
- Construction: Aluminum and vinyl siding; Block foundation
- Exterior features: Level lot; Lot dimensions approximately 50 x 130
Interior
- Bathrooms: 2 full bathrooms; 1 main-level bathroom
- Heating & cooling: Forced air heating; Central air conditioning
- Interior features: Unfinished basement; Total of 8 rooms
- Laundry & utility: Laundry in basement
Neighborhood map
What this means for you Summary
Snapshot
- This is a 5-bed/2.0-bath multifamily listed at $119k.
Deal economics
- At list price, monthly cash flow is $451 ($5k/yr) — positive.
- The deal already cash-flows at list — no discount required.
- Meets the 1% rule at list price ($2k rent vs $119k).
- Recommended offer: $105k (12.0% below list) — sets the bar for market timing.
- Cap rate 10.8% vs local median 4.6% in Evansville — top-decile yield for the area; either an underpriced asset or a hidden risk that comps aren't pricing in. Stress-test before assuming the spread holds.
Location & tenants
- Location reads 63/100 on livability (#416 in IN) — a middle-class / working-renter tenant base. Strengths: cost of living A+, housing A+, health & safety A+; Watch: crime F, commute F, employment D-.
- Evansville Vanderburgh School Corporation (urban): math 36% / reading 43% proficiency, ranked #153 of 301 in IN (top 51%) — families likely to look elsewhere, expect single-tenant / working-renter base with shorter leases.
- Zoned schools: Lodge Community School (math 11% / reading 19%, grade F, #859 of 994 statewide, top 87%, 382 students, 85% FRL) — zoned schools average 85% FRL vs 50% district-wide (35 pts higher); higher-poverty schools than district average — tighter screening recommended.
- Zoned-school proficiency averages 15% at this address vs 40% district-wide (-24 pts) — the specific schools serving this property underperform the Evansville Vanderburgh School Corporation average; the district grade overstates school quality for this exact location.
- Market conditions: Rents rising fast (+9.9%/yr); 118 active listings in the ZIP; 2 comparable units currently listed for rent nearby; lower-income renter base — watch delinquency; 508 units permitted in Vanderburgh County in 2024 (32 in 5+ unit buildings).
- At $1,537/mo this rent would consume 45% of the median local household income ($41k/yr) (locally 735% of renters already pay >50% of income on rent) — very limited rent-growth headroom before tenants either downsize or default.
Forward outlook
- Local home prices are declining (-3.0%/yr); year-one equity from $823 of loan paydown is wiped out by about $4k of value loss. Plan a longer hold.
- At projected returns (-3.0% appreciation + 8.0% rent growth), your $33k cash investment doubles in ~6 years — after that, you're playing with house money.
Negotiation context
- It's been on market 277 days — a 12% lower offer ($105k) is reasonable based on typical stale-listing flexibility.
- 4 sale attempts; this cycle's ask is 112% above the opening price — seller raised mid-cycle; expect resistance to lowballs.
Risks & watch-outs
- Watch-outs: built in 1919 — expect roof / HVAC / electrical / plumbing capex.
- Climate carrying-cost: extreme-heat days projected 7→18/yr by 2055 (HVAC capex compounding) — expect insurance premiums to compound above CPI over the hold.
Questions for the listing agent
- It's been on market 277 days. Have you received any prior offers? Is the seller open to a 12% concession, seller financing, or rate buy-down credit?
- Built in 1919 — when were the roof, HVAC, electrical panel, plumbing, and water heater last replaced?
- Why hasn't it sold? Are there any deal-killer items the seller is aware of (foundation, flood, title, zoning, code violations)?
- Is there a deadline driving the sale (1031 exchange, divorce, estate, relocation)? That informs how much negotiation room exists.
- Schools are D-rated, which usually means shorter tenancies and higher turnover. Who's the typical renter profile here, and what's been the actual vacancy rate?
- Crime grade is F in this area — have there been break-ins, vandalism, or insurance claims at this property in the last 3 years? What carrier currently insures it and at what premium?
- What's the average days-on-market for RENTAL listings here right now (not sales)? A rising rental-DOM trend means longer vacancies and softer asking-rent achievability than the comps imply.
- What's the recent tenant-quality profile in this submarket — average credit score on applications, eviction rate, late-payment / NSF rate, and stable-employment percentage? A property-management company in the area should have these aggregated.
- How much new apartment / multifamily construction is in the pipeline within 1–3 miles? Heavy new supply (>2% of stock underway) typically softens rents 12–24 months out; light construction supports rent growth.
Investment metrics
- 1% rule
- 1.29% ✓
- Cap rate
- 10.85%
- Cash-on-cash
- 16.26%
- DSCR
- 1.72
- GRM
- 6.5
CMA / ARV
- ARV (on-the-fly)
- $75,572
- Comps found
- 7
Show comp detail 7 sales within ~0.75 mi
| Address | Dist | Beds/Ba | Sqft | Sold | Price | $/sf | Match |
|---|---|---|---|---|---|---|---|
| 1105 S Linwood Ave | 0.19mi | 5/2.0 | 2,755 (+2%) | 7mo | $75,000 | $27 | 81 |
| 1015 S Linwood Ave | 0.16mi | 4/1.5 (-1) | 2,639 (-2%) | 13mo | $51,666 | $20 | 71 |
| 913 Washington St | 0.31mi | 4/2.0 (-1) | 2,630 (-3%) | 7mo | $60,000 | $23 | 70 |
| 423 Jefferson Ave | 0.32mi | 5/2.0 | 2,437 (-10%) | 6mo | $160,000 | $66 | 64 |
| 205-207 Blackford Ave | 0.68mi | 4/2.0 (-1) | 2,717 (+1%) | 3mo | $322,000 | $119 | 59 |
| 516 S Bedford Ave | 0.51mi | 4/2.0 (-1) | 2,578 (-4%) | 7mo | $71,000 | $28 | 58 |
| 401 403 Adams Ave | 0.32mi | 5/3.0 | 2,372 (-12%) | 14mo | $225,000 | $95 | 49 |
Match score weights: distance 35% · size 25% · config 20% · recency 20%. Top-matched comps best support the ARV.
Projected returns pro-forma
-3.0% appreciation · 8.0% rent growth · sell at horizon
- IRR
- 12.5%
- Equity multiple
- 1.53×
- Total profit
- $17,576
- Equity at exit
- $17,743
- IRR
- 25.0%
- Equity multiple
- 3.68×
- Total profit
- $89,233
- Equity at exit
- $10,289
Cash invested: $33,320 (down + closing). Projections, not guarantees.
Landlord ↔ Tenant lean methodology
- Overall (STATE)
- 90 Strongly Landlord-Friendly
- State Indiana
- 90 Strongly Landlord-Friendly · R+11
- County
- — inherits STATE
- City
- — inherits STATE
ZIP-level market 47713
- Home prices YoY
- -34.1%
- Rents YoY
- 9.9%
- Active inventory
- 118
- Price-to-rent
- 6.5×
Monthly cashflow live
- Estimated rent
- $1,537 medium interval (Pro) →
- Mortgage (P&I)
- −$624
- Tax from tax record
- −$89 /mo · $1,066/yr
- Insurance
- −$50
- HOA
- −$0
- Vacancy / Maint / Mgmt
- −$323
- Net cashflow
- $451
Break-even live
UW: 25.0% down · 7.5% · 30yr · 1.5% tax · 5.0% vac · 8.0% maint · 8.0% mgmt
Financing live
Cash to close
- Down payment
- $29,750
- Closing costs
- $3,570
- Reserves months
- —
- Total cash needed
- —
Loan-product check · same deal, 3 products live
Conventional
25% down · 7.5% · 30yr
- Down + closing
- —
- Monthly P&I
- —
- Monthly cashflow
- —
- DSCR
- —
- Eligible?
- —
Personal DTI + credit; lowest rate.
DSCR
20% down · 8.5% · 30yr
- Down + closing
- —
- Monthly P&I
- —
- Monthly cashflow
- —
- DSCR
- —
- Eligible?
- —
No personal income docs; deal must DSCR.
Hard money
10% down · 12.0% · 12mo
- Down + closing
- —
- Monthly P&I
- —
- Monthly cashflow
- —
- DSCR
- —
- Eligible?
- —
Short-term bridge; refi at stabilization.
Rent comps 2 comps
| Address | Beds | Baths | Sqft | Rent | $/sqft | DOM | Units | Dist |
|---|---|---|---|---|---|---|---|---|
| 1213 Washington Ave Evansville, IN | 4.0 | 1.0 | 1984 | $1,595 | $0.80 | 21d | 1 | 0.71mi |
| 27 W Franklin St Evansville, IN | 4.0 | 2.5 | 2500 | $1,100 | $0.44 | 21d | 1 | 1.19mi |
Listing history 22 events
-
2026-06-18days on market $119,000 Active 277 DOM
-
2026-06-17days on market $119,000 Active 276 DOM
-
2026-06-16days on market $119,000 Active 275 DOM
-
2026-06-15days on market $119,000 Active 274 DOM
-
2026-06-14days on market $119,000 Active 272 DOM
-
2026-06-13days on market $119,000 Active 271 DOM
-
2026-06-10days on market $119,000 Active 269 DOM
-
2026-06-09days on market $119,000 Active 268 DOM
-
2026-06-08days on market $119,000 Active 267 DOM
-
2026-06-07days on market $119,000 Active 266 DOM
-
2026-06-02days on market $119,000 Active 261 DOM
-
2026-06-01days on market $119,000 Active 260 DOM
-
2026-05-31days on market $119,000 Active 259 DOM
-
2026-05-30days on market $119,000 Active 258 DOM
-
2026-04-03price $119,000 112-char remark
Show marketing remark (112 chars)
Investment Opportunity! Fully occupied duplex with total rents at $1450/month with tenants paying all utilities.
-
2026-04-03price $119,000
Show marketing remark (112 chars)
Investment Opportunity! Fully occupied duplex with total rents at $1450/month with tenants paying all utilities.
-
2026-03-16status Active 112-char remark
Show marketing remark (112 chars)
Investment Opportunity! Fully occupied duplex with total rents at $1450/month with tenants paying all utilities.
-
2026-03-16status Active
Show marketing remark (112 chars)
Investment Opportunity! Fully occupied duplex with total rents at $1450/month with tenants paying all utilities.
-
2025-09-19price $135,000
Show marketing remark (112 chars)
Investment Opportunity! Fully occupied duplex with total rents at $1450/month with tenants paying all utilities.
-
2025-09-19price $135,000 112-char remark
Show marketing remark (112 chars)
Investment Opportunity! Fully occupied duplex with total rents at $1450/month with tenants paying all utilities.
-
2025-08-29$56,250 Active 112-char remark
Show marketing remark (112 chars)
Investment Opportunity! Fully occupied duplex with total rents at $1450/month with tenants paying all utilities.
-
2025-08-29$56,250 Active
Show marketing remark (112 chars)
Investment Opportunity! Fully occupied duplex with total rents at $1450/month with tenants paying all utilities.
ⓘ Source: listings_history table (triggers on properties + properties_extension) + one-shot
backfill from property_details.listing_events for pre-trigger history.
Tax reassessment forecast IN · Partial reset (capped growth)
- Current annual tax
- $1,066 · $89/mo
- Projected year-2 tax
- $1,066 · $89/mo
- Expected delta
- $0/yr ($0/mo · 0.0%)
ⓘ Screening estimate from a state-policy table — verify with the county assessor before closing.
Climate risk First Street
- Flood 1/10 Low FEMA zone X (unshaded) · 0% chance over 30 yrs
- Wildfire 1/10 Low
- Heat 5/10 Major 7 d/yr ≥107°F today · 18 d/yr by 30 yrs out
- Wind 2/10 Low 3% chance of damaging wind over 30 yrs
- Air quality 4/10 Moderate 3 unhealthy d/yr today · 5 by 30 yrs out
Nearby sold comps map
Loading sold comps map…
Walkable amenities ~0.75 mi
Loading nearby amenities…
Taxation est. · year 1
- Rental income
- $18,439
- − Mortgage interest
- −$6,666
- − Property taxes
- −$1,066
- − Insurance
- −$595
- − Repairs & maintenance
- −$1,475
- − Management
- −$1,475
- − Depreciation
- −$3,462
- Taxable income
- $3,700
- Est. tax owed @ 24.0%
- −$888
- After-tax cash flow
- $4,529/yr
For passive investors: Depreciation is non-cash, so a rental often shows a tax loss while cash-flowing — sheltering income. Rental losses are passive: they offset passive income freely, and up to $25,000/yr can offset ordinary (W-2) income if you actively participate and your MAGI is under $100k (phasing out to $0 by $150k); unused losses carry forward. On sale, claimed depreciation is recaptured at up to 25%, and gains may owe capital-gains tax (a 1031 exchange can defer both). Figures are a year-1 estimate at your 24.0% rate — not tax advice; consult a CPA.
Schools (NCES district)
- District
- Evansville Vanderburgh School Corporation
- NCES district ID
- 1803450
- Math proficiency
- 36% ▼ -7.00%
- Reading proficiency
- 43% ▼ -3.00%
- Median HH income
- $43,270
- Composite
- 33.41/100
- National rank
- #5471
- State rank
- #153 of 301 in IN
Livability — Evansville
- Score
- 63/100
- State rank
- #416
- US rank
- #15047
Category grades
Schools grade is shown separately in the Schools card above.
Census & demographics
- Census place
- Evansville, IN
- County
- Vanderburgh County · 146,793 people
- City population
- 146,793
- Metro
- Evansville, IN-KY
- Population (ZIP)
- 9,988
- Household income
- $40,873
- Rent vs Own
- Severe rent burden
- 735.0
Population outlook (Vanderburgh County) Hauer SSP2
- Today (2025)
- 187,038 people
- By 2030
- 188,907 · +1.0%
- By 2040
- 190,272 · +1.7%
- By 2050
- 188,871 · +1.0%
- By 2075
- 180,751 · -3.4%
- By 2100
- 163,015 · -12.8%
Race, ethnicity, and origin ACS 2023
- Neighborhood character
- Diverse neighborhood (Simpson 0.60)
- Race & ethnicity
- White 50% Black 39% Two or more races 7% Hispanic / Latino 3% Pacific Islander 1% Asian 1%
- Common ancestry
- Romanian 2% Lithuanian 1% Italian 1%
- Foreign-born
- 5% · Canada
- Languages at home
- 96% English-only · Spanish 2% Tagalog/Filipino 1% French/Haitian/Cajun 1%
Political lean MEDSL · Vanderburgh
- 2024 margin
- R (+12.7) · D 43.0% · R 55.6% · Other 1.4%
- 2008→2024 swing
- -15.1pp toward R · 2008: 2.5pp · 2024: -12.7pp
- All cycles
- 2024: R+12.7 2020: R+9.6 2016: R+16.9 2012: R+10.8 2008: D+2.5
Not yet ingested
- Civics
- —
Market trends
- HPI YoY
- ▼ -119.22%
- Current HPI
- 229.9312
- Rent YoY
- ▲ 9.87%
- Metro
- Evansville, IN-KY
- State GDP YoY
- ▲ 2.90%
- F500 in state
- 18
Industry mix (Fortune 500 HQ in IN)
| Industry | F500 HQs | Revenue |
|---|---|---|
| Industrial Machinery | 2 | $37B |
|
||
| Healthcare | 1 | $177B |
|
||
| Pharmaceuticals | 1 | $45B |
|
||
| Metals / Steel | 1 | $18B |
|
||
| Agriculture | 1 | $17B |
|
||
| Packaging | 1 | $12B |
|
||
Price history
+111.6% since first listed8 events — show timeline
- 2026-04-03 Price Changed $119,000 IRMLS
- 2026-04-03 Price Changed $119,000 IRMLS
- 2026-03-16 Relisted — IRMLS
- 2026-03-16 Relisted — IRMLS
- 2025-09-19 Price Changed $135,000 IRMLS
- 2025-09-19 Price Changed $135,000 IRMLS
- 2025-08-29 Listed $56,250 IRMLS
- 2025-08-29 Listed $56,250 IRMLS
Property tax history
+3.4%/yrLatest (2024): $1,066 · +2.7% YoY. Source: county tax records.
Cash-flow waterfall
monthlySold comps — $/sqft
last 12 mo · ≤1 miLoading sold comps…