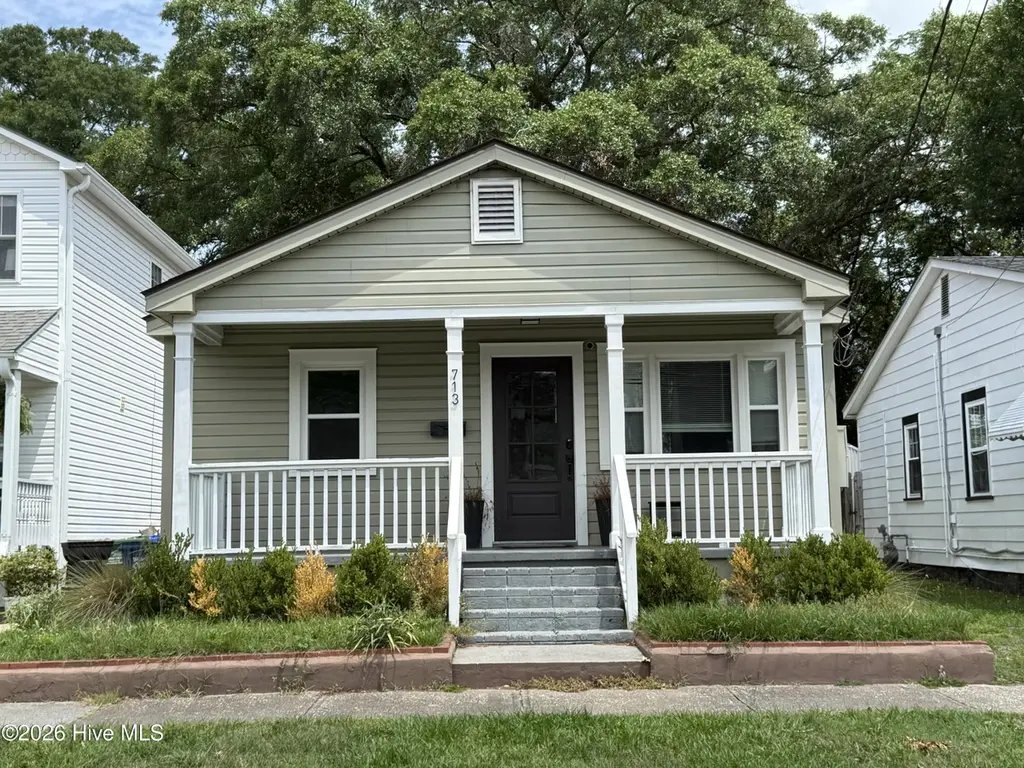
713 Ann St · Wilmington, NC
Flood risk 1/10 · Minimal
- FEMA flood zone
- X (unshaded)
- Chance of flooding over 30 yrs
- 0.0%
- Est. flood insurance / yr
- $507 – $1,088
Fire risk 4/10 · Minor
- Est. fire insurance / yr
- $906 – $1,684
Heat risk 9/10 · Severe
- Hot days now (above 105°F)
- 7 days/yr
- Hot days in 30 yrs
- 19 days/yr
Wind risk 8/10 · Major
- Chance of severe wind over 30 yrs
- 99.0%
Air-quality risk 2/10 · Minimal
- Unhealthy air days now
- 1 days/yr
- Unhealthy air days in 30 yrs
- 1 days/yr
Risk factors via First Street. Map © Google.
Why this score? — see what drove the B- grade
The composite is a weighted blend of 9 inputs, each scored 0–100. Each bar is that input's sub-score; the figure is the points it added to the 100-point composite (weight × sub-score).
- Cash flow +24.7/30.0
- ARV discount +15.0/15.0
- DSCR +8.0/10.0
- 1% rule +5.5/10.0
- Schools +4.3/10.0
- Livability +3.5/5.0
- Condition / age +2.5/5.0
- Rent growth +2.4/5.0
- Appreciation +0.0/10.0
$159,000
🖨 Deal sheet 📄 Offer letter ✓ Due diligence
Listing remarks MLS
Great deal for first time home buyer or investor. 2 bedroom, 1 bath cottage located in the heart of Wilmington. Needs some tender loving care but has great potential. Public tennis courts, pool, and playground are only a short walk away.
Key facts
- Covered porch
- Formal dining room
- One-level living
Tags
Property features AI
Exterior
- Parking: On-street parking
- Utilities: Public water; Sewer connected; Cable available; Natural gas available
- Home design: Single-family residence; One story; Entry level: 1; Vinyl siding and frame construction
- Construction: Shingle roof
- Exterior features: Rear porch; Full fenced backyard; Paved road frontage on city street and state road; Level lot
Interior
- Kitchen: Electric range; Electric water heater
- Bedrooms: Total of 5 rooms (bedrooms and living spaces counted within total rooms)
- Flooring: Carpet; Laminate; Tile; Wood
- Bathrooms: 1 full bathroom
- Heating & cooling: Electric heating; No central cooling
- Interior features: Unfurnished; Crawl space basement; Has a view
- Laundry & utility: Utilities include water and sewer connections
Neighborhood map
What this means for you Summary
Snapshot
- This is a 2-bed/1.0-bath single-family listed at $159k.
Deal economics
- At list price, monthly cash flow is $331 ($4k/yr) — positive.
- The deal already cash-flows at list — no discount required.
- Meets the 1% rule at list price ($2k rent vs $159k).
- Cap rate 8.8% vs local median 2.6% in Wilmington — top-decile yield for the area; either an underpriced asset or a hidden risk that comps aren't pricing in. Stress-test before assuming the spread holds.
Location & tenants
- Location reads 70/100 on livability (#142 in NC) — a middle-class / working-renter tenant base. Strengths: health & safety A+, cost of living B+, housing B+; Watch: amenities C-, employment C-, crime F.
- New Hanover County Schools (urban): math 48% / reading 53% proficiency, ranked #61 of 178 in NC (top 34%) — acceptable for families but not a draw, mixed tenant base, ~2y average lease.
- Zoned schools: A H Snipes Academy of Arts/Des (math 17% / reading 22%, grade F, #1,242 of 1,410 statewide, top 90%, 377 students, 99% FRL); Williston Middle (math 17% / reading 30%, grade F, #402 of 475 statewide, top 85%, 683 students, 100% FRL); New Hanover High (math 60% / reading 53%, grade C, #261 of 535 statewide, top 49%, 1,466 students, 100% FRL) — zoned schools average 100% FRL vs 42% district-wide (58 pts higher); higher-poverty schools than district average — tighter screening recommended.
- Zoned-school proficiency averages 33% at this address vs 50% district-wide (-17 pts) — the specific schools serving this property underperform the New Hanover County Schools average; the district grade overstates school quality for this exact location.
- Market conditions: Rents soft (-0.5%/yr); 279 active listings in the ZIP; 36 comparable units currently listed for rent nearby; rentals at typical pace (median 21d on market — plan ~3-4 weeks tenant-placement turnaround); 2,581 units permitted in New Hanover County in 2024 (1,185 in 5+ unit buildings).
- This rent runs 35% of the median local income ($58k/yr) — at the standard rent-burdened threshold; future hikes will face affordability resistance.
Forward outlook
- Local home prices are declining (-3.0%/yr); year-one equity from $1k of loan paydown is wiped out by about $5k of value loss. Plan a longer hold.
- New Hanover County population projected at +37% by 2050 — long-run rental-demand tailwind backs the buy-and-hold thesis.
Negotiation context
- Only 5 days on market — expect competitive offers; lowballing is unlikely to land.
- 3 sale attempts since 15y ago with the ask held roughly flat each time — persistent listings suggest the price (not the market) is what's stuck; bring a comps-based counter.
- Current owner paid $130k; 22% above their basis — modest negotiation headroom, anchor on the comps not their cost.
Risks & watch-outs
- Watch-outs: built in 1955 — expect roof / HVAC / electrical / plumbing capex.
- Climate carrying-cost: severe wind risk, 99% chance of damaging wind over 30y; extreme-heat days projected 7→19/yr by 2055 (HVAC capex compounding) — expect insurance premiums to compound above CPI over the hold.
Questions for the listing agent
- Built in 1955 — when were the roof, HVAC, electrical panel, plumbing, and water heater last replaced?
- Is there a deadline driving the sale (1031 exchange, divorce, estate, relocation)? That informs how much negotiation room exists.
- Crime grade is F in this area — have there been break-ins, vandalism, or insurance claims at this property in the last 3 years? What carrier currently insures it and at what premium?
- What's the average days-on-market for RENTAL listings here right now (not sales)? A rising rental-DOM trend means longer vacancies and softer asking-rent achievability than the comps imply.
- What's the recent tenant-quality profile in this submarket — average credit score on applications, eviction rate, late-payment / NSF rate, and stable-employment percentage? A property-management company in the area should have these aggregated.
- How much new for-sale + rental construction is in the pipeline within 1–3 miles? Heavy new supply typically softens prices + rents 12–24 months out; constrained supply supports both.
Investment metrics
- 1% rule
- 1.05% ✓
- Cap rate
- 8.79%
- Cash-on-cash
- 8.92%
- DSCR
- 1.40
- GRM
- 7.9
CMA / ARV
- ARV (on-the-fly)
- $238,882
- Comps found
- 12
Show comp detail 12 sales within ~0.75 mi
| Address | Dist | Beds/Ba | Sqft | Sold | Price | $/sf | Match |
|---|---|---|---|---|---|---|---|
| 514 S 6th St | 0.27mi | 2/1.0 | 792 (+0%) | 11mo | $272,000 | $343 | 78 |
| 119 S 12th St | 0.36mi | 3/1.0 (+1) | 767 (-3%) | 2mo | $171,500 | $224 | 71 |
| 221 S 11th St | 0.26mi | 2/1.0 | 703 (-11%) | 2mo | $140,000 | $199 | 67 |
| 708 Chestnut St | 0.39mi | 2/2.0 | 844 (+7%) | 2mo | $321,000 | $380 | 65 |
| 1015 Shaws Aly | 0.46mi | 2/1.0 | 825 (+4%) | 9mo | $245,000 | $297 | 64 |
| 805 S 13th St | 0.63mi | 2/1.0 | 819 (+4%) | 3mo | $247,500 | $302 | 62 |
| 1005 Queen St | 0.41mi | 1/1.0 (-1) | 828 (+5%) | 11mo | $110,000 | $133 | 59 |
| 209 Queen St | 0.54mi | 2/1.0 | 717 (-9%) | 1mo | $242,000 | $338 | 58 |
| 214 S 15th St | 0.54mi | 2/1.0 | 867 (+10%) | 4mo | $312,000 | $360 | 55 |
| 906 Rankin St | 0.62mi | 2/1.0 | 820 (+4%) | 12mo | $235,000 | $287 | 55 |
| 222 S 13th St | 0.39mi | 3/1.0 (+1) | 880 (+11%) | 10mo | $230,000 | $261 | 49 |
| 504 Peabody Aly | 0.61mi | 2/2.0 | 900 (+14%) | 4mo | $290,000 | $322 | 41 |
Match score weights: distance 35% · size 25% · config 20% · recency 20%. Top-matched comps best support the ARV.
Projected returns pro-forma
-3.0% appreciation · 0.0% rent growth · sell at horizon
- IRR
- -6.0%
- Equity multiple
- 0.78×
- Total profit
- $-9,627
- Equity at exit
- $23,707
- IRR
- -0.1%
- Equity multiple
- 0.99×
- Total profit
- $-355
- Equity at exit
- $13,747
Cash invested: $44,520 (down + closing). Projections, not guarantees.
Landlord ↔ Tenant lean methodology
- Overall (STATE)
- 85 Strongly Landlord-Friendly
- State North Carolina
- 85 Strongly Landlord-Friendly · R+3
- County
- — inherits STATE
- City
- — inherits STATE
ZIP-level market 28401
- Rents YoY
- -0.5%
- Active inventory
- 279
- Price-to-rent
- 7.9×
Monthly cashflow live
- Estimated rent
- $1,674 high interval (Pro) →
- Mortgage (P&I)
- −$834
- Tax from tax record
- −$91 /mo · $1,092/yr
- Insurance
- −$66
- HOA
- −$0
- Vacancy / Maint / Mgmt
- −$351
- Net cashflow
- $331
Break-even live
UW: 25.0% down · 7.5% · 30yr · 1.5% tax · 5.0% vac · 8.0% maint · 8.0% mgmt
Financing live
Cash to close
- Down payment
- $39,750
- Closing costs
- $4,770
- Reserves months
- —
- Total cash needed
- —
Loan-product check · same deal, 3 products live
Conventional
25% down · 7.5% · 30yr
- Down + closing
- —
- Monthly P&I
- —
- Monthly cashflow
- —
- DSCR
- —
- Eligible?
- —
Personal DTI + credit; lowest rate.
DSCR
20% down · 8.5% · 30yr
- Down + closing
- —
- Monthly P&I
- —
- Monthly cashflow
- —
- DSCR
- —
- Eligible?
- —
No personal income docs; deal must DSCR.
Hard money
10% down · 12.0% · 12mo
- Down + closing
- —
- Monthly P&I
- —
- Monthly cashflow
- —
- DSCR
- —
- Eligible?
- —
Short-term bridge; refi at stabilization.
Rent comps 36 comps
| Address | Beds | Baths | Sqft | Rent | $/sqft | DOM | Units | Dist |
|---|---|---|---|---|---|---|---|---|
| 418 S 8th St Wilmington, NC | 2.0 | 1.0 | 873 | $2,200 | $2.52 | 13d | 1 | 0.12mi |
| 919 Castle St Wilmington, NC | 2.0 | 2.0 | 688 | $1,375 | $2.00 | 21d | 1 | 0.26mi |
| 919 Castle St Wilmington, NC | 1.0 | 1.0 | 578 | $1,200 | $2.08 | 13d | 1 | 0.26mi |
| 607 S 11th St Unit 208 Wilmington, NC | 2.0 | 2.0 | 960 | $1,585 | $1.65 | 13d | 1 | 0.35mi |
| 1102 Castle St Unit 202 Wilmington, NC | 1.0 | 1.0 | 587 | $1,300 | $2.21 | 21d | 1 | 0.35mi |
| 1102 Castle St Unit 201 Wilmington, NC | 2.0 | 2.0 | 748 | $1,450 | $1.94 | 13d | 1 | 0.35mi |
| 1102 Castle St #306 Wilmington, NC | 1.0 | 1.0 | 587 | $1,325 | $2.26 | 21d | 1 | 0.35mi |
| 420 Market St Wilmington, NC | 1.0–3.0 | 1.0 | 935 | $1,425 | $1.52 | 13d | 1 | 0.36mi |
| 1108 Castle St Unit C Wilmington, NC | 1.0 | 1.0 | 625 | $1,375 | $2.20 | 21d | 1 | 0.36mi |
| 1108 Castle St #112 Wilmington, NC | 1.0 | 1.0 | 750 | $1,500 | $2.00 | 21d | 1 | 0.36mi |
| 1108 Castle St #106 Wilmington, NC | 2.0 | 2.0 | 900 | $1,625 | $1.81 | 21d | 1 | 0.36mi |
| 1124 Castle St Unit 206 Wilmington, NC | 1.0 | 1.0 | 598 | $1,350 | $2.26 | 21d | 1 | 0.37mi |
| 1124 Castle St Unit 201 Wilmington, NC | 1.0 | 1.0 | 686 | $1,475 | $2.15 | 21d | 1 | 0.37mi |
| 422 S 3rd St Wilmington, NC | 2.0 | 1.0 | 734 | $1,550 | $2.11 | 13d | 1 | 0.42mi |
| 618 S 3rd St #2 Wilmington, NC | 2.0 | 2.0 | 1000 | $1,750 | $1.75 | 21d | 1 | 0.50mi |
| 715 S 13th St Wilmington, NC | 3.0 | 2.0 | 936 | $2,300 | $2.46 | 21d | 1 | 0.55mi |
| 1704 Church St Wilmington, NC | 2.0 | 2.0 | 830 | $1,475 | $1.78 | 21d | 1 | 0.72mi |
| 1704 Church St Unit 310 Wilmington, NC | 1.0 | 1.0 | 525 | $1,250 | $2.38 | 21d | 1 | 0.72mi |
| 1704 Church St Wilmington, NC | 1.0 | 1.0 | 525 | $1,275 | $2.43 | 13d | 1 | 0.72mi |
| 14 Grace St Wilmington, NC | 1.0–2.0 | 1.0–2.0 | 1041 | $2,347 | $2.25 | 13d | 3 | 0.74mi |
| 10 Grace St #302 Wilmington, NC | 1.0 | 1.0 | 600 | $2,200 | $3.67 | 21d | 1 | 0.78mi |
| 524 N 2nd St Wilmington, NC | 2.0 | 2.0 | 1000 | $1,450 | $1.45 | 21d | 1 | 0.84mi |
| 709 N 11th St Wilmington, NC | 2.0 | 1.0 | 800 | $1,475 | $1.84 | 21d | 1 | 0.86mi |
| 1904 Perry Ave Wilmington, NC | 2.0 | 1.0 | 1017 | $2,500 | $2.46 | 21d | 1 | 0.90mi |
| 301 Martin St Wilmington, NC | 2.0 | 2.5 | 1036 | $2,400 | $2.32 | 21d | 1 | 1.00mi |
| 814 N 3rd St Wilmington, NC | 2.0 | 2.0 | 1009 | $1,692 | $1.68 | 13d | 3 | 1.00mi |
| 1400 S 2nd St Wilmington, NC | 1.0–2.0 | 1.0–2.5 | 956 | $2,533 | $2.65 | 13d | 13 | 1.05mi |
| 1519 Lake Branch Dr Wilmington, NC | 1.0–3.0 | 1.0 | 720 | $1,125 | $1.56 | 21d | 1 | 1.11mi |
| 901 Nutt St Wilmington, NC | 3.0 | 1.0–3.0 | 1112 | $4,374 | $3.93 | 13d | 24 | 1.15mi |
| 19 Harnett St Wilmington, NC | 2.0 | 1.0–2.0 | 832 | $3,709 | $4.46 | 13d | 18 | 1.23mi |
| 2247 Wrightsville Ave Wilmington, NC | 3.0 | 1.0–2.0 | 753 | $1,363 | $1.81 | 13d | 9 | 1.27mi |
| 1045 N Front St Wilmington, NC | 1.0–3.0 | 1.0–2.0 | 1107 | $2,190 | $1.98 | 13d | 19 | 1.28mi |
| 710 Taylor St Unit D Wilmington, NC | 2.0 | 2.0 | 885 | $1,395 | $1.58 | 13d | 1 | 1.29mi |
| 1625 S 17th St Wilmington, NC | 2.0 | 1.0–2.0 | 920 | $2,097 | $2.28 | 13d | 29 | 1.32mi |
| 505 Alpine Dr Wilmington, NC | 1.0–3.0 | 1.0–2.0 | 1009 | $1,454 | $1.44 | 13d | 9 | 1.33mi |
| 1015 Nutt St Wilmington, NC | 1.0–2.0 | 1.0–2.0 | 934 | $2,150 | $2.30 | 13d | 28 | 1.36mi |
Listing history 5 events
-
2026-06-09status $159,000 Pending 5 DOM
-
2026-06-08days on market $159,000 Active 5 DOM
-
2026-06-07days on market $159,000 Active 4 DOM
-
2026-06-03remarks 516-char remark
-
2026-06-03$159,000 Active 1 DOM
ⓘ Source: listings_history table (triggers on properties + properties_extension) + one-shot
backfill from property_details.listing_events for pre-trigger history.
Tax reassessment forecast NC · Resets to sale price
- Current annual tax
- $1,092 · $91/mo
- Projected year-2 tax
- $1,304 · $109/mo
- Expected delta
- +$212/yr (+$18/mo · 19.4%)
ⓘ Screening estimate from a state-policy table — verify with the county assessor before closing.
Climate risk First Street
- Flood 1/10 Low FEMA zone X (unshaded) · 0% chance over 30 yrs
- Wildfire 4/10 Moderate
- Heat 9/10 Extreme 7 d/yr ≥105°F today · 19 d/yr by 30 yrs out
- Wind 8/10 Severe 99% chance of damaging wind over 30 yrs
- Air quality 2/10 Low 1 unhealthy d/yr today · 1 by 30 yrs out
Nearby sold comps map
Loading sold comps map…
Walkable amenities ~0.75 mi
Loading nearby amenities…
Taxation est. · year 1
- Rental income
- $20,082
- − Mortgage interest
- −$8,906
- − Property taxes
- −$1,092
- − Insurance
- −$795
- − Repairs & maintenance
- −$1,607
- − Management
- −$1,607
- − Depreciation
- −$4,625
- Taxable income
- $1,450
- Est. tax owed @ 24.0%
- −$348
- After-tax cash flow
- $3,624/yr
For passive investors: Depreciation is non-cash, so a rental often shows a tax loss while cash-flowing — sheltering income. Rental losses are passive: they offset passive income freely, and up to $25,000/yr can offset ordinary (W-2) income if you actively participate and your MAGI is under $100k (phasing out to $0 by $150k); unused losses carry forward. On sale, claimed depreciation is recaptured at up to 25%, and gains may owe capital-gains tax (a 1031 exchange can defer both). Figures are a year-1 estimate at your 24.0% rate — not tax advice; consult a CPA.
Schools (NCES district)
- District
- New Hanover County Schools
- NCES district ID
- 3703330
- Math proficiency
- 48% ▼ -3.00%
- Reading proficiency
- 53% ▬ 0.00%
- Median HH income
- $49,406
- Composite
- 43.13/100
- National rank
- #3081
- State rank
- #61 of 178 in NC
Livability — Wilmington
- Score
- 70/100
- State rank
- #142
- US rank
- #8131
Category grades
Schools grade is shown separately in the Schools card above.
Census & demographics
- Census place
- Wilmington, NC
- County
- New Hanover County · 232,153 people
- City population
- 215,355
- Metro
- Wilmington, NC
- Population (ZIP)
- 22,007
- Household income
- $57,968
- Rent vs Own
- Severe rent burden
- 1696.0
Population outlook (New Hanover County) Hauer SSP2
- Today (2025)
- 259,517 people
- By 2030
- 279,586 · +7.7%
- By 2040
- 318,223 · +22.6%
- By 2050
- 354,831 · +36.7%
- By 2075
- 437,158 · +68.5%
- By 2100
- 486,769 · +87.6%
Race, ethnicity, and origin ACS 2023
- Neighborhood character
- Diverse neighborhood (Simpson 0.61)
- Race & ethnicity
- White 52% Black 33% Hispanic / Latino 9% Two or more races 7%
- Hispanic origin (detail)
- Mexican 5% Puerto Rican 1%
- Common ancestry
- Romanian 2% Serbian 2% Lithuanian 2%
- Foreign-born
- 6% · Canada
- Languages at home
- 91% English-only · Spanish 7% Other Indo-European 1%
Political lean MEDSL · New Hanover
- 2024 margin
- Toss-up / Even · D 49.8% · R 49.1% · Other 1.1%
- 2008→2024 swing
- +2.0pp toward D · 2008: -1.4pp · 2024: 0.6pp
- All cycles
- 2024: D+0.6 2020: D+2.1 2016: R+4.1 2012: R+4.7 2008: R+1.4
Not yet ingested
- Civics
- —
Market trends
- HPI YoY
- ▼ -309.34%
- Current HPI
- 293.4396
- Rent YoY
- ▼ -0.52%
- Metro
- Wilmington, NC
- State GDP YoY
- ▲ 3.28%
- F500 in state
- 26
Industry mix (Fortune 500 HQ in NC)
| Industry | F500 HQs | Revenue |
|---|---|---|
| Financial Services | 2 | $213B |
|
||
| Retail | 2 | $95B |
|
||
| Industrial Conglomerate | 1 | $38B |
|
||
| Metals / Steel | 1 | $35B |
|
||
| Utilities | 1 | $30B |
|
||
| Industrial Machinery | 1 | $19B |
|
||
Price history
+307.7% since first listed8 events — show timeline
- 2026-06-03 Listed $159,000 Hive MLS
- 2019-07-12 Sold (Public Records) $130,000 Public Records
- 2015-07-15 Sold (Public Records) $67,500 Public Records
- 2012-06-01 Listing Removed — Hive MLS
- 2012-04-13 Listed $79,500 Hive MLS
- 2011-09-28 Sold (MLS) $29,900 Hive MLS
- 2011-08-26 Listed $29,900 Hive MLS
- 2002-05-01 Sold (Public Records) $39,000 Public Records
Property tax history
+0.4%/yrLatest (2025): $1,092 · -2.3% YoY. Source: county tax records.
Cash-flow waterfall
monthlySold comps — $/sqft
last 12 mo · ≤1 miLoading sold comps…