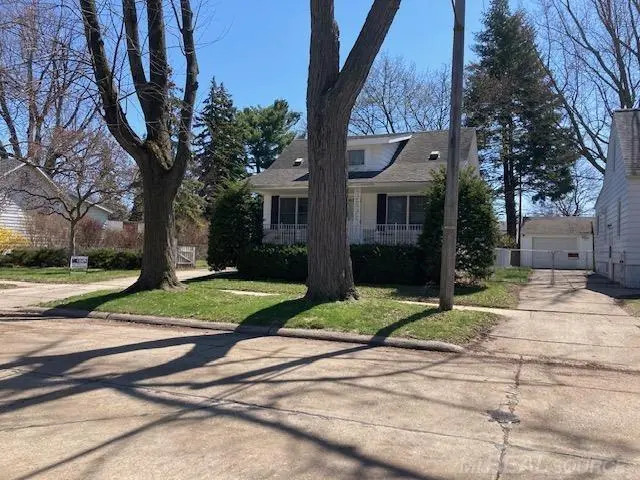
8442 Central St · Center Line, MI
Flood risk 1/10 · Minimal
- FEMA flood zone
- X (unshaded)
- Chance of flooding over 30 yrs
- 0.0%
- Est. flood insurance / yr
- $507 – $1,088
Fire risk 1/10 · Minimal
- Est. fire insurance / yr
- $784 – $1,456
Heat risk 3/10 · Minor
- Hot days now (above 97°F)
- 7 days/yr
- Hot days in 30 yrs
- 14 days/yr
Wind risk 1/10 · Minimal
- Chance of severe wind over 30 yrs
- —
Air-quality risk 3/10 · Minor
- Unhealthy air days now
- 3 days/yr
- Unhealthy air days in 30 yrs
- 4 days/yr
Risk factors via First Street. Map © Google.
Why this score? — see what drove the B- grade
The composite is a weighted blend of 9 inputs, each scored 0–100. Each bar is that input's sub-score; the figure is the points it added to the 100-point composite (weight × sub-score).
- Cash flow +24.8/30.0
- ARV discount +15.0/15.0
- DSCR +8.1/10.0
- 1% rule +7.1/10.0
- Livability +3.7/5.0
- Rent growth +2.5/5.0
- Condition / age +2.5/5.0
- Schools +1.8/10.0
- Appreciation +0.0/10.0
$105,000
🖨 Deal sheet 📄 Offer letter ✓ Due diligence
Listing remarks MLS
5000.00 PRICE REDUCTION. Great Bones, Extra Large Lot 90-154. Attention Flippers, Landlords, Renovators, this is a great opportunity in Center Line. Buyer Must assume All City Certification Responsibility attached in Disclosures. Home needs TLC much of the work has already been started, but has Great Potential. Blank Canvas with quality materials in original home construction. Extra large Detached Garage, Basement, Some New Windows, Exterior Painted.
Key facts
- Some new windows
- Basement
- Extra large lot
Tags
Property features AI
Finance
- HOA & community: Homeowners association present
Exterior
- Parking: Detached garage with approximately 2.5 car capacity
- Utilities: Public water; Public sewer
- Home design: Single-family residence; One and one-half stories; Residential zoning
- Construction: Aluminum siding; Block foundation; Built as residential single-family
- Exterior features: Patio; Fenced yard; Public maintained road
Interior
- Kitchen: Oven; Range; Refrigerator
- Bedrooms: Total of 7 rooms (bedroom count not specified)
- Flooring: Hardwood
- Bathrooms: 1 full bathroom
- Heating & cooling: Forced air heating (natural gas); Window cooling units
- Interior features: Gas water heater; Oven; Refrigerator; Range; Hardwood floors; Block basement
- Laundry & utility: Gas water heater
Neighborhood map
What this means for you Summary
Snapshot
- This is a 3-bed/1.0-bath single-family listed at $105k.
Deal economics
- At list price, monthly cash flow is $223 ($3k/yr) — positive.
- The deal already cash-flows at list — no discount required.
- Meets the 1% rule at list price ($1k rent vs $105k).
- Cap rate 8.8% vs local median 5.9% in Center Line — top-decile yield for the area; either an underpriced asset or a hidden risk that comps aren't pricing in. Stress-test before assuming the spread holds.
Location & tenants
- Location reads 74/100 on livability (#190 in MI, #4,835 nationally) — a middle-class / working-renter tenant base. Strengths: commute A+, cost of living A+, housing A+; Watch: amenities C-, crime D+, health & safety D.
- Center Line Public Schools (suburban): math 14% / reading 29% proficiency, ranked #459 of 540 in MI (top 85%) — low school quality limits family demand, transient renter base, plan for 1-2y turnover; 60% free/reduced lunch — lower-income household profile, screen leases tightly.
- Market conditions: 34 active listings in the ZIP; 19 comparable units currently listed for rent nearby; rentals at typical pace (median 25d on market — plan ~3-4 weeks tenant-placement turnaround); 1,321 units permitted in Macomb County in 2024 (86 in 5+ unit buildings).
Forward outlook
- Local home prices are declining (-3.0%/yr); year-one equity from $726 of loan paydown is wiped out by about $3k of value loss. Plan a longer hold.
- Macomb County population projected at +9% by 2050 — modest demand growth; plan on rents tracking national, not racing it.
Negotiation context
- Only 2 days on market — expect competitive offers; lowballing is unlikely to land.
- 16 sale attempts with the ask held roughly flat each time — persistent listings suggest the price (not the market) is what's stuck; bring a comps-based counter.
Risks & watch-outs
- Watch-outs: built in 1925 — expect roof / HVAC / electrical / plumbing capex.
Questions for the listing agent
- Built in 1925 — when were the roof, HVAC, electrical panel, plumbing, and water heater last replaced?
- Is there a deadline driving the sale (1031 exchange, divorce, estate, relocation)? That informs how much negotiation room exists.
- Schools are D-rated, which usually means shorter tenancies and higher turnover. Who's the typical renter profile here, and what's been the actual vacancy rate?
- Crime grade is D in this area — have there been break-ins, vandalism, or insurance claims at this property in the last 3 years? What carrier currently insures it and at what premium?
- What's the average days-on-market for RENTAL listings here right now (not sales)? A rising rental-DOM trend means longer vacancies and softer asking-rent achievability than the comps imply.
- What's the recent tenant-quality profile in this submarket — average credit score on applications, eviction rate, late-payment / NSF rate, and stable-employment percentage? A property-management company in the area should have these aggregated.
- How much new for-sale + rental construction is in the pipeline within 1–3 miles? Heavy new supply typically softens prices + rents 12–24 months out; constrained supply supports both.
Investment metrics
- 1% rule
- 1.21% ✓
- Cap rate
- 8.84%
- Cash-on-cash
- 9.10%
- DSCR
- 1.41
- GRM
- 6.9
CMA / ARV
- ARV (median comp)
- $154,925
- List price
- $105,000
- Delta
- -32.23%
- Verdict
- UNDERPRICED
- Comps
- 20 within 1.0 mi
Show comp detail 7 sales within ~0.75 mi
| Address | Dist | Beds/Ba | Sqft | Sold | Price | $/sf | Match |
|---|---|---|---|---|---|---|---|
| 25034 Comfort | 0.34mi | 2/1.0 (-1) | 804 (+3%) | 2mo | $136,200 | $169 | 72 |
| 8137 Helen St | 0.26mi | 2/1.0 (-1) | 800 (+3%) | 12mo | $130,000 | $163 | 69 |
| 7399 Gronow | 0.40mi | 2/1.0 (-1) | 700 (-10%) | 2mo | $134,250 | $192 | 58 |
| 7377 Bernice | 0.60mi | 2/1.0 (-1) | 816 (+5%) | 2mo | $105,000 | $129 | 57 |
| 24894 Marigold Ave | 0.48mi | 3/1.0 | 888 (+14%) | 2mo | $105,000 | $118 | 53 |
| 8328 Theisen St | 0.54mi | 3/1.0 | 884 (+13%) | 14mo | $144,500 | $163 | 41 |
| 24700 Tallman Ave | 0.66mi | 3/1.0 | 864 (+11%) | 15mo | $143,000 | $166 | 39 |
Match score weights: distance 35% · size 25% · config 20% · recency 20%. Top-matched comps best support the ARV.
Projected returns pro-forma
-3.0% appreciation · 3.0% rent growth · sell at horizon
- IRR
- -2.5%
- Equity multiple
- 0.91×
- Total profit
- $-2,759
- Equity at exit
- $15,656
- IRR
- 7.3%
- Equity multiple
- 1.55×
- Total profit
- $16,098
- Equity at exit
- $9,078
Cash invested: $29,400 (down + closing). Projections, not guarantees.
Landlord ↔ Tenant lean methodology
- Overall (STATE)
- 62 Landlord-Friendly
- State Michigan
- 62 Landlord-Friendly · EVEN
- County
- — inherits STATE
- City
- — inherits STATE
ZIP-level market 48015
- Home prices YoY
- -20.6%
- Active inventory
- 34
- Price-to-rent
- 6.9×
Monthly cashflow live
- Estimated rent
- $1,268 high interval (Pro) →
- Mortgage (P&I)
- −$551
- Tax from tax record
- −$185 /mo · $2,216/yr
- Insurance
- −$44
- HOA
- −$0
- Vacancy / Maint / Mgmt
- −$266
- Net cashflow
- $223
Break-even live
Sensitivity live
| Price | -10% $282 | -5% $253 | +0% $223 | +5% $193 | +10% $164 |
|---|---|---|---|---|---|
| Rent | -10% $123 | -5% $173 | +0% $223 | +5% $273 | +10% $323 |
| Rate | -1.0pp $276 | -0.5pp $250 | base $223 | +0.5pp $196 | +1.0pp $168 |
UW: 25.0% down · 7.5% · 30yr · 1.5% tax · 5.0% vac · 8.0% maint · 8.0% mgmt
Financing live
Cash to close
- Down payment
- $26,250
- Closing costs
- $3,150
- Reserves months
- —
- Total cash needed
- —
Loan-product check · same deal, 3 products live
Conventional
25% down · 7.5% · 30yr
- Down + closing
- —
- Monthly P&I
- —
- Monthly cashflow
- —
- DSCR
- —
- Eligible?
- —
Personal DTI + credit; lowest rate.
DSCR
20% down · 8.5% · 30yr
- Down + closing
- —
- Monthly P&I
- —
- Monthly cashflow
- —
- DSCR
- —
- Eligible?
- —
No personal income docs; deal must DSCR.
Hard money
10% down · 12.0% · 12mo
- Down + closing
- —
- Monthly P&I
- —
- Monthly cashflow
- —
- DSCR
- —
- Eligible?
- —
Short-term bridge; refi at stabilization.
Rent comps 19 comps
| Address | Beds | Baths | Sqft | Rent | $/sqft | DOM | Units | Dist |
|---|---|---|---|---|---|---|---|---|
| 25005 Lawrence Ave Center Line, MI | 1.0–2.0 | 1.0–1.5 | 1000 | $955 | $0.95 | 44d | 1 | 0.66mi |
| 11404 Warren Blvd Unit 102 Warren, MI | 2.0 | 1.0 | 900 | $1,250 | $1.39 | 24d | 1 | 0.67mi |
| 25108 Hoover Rd Warren, MI | 1.0–2.0 | 1.0 | 702 | $1,324 | $1.88 | 2d | 65 | 0.78mi |
| 27107 Seyburn Ave Warren, MI | 2.0 | 1.0 | 750 | $1,300 | $1.73 | 22d | 1 | 0.85mi |
| 11130 Stephens Rd Warren, MI | 2.0 | 1.0 | 750 | $1,300 | $1.73 | 44d | 1 | 0.89mi |
| 8125 Timken Ave Warren, MI | 3.0 | 1.0 | 948 | $1,270 | $1.34 | 5d | 1 | 1.03mi |
| 11076 Essex Ave Warren, MI | 4.0 | 1.0 | 1072 | $1,400 | $1.31 | 44d | 1 | 1.04mi |
| 8428 Timken Ave Warren, MI | 3.0 | 1.0 | 860 | $1,250 | $1.45 | 24d | 1 | 1.04mi |
| 8212 Timken Ave Warren, MI | 2.0 | 1.0 | 756 | $1,320 | $1.75 | 24d | 1 | 1.05mi |
| 25146 Wagner Ave Warren, MI | 3.0 | 1.0 | 906 | $1,900 | $2.10 | 24d | 1 | 1.06mi |
| 8716 Timken Ave Warren, MI | 3.0 | 1.0 | 1008 | $1,400 | $1.39 | 24d | 1 | 1.06mi |
| 27239 Hoover Rd Warren, MI | 1.0–2.0 | 1.0 | 670 | $945 | $1.41 | 44d | 1 | 1.13mi |
| 8636 Republic Ave Warren, MI | 2.0 | 1.0 | 800 | $1,250 | $1.56 | 15d | 1 | 1.15mi |
| 8707 Continental Ave Warren, MI | 3.0 | 1.0 | 1100 | $1,200 | $1.09 | 5d | 1 | 1.19mi |
| 8707 Continental Ave Warren, MI | 3.0 | 1.0 | 968 | $1,200 | $1.24 | 18d | 1 | 1.19mi |
| 8509 Paige Ave Warren, MI | 3.0 | 1.0 | 950 | $1,300 | $1.37 | 24d | 1 | 1.23mi |
| 8693 Paige Ave Warren, MI | 3.0 | 1.0 | 900 | $1,300 | $1.44 | 24d | 1 | 1.24mi |
| 11331 Continental Ave Warren, MI | 2.0 | 1.0 | 765 | $1,250 | $1.63 | 24d | 1 | 1.27mi |
| 11359 Maxwell Ave Unit 11359 Warren, MI | 2.0 | 1.0 | 900 | $1,000 | $1.11 | 4d | 1 | 1.49mi |
Listing history 33 events
-
2026-06-18days on market $105,000 Active 2 DOM
-
2026-06-16days on market $105,000 Active 1 DOM
Show marketing remark (454 chars)
5000.00 PRICE REDUCTION. Great Bones, Extra Large Lot 90-154. Attention Flippers, Landlords, Renovators, this is a great opportunity in Center Line. Buyer Must assume All City Certification Responsibility attached in Disclosures. Home needs TLC much of the work has already been started, but has Great Potential. Blank Canvas with quality materials in original home construction. Extra large Detached Garage, Basement, Some New Windows, Exterior Painted.
-
2026-06-15statusdays on market $105,000 Active 20 DOM
-
2026-05-06historical
-
2026-05-06historical
-
2026-05-05price $105,000
-
2026-05-05price $105,000
-
2026-05-05$105,000 Active
-
2026-05-05$105,000 Active
-
2026-04-08historical
-
2026-04-08historical
-
2026-04-07$110,000 Active
-
2026-04-07$110,000 Active
-
2026-04-06price $110,000
-
2026-04-06price $110,000
-
2026-03-21historical
-
2026-03-21historical
-
2026-03-20price $115,000
-
2026-03-20price $115,000
-
2026-03-20$115,000 Active
-
2026-03-20$115,000 Active
-
2026-02-11historical
-
2026-02-11historical
-
2026-02-10$120,000 Active
-
2026-02-10$120,000 Active
-
2026-01-31historical
-
2026-01-31historical
-
2026-01-30price $125,000
-
2026-01-30price $125,000
-
2026-01-30$125,000 Active
-
2026-01-30$125,000 Active
-
2026-01-21$135,000 Active
-
2026-01-21$135,000 Active
ⓘ Source: listings_history table (triggers on properties + properties_extension) + one-shot
backfill from property_details.listing_events for pre-trigger history.
Tax reassessment forecast MI · Partial reset (capped growth)
- Current annual tax
- $2,216 · $185/mo
- Projected year-2 tax
- $2,216 · $185/mo
- Expected delta
- $0/yr ($0/mo · 0.0%)
ⓘ Screening estimate from a state-policy table — verify with the county assessor before closing.
Climate risk First Street
- Flood 1/10 Low FEMA zone X (unshaded) · 0% chance over 30 yrs
- Wildfire 1/10 Low
- Heat 3/10 Moderate 7 d/yr ≥97°F today · 14 d/yr by 30 yrs out
- Wind 1/10 Low
- Air quality 3/10 Moderate 3 unhealthy d/yr today · 4 by 30 yrs out
Nearby sold comps map
Loading sold comps map…
Walkable amenities ~0.75 mi
Loading nearby amenities…
Taxation est. · year 1
- Rental income
- $15,221
- − Mortgage interest
- −$5,882
- − Property taxes
- −$2,216
- − Insurance
- −$525
- − Repairs & maintenance
- −$1,218
- − Management
- −$1,218
- − Depreciation
- −$3,055
- Taxable income
- $1,109
- Est. tax owed @ 24.0%
- −$266
- After-tax cash flow
- $2,410/yr
For passive investors: Depreciation is non-cash, so a rental often shows a tax loss while cash-flowing — sheltering income. Rental losses are passive: they offset passive income freely, and up to $25,000/yr can offset ordinary (W-2) income if you actively participate and your MAGI is under $100k (phasing out to $0 by $150k); unused losses carry forward. On sale, claimed depreciation is recaptured at up to 25%, and gains may owe capital-gains tax (a 1031 exchange can defer both). Figures are a year-1 estimate at your 24.0% rate — not tax advice; consult a CPA.
Schools (NCES district)
- District
- Center Line Public Schools
- NCES district ID
- 2608580
- Math proficiency
- 14% ▼ -8.00%
- Reading proficiency
- 29% ▼ -3.00%
- Median HH income
- $38,011
- Composite
- 17.95/100
- National rank
- #8992
- State rank
- #459 of 540 in MI
Livability — Center Line
- Score
- 74/100
- State rank
- #190
- US rank
- #4835
Category grades
Schools grade is shown separately in the Schools card above.
Census & demographics
- Census place
- Center Line, MI
- City population
- 8,448
- Population (ZIP)
- 8,448
Population outlook (Macomb County) Hauer SSP2
- Today (2025)
- 925,296 people
- By 2030
- 948,226 · +2.5%
- By 2040
- 983,961 · +6.3%
- By 2050
- 1,010,200 · +9.2%
- By 2075
- 1,076,222 · +16.3%
- By 2100
- 1,077,065 · +16.4%
Race, ethnicity, and origin ACS 2023
- Neighborhood character
- Diverse neighborhood (Simpson 0.64)
- Race & ethnicity
- White 51% Black 30% Asian 11% Two or more races 4% Hispanic / Latino 4% Native American 1%
- Common ancestry
- Romanian 7% Lithuanian 3% German 2%
- Foreign-born
- 15% · Canada, Vietnam
- Languages at home
- 81% English-only · Other Indo-European 9% Russian/Polish/Slavic 5% Spanish 1%
Political lean MEDSL · Macomb
- 2024 margin
- R (+13.7) · D 42.2% · R 55.9% · Other 1.9%
- 2008→2024 swing
- -22.3pp toward R · 2008: 8.6pp · 2024: -13.7pp
- All cycles
- 2024: R+13.7 2020: R+8.1 2016: R+11.6 2012: D+4.0 2008: D+8.6
Not yet ingested
- Civics
- —
Market trends
- HPI YoY
- ▼ -66.73%
- Current HPI
- 256.7842
- Rent YoY
- —
- Metro
- —
- State GDP YoY
- ▲ 1.37%
- F500 in state
- 28
Industry mix (Fortune 500 HQ in MI)
| Industry | F500 HQs | Revenue |
|---|---|---|
| Automotive Parts | 3 | $48B |
|
||
| Automotive | 2 | $372B |
|
||
| Chemicals | 1 | $45B |
|
||
| Automotive Retail | 1 | $29B |
|
||
| Healthcare / Medical Devices | 1 | $23B |
|
||
| Automotive Technology | 1 | $20B |
|
||
Price history
-22.2% since first listed38 events — show timeline
- 2026-06-17 Listing Removed — MiRealSource-MiMLS
- 2026-06-16 Listed $105,000 REALCOMP
- 2026-06-16 Listed $105,000 MiRealSource-MiMLS
- 2026-06-14 Relisted — REALCOMP
- 2026-06-13 Relisted — MiRealSource-MiMLS
- 2026-05-25 Listing Removed — REALCOMP
- 2026-05-25 Pending — REALCOMP
- 2026-05-25 Pending — MiRealSource-MiMLS
- 2026-05-06 Listing Removed — MiRealSource-MiMLS
- 2026-05-06 Listing Removed — REALCOMP
- 2026-05-05 Price Changed $105,000 MiRealSource-MiMLS
- 2026-05-05 Price Changed $105,000 REALCOMP
- 2026-05-05 Listed $105,000 REALCOMP
- 2026-05-05 Listed $105,000 MiRealSource-MiMLS
- 2026-04-08 Listing Removed — REALCOMP
- 2026-04-08 Listing Removed — MiRealSource-MiMLS
- 2026-04-07 Listed $110,000 REALCOMP
- 2026-04-07 Listed $110,000 MiRealSource-MiMLS
- 2026-04-06 Price Changed $110,000 MiRealSource-MiMLS
- 2026-04-06 Price Changed $110,000 REALCOMP
- 2026-03-21 Listing Removed — REALCOMP
- 2026-03-21 Listing Removed — MiRealSource-MiMLS
- 2026-03-20 Price Changed $115,000 MiRealSource-MiMLS
- 2026-03-20 Price Changed $115,000 REALCOMP
- 2026-03-20 Listed $115,000 REALCOMP
- 2026-03-20 Listed $115,000 MiRealSource-MiMLS
- 2026-02-11 Listing Removed — REALCOMP
- 2026-02-11 Listing Removed — MiRealSource-MiMLS
- 2026-02-10 Listed $120,000 REALCOMP
- 2026-02-10 Listed $120,000 MiRealSource-MiMLS
- 2026-01-31 Listing Removed — REALCOMP
- 2026-01-31 Listing Removed — MiRealSource-MiMLS
- 2026-01-30 Price Changed $125,000 MiRealSource-MiMLS
- 2026-01-30 Price Changed $125,000 REALCOMP
- 2026-01-30 Listed $125,000 MiRealSource-MiMLS
- 2026-01-30 Listed $125,000 REALCOMP
- 2026-01-21 Listed $135,000 REALCOMP
- 2026-01-21 Listed $135,000 MiRealSource-MiMLS
Property tax history
+2.1%/yrLatest (2025): $2,216 · +2.0% YoY. Source: county tax records.
Cash-flow waterfall
monthlySold comps — $/sqft
last 12 mo · ≤1 miLoading sold comps…