534 E 37th Ave #679 · Lake Station, IN
Flood risk No data
- FEMA flood zone
- —
- Chance of flooding over 30 yrs
- —
- Est. flood insurance / yr
- —
Fire risk No data
- Est. fire insurance / yr
- —
Heat risk No data
- Hot days now (above threshold)
- —
- Hot days in 30 yrs
- —
Wind risk No data
- Chance of severe wind over 30 yrs
- —
Air-quality risk No data
- Unhealthy air days now
- —
- Unhealthy air days in 30 yrs
- —
Risk factors via First Street. Map © Google.
Why this score? — see what drove the C- grade
The composite is a weighted blend of 9 inputs, each scored 0–100. Each bar is that input's sub-score; the figure is the points it added to the 100-point composite (weight × sub-score).
- Cash flow +14.9/30.0
- 1% rule +10.0/10.0
- ARV discount +7.5/15.0
- Condition / age +5.0/5.0
- DSCR +4.5/10.0
- Rent growth +3.9/5.0
- Livability +3.2/5.0
- Schools +2.0/10.0
- Appreciation +0.0/10.0
$93,750
🖨 Deal sheet 📄 Offer letter ✓ Due diligence
Listing remarks
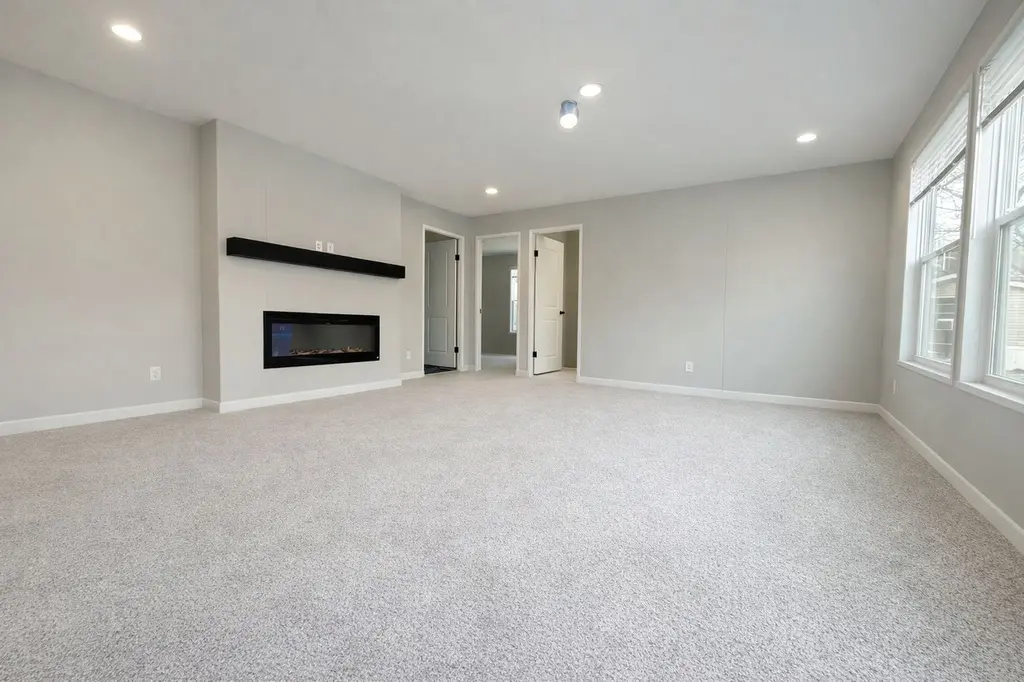
Step into a home that feels elevated from the very beginning. This brand-new 2026 Redman Paramount at Lot 685 offers a beautifully designed 3-bedroom, 2-bath layout with the kind of space, comfort, and detail that makes everyday living feel exceptional. From the elegant electric fireplace to the refined exterior finishes, every element was selected to create a home that feels warm, polished, and inviting. With thoughtful features like perimeter heat, a gas furnace, modern siding, and a 7-year warranty, this home blends style with substance in all the right ways. It is a place where comfort feels effortless, the finishes feel timeless, and home truly feels like a step up. Brand-new 2026 Redm
Key facts
- Gas furnace
- Modern siding
- 7-year warranty
Tags
Property features AI
Finance
- Financial info: List price available
- HOA & community: Association fee of 625
Exterior
- Utilities: Has heating; Has cooling
- Home design: Spec home from the Ravinia Pines plan; Single listing status: Active
- Exterior features: Asphalt roof
Interior
- Kitchen: Includes dishwasher, microwave, and refrigerator
- Bedrooms: 3 bedrooms
- Bathrooms: 2 bathrooms
- Heating & cooling: Forced air heating; Central air; Ceiling fan(s)
- Interior features: Dishwasher; Microwave; Refrigerator
Neighborhood map
What this means for you Summary
Snapshot
- This is a 3-bed/2.0-bath manufactured listed at $94k. Condition is rated excellent.
Deal economics
- At list price, monthly cash flow is $27 ($323/yr) — positive.
- The deal already cash-flows at list — no discount required.
- Meets the 1% rule at list price ($2k rent vs $94k).
- Recommended offer: $91k (3.0% below list) — sets the bar for market timing.
Location & tenants
- Location reads 63/100 on livability (#411 in IN) — a middle-class / working-renter tenant base. Strengths: cost of living A+, housing A+; Watch: crime C-, schools F, amenities F.
- River Forest Community School Corporation (suburban): math 17% / reading 30% proficiency, ranked #268 of 301 in IN (top 89%) — low school quality limits family demand, transient renter base, plan for 1-2y turnover; 72% free/reduced lunch — lower-income household profile, screen leases tightly.
- Market conditions: Rents rising fast (+5.6%/yr); 255 active listings in the ZIP; 7 comparable units currently listed for rent nearby; rentals leasing fast (median 2d on market — plan ~1-2 weeks tenant-placement turnaround); solid renter incomes; 1,642 units permitted in Lake County in 2024 (14 in 5+ unit buildings).
Forward outlook
- Local home prices are declining (-3.0%/yr); year-one equity from $648 of loan paydown is wiped out by about $3k of value loss. Plan a longer hold.
- Lake County population projected to shrink 7% by 2050 — rents likely to lag national; underwrite the cash flow, not the appreciation.
Negotiation context
- It's been on market 36 days — a 3% lower offer ($91k) is reasonable based on typical stale-listing flexibility.
Risks & watch-outs
- Watch-outs: HOA is 38% of rent.
Questions for the listing agent
- It's been on market 36 days. Have you received any prior offers? Is the seller open to a 3% concession, seller financing, or rate buy-down credit?
- What does the HOA fee cover, when was the last increase, and are there any pending special assessments or reserve-fund shortfalls?
- Is there a deadline driving the sale (1031 exchange, divorce, estate, relocation)? That informs how much negotiation room exists.
- Schools are F-rated, which usually means shorter tenancies and higher turnover. Who's the typical renter profile here, and what's been the actual vacancy rate?
- What's the average days-on-market for RENTAL listings here right now (not sales)? A rising rental-DOM trend means longer vacancies and softer asking-rent achievability than the comps imply.
- What's the recent tenant-quality profile in this submarket — average credit score on applications, eviction rate, late-payment / NSF rate, and stable-employment percentage? A property-management company in the area should have these aggregated.
- How much new for-sale + rental construction is in the pipeline within 1–3 miles? Heavy new supply typically softens prices + rents 12–24 months out; constrained supply supports both.
Investment metrics
- 1% rule
- 1.76% ✓
- Cap rate
- 6.64%
- Cash-on-cash
- 1.23%
- DSCR
- 1.05
- GRM
- 4.7
CMA / ARV
- ARV (median comp)
- $188,131
- List price
- $93,750
- Delta
- -50.17%
- Verdict
- UNDERPRICED
- Comps
- 6 within 2.0 mi
Projected returns pro-forma
-3.0% appreciation · 5.63% rent growth · sell at horizon
- IRR
- -8.5%
- Equity multiple
- 0.67×
- Total profit
- $-8,599
- Equity at exit
- $13,978
- IRR
- 6.6%
- Equity multiple
- 1.60×
- Total profit
- $15,734
- Equity at exit
- $8,106
Cash invested: $26,250 (down + closing). Projections, not guarantees.
Landlord ↔ Tenant lean methodology
- Overall (STATE)
- 90 Strongly Landlord-Friendly
- State Indiana
- 90 Strongly Landlord-Friendly · R+11
- County
- — inherits STATE
- City
- — inherits STATE
ZIP-level market 46342
- Rents YoY
- 5.6%
- Active inventory
- 255
- Price-to-rent
- 4.7×
Monthly cashflow live
- Estimated rent
- $1,645 high interval (Pro) →
- Mortgage (P&I)
- −$492
- Tax est. 1.5%
- −$117 /mo · $1,406/yr
- Insurance
- −$39
- HOA
- −$625
- Vacancy / Maint / Mgmt
- −$346
- Net cashflow
- $27
Break-even live
UW: 25.0% down · 7.5% · 30yr · 1.5% tax · 5.0% vac · 8.0% maint · 8.0% mgmt
Financing live
Cash to close
- Down payment
- $23,438
- Closing costs
- $2,812
- Reserves months
- —
- Total cash needed
- —
Loan-product check · same deal, 3 products live
Conventional
25% down · 7.5% · 30yr
- Down + closing
- —
- Monthly P&I
- —
- Monthly cashflow
- —
- DSCR
- —
- Eligible?
- —
Personal DTI + credit; lowest rate.
DSCR
20% down · 8.5% · 30yr
- Down + closing
- —
- Monthly P&I
- —
- Monthly cashflow
- —
- DSCR
- —
- Eligible?
- —
No personal income docs; deal must DSCR.
Hard money
10% down · 12.0% · 12mo
- Down + closing
- —
- Monthly P&I
- —
- Monthly cashflow
- —
- DSCR
- —
- Eligible?
- —
Short-term bridge; refi at stabilization.
Rent comps 7 comps
| Address | Beds | Baths | Sqft | Rent | $/sqft | DOM | Units | Dist |
|---|---|---|---|---|---|---|---|---|
| 905 W 37th Ave Unit 48 Hobart, IN | 2.0 | 1.0 | 1000 | $1,200 | $1.20 | 43d | 1 | 0.26mi |
| 600 W 39th Pl Hobart, IN | 3.0 | 3.0 | 1601 | $2,615 | $1.63 | 1d | 1 | 0.39mi |
| 123 Arthur Ave Hobart, IN | 2.0 | 1.0 | 1565 | $1,500 | $0.96 | 1d | 1 | 0.44mi |
| 416 Van Buren Ave Hobart, IN | 3.0 | 1.0 | 1085 | $1,395 | $1.29 | 1d | 1 | 0.66mi |
| 333 Neringa Ln Hobart, IN | 1.0–3.0 | 1.0–2.0 | 1009 | $1,780 | $1.76 | 1d | 11 | 0.81mi |
| 3753 Englehart St Lake Station, IN | 3.0 | 1.0 | 1224 | $1,450 | $1.18 | 1d | 1 | 1.17mi |
| 1421 High St Unit 2W Hobart, IN | 2.0 | 1.0 | 950 | $1,200 | $1.26 | 20d | 1 | 1.44mi |
HOA detail
- Monthly dues
- $625 · $7,500/yr
- Likely covers
- gaselectric
Listing history 15 events
-
2026-06-18days on market $93,750 Active 36 DOM
-
2026-06-17days on market $93,750 Active 35 DOM
-
2026-06-16days on market $93,750 Active 34 DOM
-
2026-06-15days on market $93,750 Active 33 DOM
-
2026-06-13days on market $93,750 Active 31 DOM
-
2026-06-13days on market $93,750 Active 30 DOM
-
2026-06-09days on market $93,750 Active 27 DOM
-
2026-06-08days on market $93,750 Active 26 DOM
-
2026-06-07days on market $93,750 Active 25 DOM
-
2026-06-04days on market $93,750 Active 22 DOM
-
2026-06-03days on market $93,750 Active 21 DOM
-
2026-06-02days on market $93,750 Active 20 DOM
-
2026-06-01days on market $93,750 Active 19 DOM
-
2026-05-31days on market $93,750 Active 18 DOM
-
2026-05-13$93,750 Active 960-char remark
ⓘ Source: listings_history table (triggers on properties + properties_extension) + one-shot
backfill from property_details.listing_events for pre-trigger history.
Nearby sold comps map
Loading sold comps map…
Walkable amenities ~0.75 mi
Loading nearby amenities…
Taxation est. · year 1
- Rental income
- $19,744
- − Mortgage interest
- −$5,251
- − Property taxes
- −$1,406
- − Insurance
- −$469
- − Repairs & maintenance
- −$1,580
- − Management
- −$1,580
- − HOA
- −$7,500
- − Depreciation
- −$2,727
- Taxable loss
- −$769
- Est. tax savings @ 24.0%
- +$184
- After-tax cash flow
- $508/yr
For passive investors: Depreciation is non-cash, so a rental often shows a tax loss while cash-flowing — sheltering income. Rental losses are passive: they offset passive income freely, and up to $25,000/yr can offset ordinary (W-2) income if you actively participate and your MAGI is under $100k (phasing out to $0 by $150k); unused losses carry forward. On sale, claimed depreciation is recaptured at up to 25%, and gains may owe capital-gains tax (a 1031 exchange can defer both). Figures are a year-1 estimate at your 24.0% rate — not tax advice; consult a CPA.
Condition & rehab AI · 30 photos
This brand-new 2026 Redman Paramount is move-in ready with excellent condition and modern features, making it an ideal investment property.
Value-add opportunities
- Resale Painting the interior walls — Fresh paint can enhance the home's curb appeal and make it more inviting.
- Resale Replacing the carpet with hardwood flooring — Hardwood flooring is more durable and can increase the home's value.
- Resale Upgrading the kitchen appliances — Modern appliances can make the kitchen more functional and appealing to potential buyers.
- Both Adding smart home features — Smart home features can improve convenience and add value to both resale and rental markets.
Renovation cost estimate screening
Value-add ROI direction
- Resale Painting the interior walls — Fresh paint can enhance the home's curb appeal and make it more inviting. ↑
- Resale Replacing the carpet with hardwood flooring — Hardwood flooring is more durable and can increase the home's value. ↑
- Resale Upgrading the kitchen appliances — Modern appliances can make the kitchen more functional and appealing to potential buyers. ↑
- Both Adding smart home features — Smart home features can improve convenience and add value to both resale and rental markets. ↑
ⓘ Cost ranges are severity-bucket heuristics (US national rule-of-thumb). Get contractor quotes + a written scope before underwriting a rehab budget.
Schools (NCES district)
- District
- River Forest Community School Corporation
- NCES district ID
- 1804620
- Math proficiency
- 17% ▼ -18.00%
- Reading proficiency
- 30% ▼ -6.00%
- Median HH income
- $38,317
- Composite
- 19.65/100
- National rank
- #8738
- State rank
- #268 of 301 in IN
Livability — Lake Station
- Score
- 63/100
- State rank
- #411
- US rank
- #14929
Category grades
Schools grade is shown separately in the Schools card above.
Census & demographics
- Census place
- Lake Station, IN
- County
- Lake County · 422,878 people
- City population
- 12,184
- Metro
- Chicago-Naperville-Elgin, IL-IN-WI
- Population (ZIP)
- 32,224
- Household income
- $75,521
- Rent vs Own
- Severe rent burden
- 1033.0
Population outlook (Lake County) Hauer SSP2
- Today (2025)
- 484,026 people
- By 2030
- 478,091 · -1.2%
- By 2040
- 462,974 · -4.3%
- By 2050
- 449,894 · -7.1%
- By 2075
- 436,169 · -9.9%
- By 2100
- 426,607 · -11.9%
Race, ethnicity, and origin ACS 2023
- Neighborhood character
- Predominantly White (66%)
- Race & ethnicity
- White 66% Hispanic / Latino 21% Two or more races 10% Black 10% Asian 1%
- Hispanic origin (detail)
- Mexican 15% Puerto Rican 5%
- Common ancestry
- Romanian 11% Iranian 2% Lithuanian 1%
- Foreign-born
- 5% · Canada, China
- Languages at home
- 87% English-only · Spanish 9% Russian/Polish/Slavic 2% Chinese 1%
Political lean MEDSL · Lake
- 2024 margin
- Lean D (+5.6) · D 52.1% · R 46.5% · Other 1.5%
- 2008→2024 swing
- -28.6pp toward R · 2008: 34.3pp · 2024: 5.6pp
- All cycles
- 2024: D+5.6 2020: D+15.1 2016: D+20.6 2012: D+31.0 2008: D+34.3
Not yet ingested
- Civics
- —
Market trends
- HPI YoY
- ▼ -167.01%
- Current HPI
- 260.2635
- Rent YoY
- ▲ 5.63%
- Metro
- Chicago-Naperville-Elgin, IL-IN-WI
- State GDP YoY
- ▲ 2.90%
- F500 in state
- 18
Industry mix (Fortune 500 HQ in IN)
| Industry | F500 HQs | Revenue |
|---|---|---|
| Industrial Machinery | 2 | $37B |
|
||
| Healthcare | 1 | $177B |
|
||
| Pharmaceuticals | 1 | $45B |
|
||
| Metals / Steel | 1 | $18B |
|
||
| Agriculture | 1 | $17B |
|
||
| Packaging | 1 | $12B |
|
||
Cash-flow waterfall
monthlySold comps — $/sqft
last 12 mo · ≤1 miLoading sold comps…