3200 NE 7th Ct Unit 306C · Pompano Beach, FL
Flood risk 7/10 · Major
- FEMA flood zone
- X (unshaded)
- Chance of flooding over 30 yrs
- 0.94%
- Est. flood insurance / yr
- $507 – $1,088
Fire risk 1/10 · Minimal
- Est. fire insurance / yr
- $947 – $1,759
Heat risk 10/10 · Severe
- Hot days now (above 106°F)
- 7 days/yr
- Hot days in 30 yrs
- 27 days/yr
Wind risk 10/10 · Severe
- Chance of severe wind over 30 yrs
- 99.0%
Air-quality risk 2/10 · Minimal
- Unhealthy air days now
- 1 days/yr
- Unhealthy air days in 30 yrs
- 2 days/yr
Risk factors via First Street. Map © Google.
Why this score? — see what drove the C grade
The composite is a weighted blend of 9 inputs, each scored 0–100. Each bar is that input's sub-score; the figure is the points it added to the 100-point composite (weight × sub-score).
- Cash flow +21.4/30.0
- 1% rule +8.3/10.0
- ARV discount +7.5/15.0
- DSCR +6.8/10.0
- Schools +4.1/10.0
- Livability +3.7/5.0
- Condition / age +2.5/5.0
- Rent growth +2.4/5.0
- Appreciation +0.0/10.0
$175,400
🖨 Deal sheet 📄 Offer letter ✓ Due diligence
Listing remarks
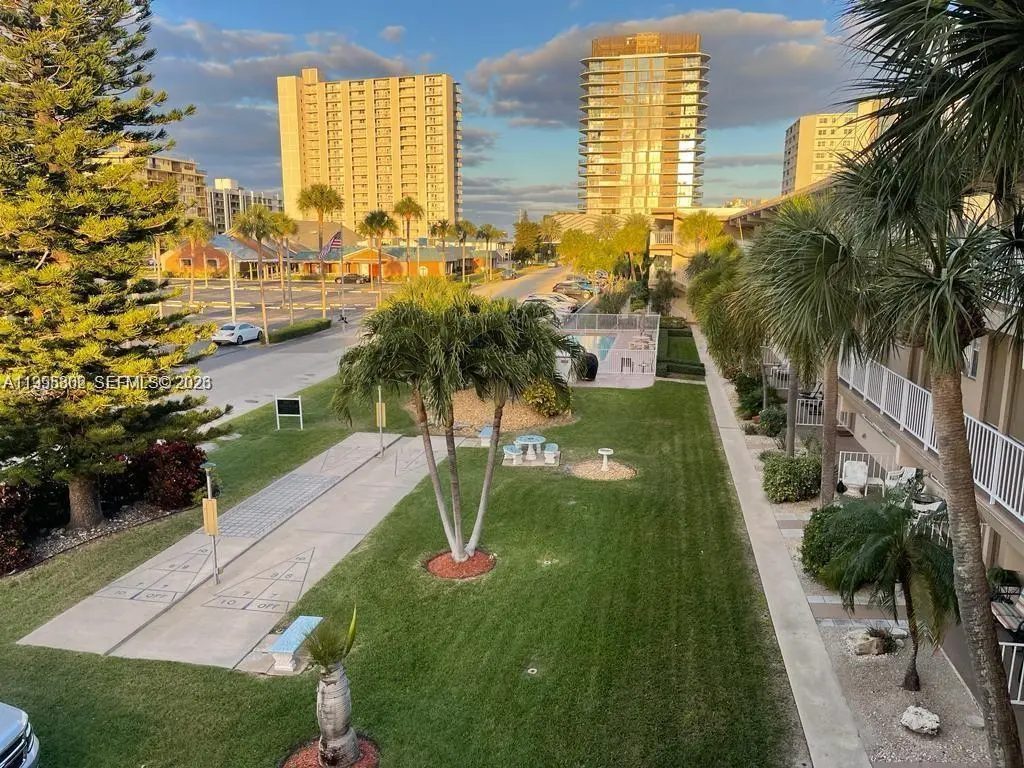
Beautifully updated and move-in ready, this charming coastal retreat offers the perfect blend of comfort, style, and location—an ideal escape for beach lovers seeking the ultimate Florida lifestyle. Just one block from the beach with deeded access, enjoy the best of South Florida living nestled between the Intracoastal Waterway and the ocean. This bright 1-bedroom, 1-bath residence is offered fully furnished, making it ideal as a primary home or vacation getaway. The unit features hurricane shutters and impact windows for peace of mind, along with tasteful upgrades throughout. The building offers storage, community pool, and barbecue area. A rare and highly desirable feature, the unit
Key facts
- Barbecue area
- Community pool
- Deeded access
Tags
Property features AI
Finance
- Other: Pets allowed with restrictions (conditional)
- Financial info: Association fee: $513 monthly; Annual tax amount: $915 (tax year 2025)
- HOA & community: Monthly association fee; Association fee covers amenities, common areas, structure insurance, structural maintenance, parking, roof, sewer, trash and water; Association amenities include laundry, pool, storage, trash service, vehicle wash area and elevators
Exterior
- Parking: Guest parking; Open parking; One assigned space
- Security: Secured elevator; Fire alarm
- Utilities: Cable available; Sewer and water included in association (see HOA details); Electric service
- Home design: Block construction; 3-story building; Entry on level 3; North-facing; Updated/remodeled condition; Attached property
- Construction: Built with block construction; Resale property
- Exterior features: Open porch; Porch
Interior
- Kitchen: Electric range; Dishwasher; Garbage disposal; Microwave; Refrigerator
- Bedrooms: Bedroom located on the main level
- Flooring: Ceramic tile; Vinyl
- Bathrooms: 1 full bathroom
- Heating & cooling: Central heating (electric); Central air conditioning (electric)
- Interior features: Bedroom on main level; Elevator; Combined living/dining room; Blinds; Impact glass windows
- Laundry & utility: Washer and dryer included; Shared/common area laundry
Neighborhood map
What this means for you Summary
Snapshot
- This is a 1-bed/1.0-bath condo listed at $175k.
Deal economics
- At list price, monthly cash flow is $194 ($2k/yr) — positive.
- The deal already cash-flows at list — no discount required.
- Meets the 1% rule at list price ($2k rent vs $175k).
- Recommended offer: $165k (6.0% below list) — sets the bar for market timing.
- Cap rate 8.1% vs local median 3.1% in Pompano Beach — top-decile yield for the area; either an underpriced asset or a hidden risk that comps aren't pricing in. Stress-test before assuming the spread holds.
Location & tenants
- Location reads 74/100 on livability (#284 in FL, #4,541 nationally) — a middle-class / working-renter tenant base. Strengths: commute A+, housing A+, cost of living B+; Watch: schools D+, employment D+, amenities F.
- Broward (suburban): math 42% / reading 53% proficiency, ranked #46 of 73 in FL (top 63%) — families likely to look elsewhere, expect single-tenant / working-renter base with shorter leases.
- Market conditions: Rents soft (-0.4%/yr); 843 active listings in the ZIP; 40 comparable units currently listed for rent nearby; rentals at typical pace (median 24d on market — plan ~3-4 weeks tenant-placement turnaround); solid renter incomes; 2,111 units permitted in Broward County in 2024 (1,265 in 5+ unit buildings).
- This rent runs 33% of the median local income ($84k/yr) — at the standard rent-burdened threshold; future hikes will face affordability resistance.
Forward outlook
- Local home prices are declining (-3.0%/yr); year-one equity from $1k of loan paydown is wiped out by about $5k of value loss. Plan a longer hold.
- Broward County population projected at +34% by 2050 — long-run rental-demand tailwind backs the buy-and-hold thesis.
Negotiation context
- It's been on market 71 days — a 6% lower offer ($165k) is reasonable based on typical stale-listing flexibility.
- 8 sale attempts since 7y ago with the ask held roughly flat each time — persistent listings suggest the price (not the market) is what's stuck; bring a comps-based counter.
Risks & watch-outs
- Watch-outs: flood insurance adds $66/mo; HOA is 22% of rent.
- Climate carrying-cost: major flood risk; severe wind risk, 99% chance of damaging wind over 30y; extreme-heat days projected 7→27/yr by 2055 (HVAC capex compounding) — expect insurance premiums to compound above CPI over the hold.
Questions for the listing agent
- It's been on market 71 days. Have you received any prior offers? Is the seller open to a 6% concession, seller financing, or rate buy-down credit?
- Built in 1964 — when were the roof, HVAC, electrical panel, plumbing, and water heater last replaced?
- What's the actual annual flood-insurance premium (NFIP or private), and is the property in a SFHA with mandatory coverage?
- What does the HOA fee cover, when was the last increase, and are there any pending special assessments or reserve-fund shortfalls?
- Any open or pending special assessments — roof, HVAC, plumbing, elevator, façade? What's the per-unit balance and payoff schedule, and is the seller paying it off at close or rolling it to the buyer?
- Why hasn't it sold? Are there any deal-killer items the seller is aware of (foundation, flood, title, zoning, code violations)?
- Is there a deadline driving the sale (1031 exchange, divorce, estate, relocation)? That informs how much negotiation room exists.
- Schools are D-rated, which usually means shorter tenancies and higher turnover. Who's the typical renter profile here, and what's been the actual vacancy rate?
- What's the average days-on-market for RENTAL listings here right now (not sales)? A rising rental-DOM trend means longer vacancies and softer asking-rent achievability than the comps imply.
- What's the recent tenant-quality profile in this submarket — average credit score on applications, eviction rate, late-payment / NSF rate, and stable-employment percentage? A property-management company in the area should have these aggregated.
- How much new apartment / multifamily construction is in the pipeline within 1–3 miles? Heavy new supply (>2% of stock underway) typically softens rents 12–24 months out; light construction supports rent growth.
Investment metrics
- 1% rule
- 1.33% ✓
- Cap rate
- 8.07%
- Cash-on-cash
- 6.36%
- DSCR
- 1.28
- GRM
- 6.3
CMA / ARV
No comps found within radius.
Projected returns pro-forma
-3.0% appreciation · 0.0% rent growth · sell at horizon
- IRR
- -13.3%
- Equity multiple
- 0.54×
- Total profit
- $-22,615
- Equity at exit
- $26,153
- IRR
- -12.1%
- Equity multiple
- 0.41×
- Total profit
- $-28,985
- Equity at exit
- $15,165
Cash invested: $49,112 (down + closing). Projections, not guarantees.
Landlord ↔ Tenant lean methodology
- Overall (STATE)
- 87 Strongly Landlord-Friendly
- State Florida
- 87 Strongly Landlord-Friendly · R+3
- County
- — inherits STATE
- City
- — inherits STATE
ZIP-level market 33062
- Rents YoY
- -0.4%
- Active inventory
- 843
- Price-to-rent
- 6.3×
Monthly cashflow live
- Estimated rent
- $2,332 high interval (Pro) →
- Mortgage (P&I)
- −$920
- Tax from tax record
- −$76 /mo · $915/yr
- Insurance
- −$73
- Flood insurance flood zone
- −$66 /mo · $798/yr
- HOA
- −$513
- Vacancy / Maint / Mgmt
- −$490
- Net cashflow
- $194
Break-even live
UW: 25.0% down · 7.5% · 30yr · 1.5% tax · 5.0% vac · 8.0% maint · 8.0% mgmt
Financing live
Cash to close
- Down payment
- $43,850
- Closing costs
- $5,262
- Reserves months
- —
- Total cash needed
- —
Loan-product check · same deal, 3 products live
Conventional
25% down · 7.5% · 30yr
- Down + closing
- —
- Monthly P&I
- —
- Monthly cashflow
- —
- DSCR
- —
- Eligible?
- —
Personal DTI + credit; lowest rate.
DSCR
20% down · 8.5% · 30yr
- Down + closing
- —
- Monthly P&I
- —
- Monthly cashflow
- —
- DSCR
- —
- Eligible?
- —
No personal income docs; deal must DSCR.
Hard money
10% down · 12.0% · 12mo
- Down + closing
- —
- Monthly P&I
- —
- Monthly cashflow
- —
- DSCR
- —
- Eligible?
- —
Short-term bridge; refi at stabilization.
Rent comps 40 comps
| Address | Beds | Baths | Sqft | Rent | $/sqft | DOM | Units | Dist |
|---|---|---|---|---|---|---|---|---|
| 3212 NE 7th Pl #10 Pompano Beach, FL | 1.0 | 1.0 | 508 | $1,850 | $3.64 | 14d | 1 | 0.06mi |
| 3208 NE 9th St Unit 1504009P Pompano Beach, FL | — | 1.0 | 376 | $3,004 | $7.99 | 22d | 1 | 0.13mi |
| 3204 NE 9th St Unit 1503989P Pompano Beach, FL | 2.0 | 1.0 | 440 | $2,916 | $6.62 | 3d | 2 | 0.13mi |
| 3212 NE 9th St Unit A104 Pompano Beach, FL | 1.0 | 1.0 | 630 | $2,300 | $3.65 | 24d | 1 | 0.13mi |
| 3205 NE 9th St Unit 1503950P Pompano Beach, FL | — | 1.0 | 376 | $2,899 | $7.71 | 16d | 1 | 0.15mi |
| 906 N Riverside Dr Unit 1504065P Pompano Beach, FL | — | 1.0 | 527 | $2,758 | $5.23 | 16d | 1 | 0.16mi |
| 906 N Riverside Dr Unit 1503945P Pompano Beach, FL | — | 1.0 | 527 | $2,686 | $5.10 | 19d | 1 | 0.16mi |
| 906 N Riverside Dr Unit 1-9 Pompano Beach, FL | 2.0 | 1.0 | 679 | $2,000 | $2.95 | 14d | 1 | 0.16mi |
| 3220 NE 10th St #5 Pompano Beach, FL | 1.0 | 1.0 | 560 | $1,700 | $3.04 | 24d | 1 | 0.17mi |
| 531 N Ocean Blvd #1203 Pompano Beach, FL | 1.0 | 1.0 | 700 | $2,600 | $3.71 | 24d | 1 | 0.24mi |
| 525 N Ocean Blvd #616 Pompano Beach, FL | 1.0 | 1.0 | 700 | $3,500 | $5.00 | 24d | 1 | 0.27mi |
| 525 N Ocean Blvd #1916 Pompano Beach, FL | 1.0 | 1.0 | 700 | $2,200 | $3.14 | 14d | 1 | 0.27mi |
| 1110 N Riverside Dr Pompano Beach, FL | 1.0 | 1.0 | 560 | $1,888 | $3.37 | 10d | 2 | 0.27mi |
| 1110 N Riverside Dr Pompano Beach, FL | 1.0 | 1.0 | 560 | $1,762 | $3.15 | 24d | 2 | 0.27mi |
| 3203 NE 5th St Unit 1 Pompano Beach, FL | — | 1.0 | 400 | $2,200 | $5.50 | 24d | 1 | 0.31mi |
| 505 N Riverside Dr Pompano Beach, FL | 1.0 | 1.0 | 695 | $4,100 | $5.90 | 22d | 2 | 0.34mi |
| 505 N Riverside Dr Pompano Beach, FL | 1.0 | 1.0 | 695 | $5,100 | $7.34 | 24d | 2 | 0.34mi |
| 3230 NE 13th St Pompano Beach, FL | 1.0 | 1.0 | 546 | $3,450 | $6.31 | 7d | 2 | 0.35mi |
| 400 N Riverside Dr Pompano Beach, FL | 1.0–2.0 | 1.5–2.0 | 919 | $2,400 | $2.61 | 19d | 4 | 0.41mi |
| 3201 NE 14th Street Cswy #406 Pompano Beach, FL | 1.0 | 1.0 | 650 | $1,900 | $2.92 | 14d | 1 | 0.46mi |
| 3220 NE 15th St Unit 2 Pompano Beach, FL | 1.0 | 1.0 | 650 | $2,300 | $3.54 | 24d | 1 | 0.48mi |
| 3220 NE 15th St Pompano Beach, FL | 2.0 | 1.0 | 750 | $2,995 | $3.99 | 24d | 1 | 0.48mi |
| 3240 NE 16th St #3 Pompano Beach, FL | 1.0 | 1.0 | 478 | $1,750 | $3.66 | 24d | 1 | 0.56mi |
| 3240 NE 16th St #7 Pompano Beach, FL | 1.0 | 1.0 | 478 | $1,700 | $3.56 | 24d | 1 | 0.56mi |
| 2731 NE 14th St Unit 138 Pompano Beach, FL | 1.0 | 1.5 | 710 | $2,200 | $3.10 | 24d | 1 | 0.59mi |
| 3210 Canal Dr Unit 6 Pompano Beach, FL | 1.0 | 1.0 | 540 | $1,960 | $3.63 | 24d | 1 | 0.61mi |
| 3210 Canal Dr Unit 8 Pompano Beach, FL | 1.0 | 1.0 | 540 | $2,095 | $3.88 | 24d | 1 | 0.61mi |
| 3210 Canal Dr Unit 5 Pompano Beach, FL | 1.0 | 1.0 | 540 | $1,995 | $3.69 | 24d | 1 | 0.61mi |
| 3210 Canal Dr Apt 7 Pompano Beach, FL | 1.0 | 1.0 | 540 | $1,970 | $3.65 | 24d | 1 | 0.61mi |
| 3208 Canal Dr Unit 4 Pompano Beach, FL | 1.0 | 1.0 | 540 | $1,950 | $3.61 | 24d | 1 | 0.61mi |
| 1610 N Ocean Blvd #603 Pompano Beach, FL | 1.0 | 1.0 | 740 | $3,000 | $4.05 | 24d | 1 | 0.63mi |
| 133 N Pompano Beach Blvd Pompano Beach, FL | 1.0–2.0 | 1.5–2.5 | 1065 | $3,200 | $3.00 | 24d | 6 | 0.64mi |
| 133 N Pompano Beach Blvd Pompano Beach, FL | 1.0–2.0 | 1.5–2.5 | 1065 | $2,800 | $2.63 | 4d | 7 | 0.64mi |
| 3207 Marine Dr Unit A Pompano Beach, FL | 1.0 | 1.0 | 700 | $2,100 | $3.00 | 24d | 1 | 0.71mi |
| 1061 NE 23rd Ter Unit 8 Pompano Beach, FL | 1.0 | 1.0 | 650 | $1,425 | $2.19 | 24d | 1 | 0.73mi |
| 1101 NE 23rd Ter Pompano Beach, FL | 1.0 | 1.0 | 500 | $1,600 | $3.20 | 11d | 1 | 0.73mi |
| 1101 NE 23rd Ter Unit 4 Pompano Beach, FL | 1.0 | 1.0 | 500 | $1,550 | $3.10 | 11d | 1 | 0.73mi |
| 2701 NE 1st St Pompano Beach, FL | 1.0–2.0 | 1.0 | 662 | $1,975 | $2.98 | 11d | 2 | 0.86mi |
| 101 Briny Ave #806 Pompano Beach, FL | 1.0 | 1.0 | 672 | $2,500 | $3.72 | 5d | 1 | 0.89mi |
| 101 Briny Ave #1005 Pompano Beach, FL | 1.0 | 1.0 | 672 | $3,000 | $4.46 | 24d | 1 | 0.89mi |
HOA detail condo
- Monthly dues
- $513 · $6,156/yr
- Likely covers
- waterpool
- Assessments
- None detected in remarks — confirm with the listing agent.
Listing history 27 events
-
2026-06-18days on market $175,400 Active 71 DOM
-
2026-06-17days on market $175,400 Active 70 DOM
-
2026-06-16days on market $175,400 Active 69 DOM
-
2026-06-15days on market $175,400 Active 68 DOM
-
2026-06-13days on market $175,400 Active 66 DOM
-
2026-06-09days on market $175,400 Active 62 DOM
-
2026-06-08days on market $175,400 Active 61 DOM
-
2026-06-07days on market $175,400 Active 60 DOM
-
2026-06-04days on market $175,400 Active 57 DOM
-
2026-06-03days on market $175,400 Active 56 DOM
-
2026-06-02days on market $175,400 Active 55 DOM
-
2026-06-01days on market $175,400 Active 54 DOM
-
2026-05-31days on market $175,400 Active 53 DOM
-
2026-04-06$175,400 Active
-
2026-03-30historical
-
2026-01-28price $179,900
-
2025-07-08price $184,900
-
2025-06-02$193,000 Active
-
2024-03-16historical
-
2023-03-16$210,000 Active
-
2021-04-17historical
-
2021-04-17status Active
-
2021-03-14status Active
-
2020-10-16$159,380 Active
-
2020-09-08status Active
-
2019-12-13price $149,900
-
2019-11-12$159,900 Active
ⓘ Source: listings_history table (triggers on properties + properties_extension) + one-shot
backfill from property_details.listing_events for pre-trigger history.
Tax reassessment forecast FL · Resets to sale price
- Current annual tax
- $915 · $76/mo
- Projected year-2 tax
- $1,456 · $121/mo
- Expected delta
- +$540/yr (+$45/mo · 59.0%)
ⓘ Screening estimate from a state-policy table — verify with the county assessor before closing.
Climate risk First Street
- Flood 7/10 Severe FEMA zone X (unshaded) · 94% chance over 30 yrs
- Wildfire 1/10 Low
- Heat 10/10 Extreme 7 d/yr ≥106°F today · 27 d/yr by 30 yrs out
- Wind 10/10 Extreme 99% chance of damaging wind over 30 yrs
- Air quality 2/10 Low 1 unhealthy d/yr today · 2 by 30 yrs out
Nearby sold comps map
Loading sold comps map…
Walkable amenities ~0.75 mi
Loading nearby amenities…
Taxation est. · year 1
- Rental income
- $27,985
- − Mortgage interest
- −$9,825
- − Property taxes
- −$915
- − Insurance
- −$1,674
- − Repairs & maintenance
- −$2,239
- − Management
- −$2,239
- − HOA
- −$6,156
- − Depreciation
- −$5,103
- Taxable loss
- −$166
- Est. tax savings @ 24.0%
- +$40
- After-tax cash flow
- $2,364/yr
For passive investors: Depreciation is non-cash, so a rental often shows a tax loss while cash-flowing — sheltering income. Rental losses are passive: they offset passive income freely, and up to $25,000/yr can offset ordinary (W-2) income if you actively participate and your MAGI is under $100k (phasing out to $0 by $150k); unused losses carry forward. On sale, claimed depreciation is recaptured at up to 25%, and gains may owe capital-gains tax (a 1031 exchange can defer both). Figures are a year-1 estimate at your 24.0% rate — not tax advice; consult a CPA.
Schools (NCES district)
- District
- Broward
- NCES district ID
- 1200180
- Math proficiency
- 42% ▼ -18.00%
- Reading proficiency
- 53% ▼ -5.00%
- Median HH income
- $52,139
- Composite
- 40.88/100
- National rank
- #3621
- State rank
- #46 of 73 in FL
Livability — Pompano Beach
- Score
- 74/100
- State rank
- #284
- US rank
- #4541
Category grades
Schools grade is shown separately in the Schools card above.
Census & demographics
- Census place
- Pompano Beach, FL
- County
- Broward County · 1,963,430 people
- City population
- 155,861
- Metro
- Miami-Fort Lauderdale-Pompano Beach, FL
- Population (ZIP)
- 24,920
- Household income
- $83,582
- Rent vs Own
- Severe rent burden
- 1298.0
Population outlook (Broward County) Hauer SSP2
- Today (2025)
- 2,207,033 people
- By 2030
- 2,360,704 · +7.0%
- By 2040
- 2,661,208 · +20.6%
- By 2050
- 2,946,698 · +33.5%
- By 2075
- 3,602,273 · +63.2%
- By 2100
- 3,970,984 · +79.9%
Race, ethnicity, and origin ACS 2023
- Neighborhood character
- Predominantly White (76%)
- Race & ethnicity
- White 76% Hispanic / Latino 16% Two or more races 12% Black 3%
- Hispanic origin (detail)
- Puerto Rican 4% Cuban 3%
- Common ancestry
- Romanian 4% Italian 3% Scotch-Irish 2%
- Foreign-born
- 22% · Canada, Jamaica, Dominican Republic
- Languages at home
- 74% English-only · Spanish 14% Other Indo-European 4% Russian/Polish/Slavic 2%
Political lean MEDSL · Broward
- 2024 margin
- D (+17.0) · D 58.0% · R 41.0%
- 2008→2024 swing
- -17.8pp toward R · 2008: 34.7pp · 2024: 17.0pp
- All cycles
- 2024: D+17.0 2020: D+29.8 2016: D+35.0 2012: D+34.9 2008: D+34.7
Not yet ingested
- Civics
- —
Market trends
- HPI YoY
- ▼ -427.01%
- Current HPI
- 342.9461
- Rent YoY
- ▼ -0.36%
- Metro
- Miami-Fort Lauderdale-Pompano Beach, FL
- State GDP YoY
- ▲ 3.28%
- F500 in state
- 36
Industry mix (Fortune 500 HQ in FL)
| Industry | F500 HQs | Revenue |
|---|---|---|
| Industrial Technology | 2 | $29B |
|
||
| Insurance | 2 | $17B |
|
||
| Retail | 1 | $60B |
|
||
| Technology Distribution | 1 | $58B |
|
||
| Homebuilding | 1 | $35B |
|
||
| Technology Manufacturing | 1 | $35B |
|
||
Price history
+9.7% since first listed14 events — show timeline
- 2026-04-06 Listed $175,400 MARMLS
- 2026-03-30 Listing Removed — MARMLS
- 2026-01-28 Price Changed $179,900 MARMLS
- 2025-07-08 Price Changed $184,900 MARMLS
- 2025-06-02 Listed $193,000 MARMLS
- 2024-03-16 Listing Removed — MARMLS
- 2023-03-16 Listed $210,000 MARMLS
- 2021-04-17 Listing Removed — MARMLS
- 2021-04-17 Relisted — MARMLS
- 2021-03-14 Relisted — MARMLS
- 2020-10-16 Listed $159,380 MARMLS
- 2020-09-08 Relisted — MARMLS
- 2019-12-13 Price Changed $149,900 MARMLS
- 2019-11-12 Listed $159,900 MARMLS
Property tax history
+11.1%/yrLatest (2025): $915 · +5.8% YoY. Source: county tax records.
Cash-flow waterfall
monthlySold comps — $/sqft
last 12 mo · ≤1 miLoading sold comps…