793 91st Ave N · Naples Park, FL
Flood risk 6/10 · Moderate
- FEMA flood zone
- X (shaded)
- Chance of flooding over 30 yrs
- 0.57%
- Est. flood insurance / yr
- $507 – $1,088
Fire risk 3/10 · Minor
- Est. fire insurance / yr
- $947 – $1,759
Heat risk 10/10 · Severe
- Hot days now (above 107°F)
- 7 days/yr
- Hot days in 30 yrs
- 30 days/yr
Wind risk 10/10 · Severe
- Chance of severe wind over 30 yrs
- 99.0%
Air-quality risk 2/10 · Minimal
- Unhealthy air days now
- 1 days/yr
- Unhealthy air days in 30 yrs
- 1 days/yr
Risk factors via First Street. Map © Google.
Why this score? — see what drove the B grade
The composite is a weighted blend of 9 inputs, each scored 0–100. Each bar is that input's sub-score; the figure is the points it added to the 100-point composite (weight × sub-score).
- Cash flow +30.0/30.0
- DSCR +10.0/10.0
- 1% rule +7.6/10.0
- ARV discount +7.5/15.0
- Schools +5.0/10.0
- Rent growth +4.7/5.0
- Livability +3.2/5.0
- Condition / age +2.5/5.0
- Appreciation +0.0/10.0
$620,000
🖨 Deal sheet 📄 Offer letter ✓ Due diligence
Listing remarks
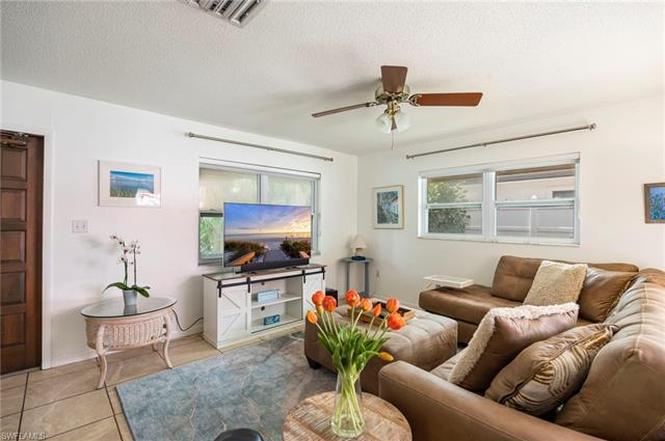
North Naples near the beach - One of the most desirable streets in Naples Park. Highest in demand, no neighbors to the South. Bike or walk to Vanderbilt Beach, Ritz-Carlton, Delnor-Wiggins Pass State Park, and Mercato. This single-family 3-bedroom 2-bath home offers an exceptional opportunity for investors, builders, or homeowners looking to customize their dream property and is surrounded by newer homes. The spacious lot offers room for a pool and outdoor entertaining area, creating your own private tropical retreat. No flood zone, no HOA fees. Whether you're looking to renovate the existing home or build your custom dream residence, this property offers incredible potential. The property
Key facts
- Walking distance
- Spacious lot
- No hoa fees
Tags
Property features AI
Finance
- Other: Lot is regular, landscaped area with central irrigation; Lot dimensions from survey (frontage 50, depth 125); Total lot area 0.14 acres; Single-unit property, single floor
- HOA & community: No HOA maintenance; Community is non-gated; No community amenities
Exterior
- Parking: Attached garage (1 car); Paved driveway
- Security: Impact resistant windows
- Utilities: Central water; Central sewer; Cable available; Electric service
- Home design: Residential single-family home; 1 story / ranch; Rear exposure facing north; Located in Naples Park
- Construction: Concrete block construction; Built in 1977
- Exterior features: Outdoor shower; Patio; Room for a pool; Stucco exterior; Impact resistant windows; Single-hung and sliding windows; Shingle roof
Interior
- Kitchen: Electric cooktop; Range; Microwave; Dishwasher; Garbage disposal; Refrigerator/freezer
- Bedrooms: 3 bedrooms (split bedroom plan)
- Flooring: Carpet; Tile
- Bathrooms: 2 full bathrooms; Master bathroom with shower (no tub)
- Heating & cooling: Central electric heat; Central electric air conditioning; Ceiling fans
- Interior features: Cable prewire; High-speed internet available; Smoke detectors; Walk-in closet(s); Great room floor plan; Split bedroom layout; Open porch/lanai; Screened lanai/porch; Laundry in garage; Dome kitchen; Dining area in living room; Unfurnished; 4 ceiling fans
- Laundry & utility: Washer; Dryer; Laundry located in garage; Auto garage door opener
Neighborhood map
What this means for you Summary
Snapshot
- This is a 3-bed/2.0-bath single-family listed at $620k.
Deal economics
- At list price, monthly cash flow is $2k ($28k/yr) — positive.
- The deal already cash-flows at list — no discount required.
- Meets the 1% rule at list price ($8k rent vs $620k).
- Recommended offer: $583k (6.0% below list) — sets the bar for market timing.
Location & tenants
- Location reads 64/100 on livability (#696 in FL) — a middle-class / working-renter tenant base. Strengths: crime A+, housing A-, employment B+; Watch: health & safety D, amenities F, commute F.
- Collier (suburban): math 60% / reading 56% proficiency, ranked #16 of 73 in FL (top 22%) — acceptable for families but not a draw, mixed tenant base, ~2y average lease.
- Zoned schools: Naples Park Elementary School (math 67% / reading 57%, grade B, #608 of 2,144 statewide, top 29%, 395 students, 48% FRL); Barron Collier High School (math 62% / reading 68%, grade B, #76 of 667 statewide, top 11%, 1,650 students, 26% FRL) — zoned schools average 37% FRL vs 55% district-wide (18 pts lower); this property's tenant base skews higher-income than the district average.
- Market conditions: Rents rising fast (+8.7%/yr); 679 active listings in the ZIP; 40 comparable units currently listed for rent nearby; rentals at typical pace (median 24d on market — plan ~3-4 weeks tenant-placement turnaround); high-income renter base; 3,520 units permitted in Collier County in 2024 (959 in 5+ unit buildings).
- At $7,819/mo this rent would consume 79% of the median local household income ($119k/yr) (locally 237% of renters already pay >50% of income on rent) — very limited rent-growth headroom before tenants either downsize or default.
Forward outlook
- Local home prices are declining (-3.0%/yr); year-one equity from $4k of loan paydown is wiped out by about $19k of value loss. Plan a longer hold.
- Collier County population projected at +30% by 2050 — long-run rental-demand tailwind backs the buy-and-hold thesis.
- At projected returns (-3.0% appreciation + 8.0% rent growth), your $174k cash investment doubles in ~6 years — after that, you're playing with house money.
Negotiation context
- It's been on market 71 days — a 6% lower offer ($583k) is reasonable based on typical stale-listing flexibility.
- Current owner paid $306k; list at $620k implies a 102% gain — meaningful room to come down on a strong offer.
Risks & watch-outs
- Climate carrying-cost: major flood risk; severe wind risk, 99% chance of damaging wind over 30y; extreme-heat days projected 7→30/yr by 2055 (HVAC capex compounding) — expect insurance premiums to compound above CPI over the hold.
Questions for the listing agent
- It's been on market 71 days. Have you received any prior offers? Is the seller open to a 6% concession, seller financing, or rate buy-down credit?
- Built in 1977 — when were the roof, HVAC, electrical panel, plumbing, and water heater last replaced?
- Why hasn't it sold? Are there any deal-killer items the seller is aware of (foundation, flood, title, zoning, code violations)?
- Is there a deadline driving the sale (1031 exchange, divorce, estate, relocation)? That informs how much negotiation room exists.
- Schools are F-rated, which usually means shorter tenancies and higher turnover. Who's the typical renter profile here, and what's been the actual vacancy rate?
- What's the average days-on-market for RENTAL listings here right now (not sales)? A rising rental-DOM trend means longer vacancies and softer asking-rent achievability than the comps imply.
- What's the recent tenant-quality profile in this submarket — average credit score on applications, eviction rate, late-payment / NSF rate, and stable-employment percentage? A property-management company in the area should have these aggregated.
- How much new for-sale + rental construction is in the pipeline within 1–3 miles? Heavy new supply typically softens prices + rents 12–24 months out; constrained supply supports both.
Investment metrics
- 1% rule
- 1.26% ✓
- Cap rate
- 10.81%
- Cash-on-cash
- 16.12%
- DSCR
- 1.72
- GRM
- 6.6
CMA / ARV
No comps found within radius.
Projected returns pro-forma
-3.0% appreciation · 8.0% rent growth · sell at horizon
- IRR
- 12.2%
- Equity multiple
- 1.51×
- Total profit
- $89,223
- Equity at exit
- $92,444
- IRR
- 24.6%
- Equity multiple
- 3.63×
- Total profit
- $456,397
- Equity at exit
- $53,606
Cash invested: $173,600 (down + closing). Projections, not guarantees.
Landlord ↔ Tenant lean methodology
- Overall (STATE)
- 87 Strongly Landlord-Friendly
- State Florida
- 87 Strongly Landlord-Friendly · R+3
- County
- — inherits STATE
- City
- — inherits STATE
ZIP-level market 34108
- Rents YoY
- 8.7%
- Active inventory
- 679
- Price-to-rent
- 6.6×
Monthly cashflow live
- Estimated rent
- $7,819 high interval (Pro) →
- Mortgage (P&I)
- −$3,251
- Tax from tax record
- −$336 /mo · $4,029/yr
- Insurance
- −$258
- HOA
- −$0
- Vacancy / Maint / Mgmt
- −$1,642
- Net cashflow
- $2,332
Break-even live
UW: 25.0% down · 7.5% · 30yr · 1.5% tax · 5.0% vac · 8.0% maint · 8.0% mgmt
Financing live
Cash to close
- Down payment
- $155,000
- Closing costs
- $18,600
- Reserves months
- —
- Total cash needed
- —
Loan-product check · same deal, 3 products live
Conventional
25% down · 7.5% · 30yr
- Down + closing
- —
- Monthly P&I
- —
- Monthly cashflow
- —
- DSCR
- —
- Eligible?
- —
Personal DTI + credit; lowest rate.
DSCR
20% down · 8.5% · 30yr
- Down + closing
- —
- Monthly P&I
- —
- Monthly cashflow
- —
- DSCR
- —
- Eligible?
- —
No personal income docs; deal must DSCR.
Hard money
10% down · 12.0% · 12mo
- Down + closing
- —
- Monthly P&I
- —
- Monthly cashflow
- —
- DSCR
- —
- Eligible?
- —
Short-term bridge; refi at stabilization.
Rent comps 40 comps
| Address | Beds | Baths | Sqft | Rent | $/sqft | DOM | Units | Dist |
|---|---|---|---|---|---|---|---|---|
| 749 91st Ave N Naples, FL | 3.0 | 3.0 | 1417 | $3,750 | $2.65 | 13d | 1 | 0.07mi |
| 822 Gulf Pavilion Dr #202 Naples, FL | 2.0 | 2.0 | 1275 | $6,500 | $5.10 | 23d | 1 | 0.09mi |
| 737 91st Ave N Naples, FL | 3.0 | 2.0 | 1566 | $12,750 | $8.14 | 23d | 1 | 0.10mi |
| 815 Gulf Pavilion Dr #203 Naples, FL | 2.0 | 2.0 | 1179 | $3,500 | $2.97 | 23d | 1 | 0.12mi |
| 834 Gulf Pavilion Dr #204 Naples, FL | 2.0 | 2.0 | 1516 | $5,000 | $3.30 | 21d | 1 | 0.13mi |
| 834 Gulf Pavilion Dr #204 Naples, FL | 2.0 | 2.0 | 1516 | $8,000 | $5.28 | 23d | 1 | 0.13mi |
| 840 Gulf Pavilion Dr #103 Naples, FL | 2.0 | 2.0 | 1179 | $5,500 | $4.66 | 23d | 1 | 0.15mi |
| 736 94th Ave N Naples, FL | 3.0 | 2.0 | 1820 | $3,500 | $1.92 | 23d | 1 | 0.16mi |
| 791 94th Ave N Naples, FL | 3.0 | 2.0 | 1400 | $9,000 | $6.43 | 23d | 1 | 0.16mi |
| 799 94th Ave N Naples, FL | 3.0 | 2.0 | 1674 | $5,000 | $2.99 | 23d | 1 | 0.17mi |
| 829 Reef Point Cir Unit 46 Naples, FL | 2.0 | 2.0 | 1359 | $7,500 | $5.52 | 23d | 1 | 0.17mi |
| 794 95th Ave N Naples, FL | 3.0 | 2.0 | 1805 | $6,500 | $3.60 | 23d | 1 | 0.19mi |
| 857 Reef Point Cir Naples, FL | 2.0 | 2.0 | 1359 | $7,500 | $5.52 | 23d | 1 | 0.20mi |
| 845 Reef Point Cir Naples, FL | 2.0 | 2.0 | 1359 | $4,200 | $3.09 | 23d | 1 | 0.21mi |
| 881 Gulf Pavilion Dr #201 Naples, FL | 2.0 | 2.0 | 1516 | $7,500 | $4.95 | 23d | 1 | 0.22mi |
| 757 95th Ave N Naples, FL | 2.0 | 2.0 | 1100 | $2,150 | $1.95 | 23d | 1 | 0.22mi |
| 719 Reef Point Cir #13 Naples, FL | 2.0 | 2.0 | 1343 | $8,000 | $5.96 | 23d | 1 | 0.25mi |
| 768 96th Ave N Naples, FL | 3.0 | 2.0 | 1735 | $11,500 | $6.63 | 23d | 1 | 0.25mi |
| 717 95th Ave N Unit 1 Naples, FL | 2.0 | 1.0 | 1500 | $2,100 | $1.40 | 23d | 1 | 0.27mi |
| 714 Reef Point Cir Naples, FL | 2.0 | 2.0 | 1347 | $8,500 | $6.31 | 13d | 1 | 0.28mi |
| 682 95th Ave N Naples, FL | 3.0 | 2.0 | 1600 | $12,500 | $7.81 | 23d | 1 | 0.31mi |
| 671 94th Ave N Naples, FL | 3.0 | 2.0 | 1464 | $6,800 | $4.64 | 23d | 1 | 0.32mi |
| 650 93rd Ave N Unit 1073498P Naples, FL | 3.0 | 2.0 | 1442 | $5,136 | $3.56 | 13d | 1 | 0.32mi |
| 661 Windsurf Ln Unit A-202 Naples, FL | 2.0 | 2.0 | 1350 | $7,500 | $5.56 | 13d | 1 | 0.34mi |
| 793 97th Ave N Naples, FL | 3.0 | 2.0 | 1700 | $10,500 | $6.18 | 23d | 1 | 0.34mi |
| 655 Windsurf Ln Unit 1546357P Naples, FL | 3.0 | 2.0 | 1442 | $3,376 | $2.34 | 13d | 1 | 0.35mi |
| 795 Bentwater Cir #204 Naples, FL | 3.0 | 2.0 | 1831 | $15,000 | $8.19 | 23d | 1 | 0.36mi |
| 805 Bentwater Cir #104 Naples, FL | 3.0 | 2.5 | 1831 | $14,500 | $7.92 | 23d | 1 | 0.37mi |
| 649 Beachwalk Cir Unit C101 Naples, FL | 3.0 | 2.0 | 1450 | $7,500 | $5.17 | 13d | 1 | 0.38mi |
| 8385 Excalibur Cir Unit G3 Naples, FL | 2.0 | 2.0 | 1382 | $10,000 | $7.24 | 23d | 1 | 0.40mi |
| 645 95th Ave N Unit 1 Naples, FL | 3.0 | 2.0 | 957 | $2,750 | $2.87 | 13d | 1 | 0.40mi |
| 648 96th Ave N Naples, FL | 3.0 | 2.0 | 1768 | $12,000 | $6.79 | 23d | 1 | 0.41mi |
| 522 Beachwalk Cir Naples, FL | 2.0 | 2.0 | 1359 | $6,000 | $4.42 | 23d | 1 | 0.41mi |
| 643 Beachwalk Cir Unit D-202 Naples, FL | 2.0 | 2.0 | 1350 | $5,950 | $4.41 | 13d | 1 | 0.41mi |
| 630 95th Ave N Unit S Naples, FL | 3.0 | 2.0 | 1411 | $5,500 | $3.90 | 23d | 1 | 0.41mi |
| 630 95th Ave N Unit A Naples, FL | 3.0 | 2.0 | 1411 | $2,995 | $2.12 | 23d | 1 | 0.41mi |
| 856 98th Ave N Naples, FL | 3.0 | 2.0 | 1711 | $4,500 | $2.63 | 23d | 1 | 0.42mi |
| 9123 Strada Pl Naples, FL | 1.0–2.0 | 1.0–2.0 | 1267 | $14,000 | $11.05 | 13d | 6 | 0.44mi |
| 549 Beachwalk Cir Naples, FL | 2.0 | 2.0 | 1359 | $7,500 | $5.52 | 23d | 1 | 0.44mi |
| 684 98th Ave N Naples, FL | 3.0 | 2.0 | 1702 | $4,500 | $2.64 | 13d | 1 | 0.44mi |
Listing history 8 events
-
2026-06-18days on market $620,000 Active 71 DOM
-
2026-06-17days on market $620,000 Active 70 DOM
-
2026-06-16status $620,000 Active 69 DOM
-
2026-05-19status Pending
-
2026-05-11price $620,000
-
2026-03-11$649,000 Active
-
2022-09-16soldstatus $306,500
-
1983-06-01soldstatus $65,000
ⓘ Source: listings_history table (triggers on properties + properties_extension) + one-shot
backfill from property_details.listing_events for pre-trigger history.
Tax reassessment forecast FL · Resets to sale price
- Current annual tax
- $4,029 · $336/mo
- Projected year-2 tax
- $5,146 · $429/mo
- Expected delta
- +$1,117/yr (+$93/mo · 27.7%)
ⓘ Screening estimate from a state-policy table — verify with the county assessor before closing.
Climate risk First Street
- Flood 6/10 Major FEMA zone X (shaded) · 57% chance over 30 yrs
- Wildfire 3/10 Moderate
- Heat 10/10 Extreme 7 d/yr ≥107°F today · 30 d/yr by 30 yrs out
- Wind 10/10 Extreme 99% chance of damaging wind over 30 yrs
- Air quality 2/10 Low 1 unhealthy d/yr today · 1 by 30 yrs out
Nearby sold comps map
Loading sold comps map…
Walkable amenities ~0.75 mi
Loading nearby amenities…
Taxation est. · year 1
- Rental income
- $93,832
- − Mortgage interest
- −$34,730
- − Property taxes
- −$4,029
- − Insurance
- −$3,100
- − Repairs & maintenance
- −$7,507
- − Management
- −$7,507
- − Depreciation
- −$18,036
- Taxable income
- $18,924
- Est. tax owed @ 24.0%
- −$4,542
- After-tax cash flow
- $23,441/yr
For passive investors: Depreciation is non-cash, so a rental often shows a tax loss while cash-flowing — sheltering income. Rental losses are passive: they offset passive income freely, and up to $25,000/yr can offset ordinary (W-2) income if you actively participate and your MAGI is under $100k (phasing out to $0 by $150k); unused losses carry forward. On sale, claimed depreciation is recaptured at up to 25%, and gains may owe capital-gains tax (a 1031 exchange can defer both). Figures are a year-1 estimate at your 24.0% rate — not tax advice; consult a CPA.
Schools (NCES district)
- District
- Collier
- NCES district ID
- 1200330
- Math proficiency
- 60% ▼ -4.00%
- Reading proficiency
- 56% ▼ -2.00%
- Median HH income
- $58,275
- Composite
- 50.23/100
- National rank
- #1892
- State rank
- #16 of 73 in FL
Livability — Naples Park
- Score
- 64/100
- State rank
- #696
- US rank
- #14564
Category grades
Schools grade is shown separately in the Schools card above.
Census & demographics
- Census place
- Naples Park, FL
- County
- Collier County · 396,295 people
- Metro
- Naples-Marco Island, FL
- Population (ZIP)
- 16,237
- Household income
- $119,212
- Rent vs Own
- Severe rent burden
- 237.0
Population outlook (Collier County) Hauer SSP2
- Today (2025)
- 420,858 people
- By 2030
- 450,054 · +6.9%
- By 2040
- 502,232 · +19.3%
- By 2050
- 544,932 · +29.5%
- By 2075
- 627,203 · +49.0%
- By 2100
- 659,015 · +56.6%
Race, ethnicity, and origin ACS 2023
- Neighborhood character
- Predominantly White (87%)
- Race & ethnicity
- White 87% Hispanic / Latino 8% Two or more races 7% Asian 1% Black 1%
- Hispanic origin (detail)
- Mexican 2% Cuban 3%
- Common ancestry
- Romanian 5% Lithuanian 3% Slovak 3%
- Foreign-born
- 16% · Canada, Dominican Republic, South Korea
- Languages at home
- 86% English-only · Spanish 6% Russian/Polish/Slavic 2% Other Indo-European 2%
Political lean MEDSL · Collier
- 2024 margin
- Solid R (+33.1) · D 33.1% · R 66.2%
- 2008→2024 swing
- -10.6pp toward R · 2008: -22.5pp · 2024: -33.1pp
- All cycles
- 2024: R+33.1 2020: R+24.7 2016: R+26.0 2012: R+30.1 2008: R+22.5
Not yet ingested
- Civics
- —
Market trends
- HPI YoY
- ▼ -587.97%
- Current HPI
- 275.1872
- Rent YoY
- ▲ 8.74%
- Metro
- Naples-Marco Island, FL
- State GDP YoY
- ▲ 3.28%
- F500 in state
- 36
Industry mix (Fortune 500 HQ in FL)
| Industry | F500 HQs | Revenue |
|---|---|---|
| Industrial Technology | 2 | $29B |
|
||
| Insurance | 2 | $17B |
|
||
| Retail | 1 | $60B |
|
||
| Technology Distribution | 1 | $58B |
|
||
| Homebuilding | 1 | $35B |
|
||
| Technology Manufacturing | 1 | $35B |
|
||
Price history
+853.8% since first listed5 events — show timeline
- 2026-05-19 Pending — NAPLESMLS
- 2026-05-11 Price Changed $620,000 NAPLESMLS
- 2026-03-11 Listed $649,000 NAPLESMLS
- 2022-09-16 Sold (Public Records) $306,500 Public Records
- 1983-06-01 Sold (Public Records) $65,000 Public Records
Property tax history
+18.1%/yrLatest (2025): $4,029 · -7.1% YoY. Source: county tax records.
Cash-flow waterfall
monthlySold comps — $/sqft
last 12 mo · ≤1 miLoading sold comps…