141 N Fillmore Ave N #10 · Sterling, VA
Flood risk 1/10 · Minimal
- FEMA flood zone
- X (unshaded)
- Chance of flooding over 30 yrs
- 0.0%
- Est. flood insurance / yr
- $507 – $1,088
Fire risk 1/10 · Minimal
- Est. fire insurance / yr
- $666 – $1,236
Heat risk 7/10 · Major
- Hot days now (above 103°F)
- 7 days/yr
- Hot days in 30 yrs
- 16 days/yr
Wind risk 4/10 · Minor
- Chance of severe wind over 30 yrs
- 11.0%
Air-quality risk 2/10 · Minimal
- Unhealthy air days now
- 1 days/yr
- Unhealthy air days in 30 yrs
- 2 days/yr
Risk factors via First Street. Map © Google.
Why this score? — see what drove the D grade
The composite is a weighted blend of 9 inputs, each scored 0–100. Each bar is that input's sub-score; the figure is the points it added to the 100-point composite (weight × sub-score).
- Cash flow +10.2/30.0
- ARV discount +7.5/15.0
- Schools +6.7/10.0
- Rent growth +4.6/5.0
- 1% rule +4.2/10.0
- Livability +4.0/5.0
- DSCR +2.9/10.0
- Condition / age +2.5/5.0
- Appreciation +0.0/10.0
$250,000
🖨 Deal sheet (PDF) 📄 Offer letter ✓ Due diligence
Listing remarks
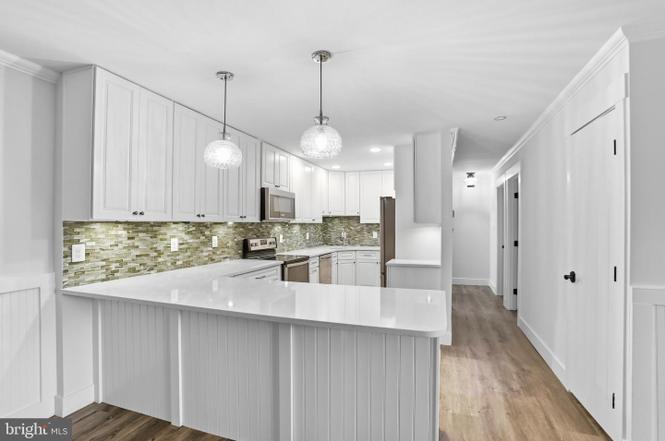
Top-floor condo in Pembrooke of Loudoun with impressive updates throughout! This 2-bedroom, 1-bath home is move-in ready and offers quality finishes throughout. The kitchen was expanded and fully renovated in 2018, featuring white cabinetry, quartz countertops, stainless steel appliances, and a peninsula with bar seating — a wonderful space for cooking and entertaining. The open floor plan flows beautifully with luxury vinyl plank flooring, and the living room's sliding glass door opens to a Juliet balcony, bringing in great natural light. The primary bedroom offers a generous walk-in closet, and the entire unit has just been freshly painted, making it truly turnkey. Bonus storage wit
Key facts
- Quartz countertops
- Top-floor condo
- Expanded kitchen
Tags
Neighborhood map
What this means for you Summary
Snapshot
- This is a 2-bed/2.0-bath condo listed at $250k.
Deal economics
- At list price, monthly cash flow is $-140 ($-2k/yr) — negative.
- To cash-flow at today's rent, offer at most $225k (9.9% below list).
- To meet the 1% rule (rent ≥ 1% of price), the offer needs to be $229k (8.4% below list).
- Recommended offer: $225k (9.9% below list) — sets the bar for cash-flow.
- Cap rate 5.6% vs local median 3.5% in Sterling — top-decile yield for the area; either an underpriced asset or a hidden risk that comps aren't pricing in. Stress-test before assuming the spread holds.
Location & tenants
- Location reads 81/100 on livability (#57 in VA, #1,551 nationally) — a professional / high-income tenant draw. Strengths: employment A+, housing A+, health & safety A+; Watch: commute F, cost of living F.
- Loudoun County Public School District (suburban): math 64% / reading 79% proficiency, ranked #7 of 131 in VA (top 5%) — strong family-tenant draw, lease renewals of 3-5y typical; only 12% free/reduced lunch — higher-income household profile.
- Zoned schools: Sully Elementary (math 32% / reading 41%, grade F, #953 of 1,108 statewide, top 86%, 462 students, 93% FRL); Sterling Middle (math 22% / reading 51%, grade F, #320 of 342 statewide, top 95%, 1,037 students, 83% FRL); Park View High (math 41% / reading 73%, grade C, #263 of 319 statewide, top 84%, 1,455 students, 90% FRL) — zoned schools average 89% FRL vs 12% district-wide (76 pts higher); higher-poverty schools than district average — tighter screening recommended.
- Zoned-school proficiency averages 43% at this address vs 72% district-wide (-28 pts) — the specific schools serving this property underperform the Loudoun County Public School District average; the district grade overstates school quality for this exact location.
- Market conditions: Rents rising fast (+8.2%/yr); 99 active listings in the ZIP; 17 comparable units currently listed for rent nearby; rentals at typical pace (median 21d on market — plan ~3-4 weeks tenant-placement turnaround); 41% of comp listings sitting > 30 days — soft ceiling on asking rent; high-income renter base; 3,317 units permitted in Loudoun County in 2024 (1,818 in 5+ unit buildings).
Forward outlook
- Local home prices are declining (-3.0%/yr); year-one equity from $2k of loan paydown is wiped out by about $8k of value loss. Plan a longer hold.
- Loudoun County population projected at +65% by 2050 — long-run rental-demand tailwind backs the buy-and-hold thesis.
Negotiation context
- Only 10 days on market — expect competitive offers; lowballing is unlikely to land.
- 2 sale attempts since 26y ago with the ask held roughly flat each time — persistent listings suggest the price (not the market) is what's stuck; bring a comps-based counter.
Risks & watch-outs
- Climate carrying-cost: extreme-heat days projected 7→16/yr by 2055 (HVAC capex compounding) — expect insurance premiums to compound above CPI over the hold.
Questions for the listing agent
- What do current leases actually rent for vs. the listed asking? Can we see a recent rent roll and the last 12 months of T-12 income?
- Built in 1965 — when were the roof, HVAC, electrical panel, plumbing, and water heater last replaced?
- What does the HOA fee cover, when was the last increase, and are there any pending special assessments or reserve-fund shortfalls?
- Any open or pending special assessments — roof, HVAC, plumbing, elevator, façade? What's the per-unit balance and payoff schedule, and is the seller paying it off at close or rolling it to the buyer?
- Is there a deadline driving the sale (1031 exchange, divorce, estate, relocation)? That informs how much negotiation room exists.
- Schools are A-rated — typically a magnet for longer-tenancy family renters. What's the average tenant stay here, and is there a school-zone premium baked into asking?
- The area grade is low — what's the realistic commute time and amenity access for the typical tenant pool here? Any planned neighborhood developments (good or bad) we should know about?
- What's the average days-on-market for RENTAL listings here right now (not sales)? A rising rental-DOM trend means longer vacancies and softer asking-rent achievability than the comps imply.
- What's the recent tenant-quality profile in this submarket — average credit score on applications, eviction rate, late-payment / NSF rate, and stable-employment percentage? A property-management company in the area should have these aggregated.
- How much new apartment / multifamily construction is in the pipeline within 1–3 miles? Heavy new supply (>2% of stock underway) typically softens rents 12–24 months out; light construction supports rent growth.
Investment metrics
- 1% rule
- 0.92% ✗
- Cap rate
- 5.62%
- Cash-on-cash
- -2.40%
- DSCR
- 0.89
- GRM
- 9.1
CMA / ARV
No comps found within radius.
Projected returns pro-forma
-3.0% appreciation · 8.0% rent growth · sell at horizon
- IRR
- -14.1%
- Equity multiple
- 0.47×
- Total profit
- $-37,140
- Equity at exit
- $37,276
- IRR
- 1.9%
- Equity multiple
- 1.17×
- Total profit
- $11,991
- Equity at exit
- $21,615
Cash invested: $70,000 (down + closing). Projections, not guarantees.
Landlord ↔ Tenant lean methodology
- Overall (STATE)
- 55 Moderately Landlord-Leaning
- State Virginia
- 55 Moderately Landlord-Leaning · D+2
- County
- — inherits STATE
- City
- — inherits STATE
ZIP-level market 20164
- Rents YoY
- 8.2%
- Active inventory
- 99
- Price-to-rent
- 9.1×
Monthly cashflow live
- Estimated rent
- $2,291 high interval (Pro) →
- Mortgage (P&I)
- −$1,311
- Tax from tax record
- −$165 /mo · $1,975/yr
- Insurance
- −$104
- HOA
- −$370
- Vacancy / Maint / Mgmt
- −$481
- Net cashflow
- $-140
Break-even live
Sensitivity live
| Price | -10% $2 | -5% $-69 | +0% $-140 | +5% $-211 | +10% $-281 |
|---|---|---|---|---|---|
| Rent | -10% $-321 | -5% $-230 | +0% $-140 | +5% $-49 | +10% $41 |
| Rate | -1.0pp $-14 | -0.5pp $-76 | base $-140 | +0.5pp $-205 | +1.0pp $-271 |
UW: 25.0% down · 7.5% · 30yr · 1.5% tax · 5.0% vac · 8.0% maint · 8.0% mgmt
Financing live
Cash to close
- Down payment
- $62,500
- Closing costs
- $7,500
- Reserves months
- —
- Total cash needed
- —
Loan-product check · same deal, 3 products live
Conventional
25% down · 7.5% · 30yr
- Down + closing
- —
- Monthly P&I
- —
- Monthly cashflow
- —
- DSCR
- —
- Eligible?
- —
Personal DTI + credit; lowest rate.
DSCR
20% down · 8.5% · 30yr
- Down + closing
- —
- Monthly P&I
- —
- Monthly cashflow
- —
- DSCR
- —
- Eligible?
- —
No personal income docs; deal must DSCR.
Hard money
10% down · 12.0% · 12mo
- Down + closing
- —
- Monthly P&I
- —
- Monthly cashflow
- —
- DSCR
- —
- Eligible?
- —
Short-term bridge; refi at stabilization.
Rent comps 17 comps
| Address | Beds | Baths | Sqft | Rent | $/sqft | DOM | Units | Dist |
|---|---|---|---|---|---|---|---|---|
| 121 N Fillmore Ave #1 Sterling, VA | 2.0 | 1.0 | 936 | $2,000 | $2.14 | 19d | 1 | 0.02mi |
| 125 N Garfield Rd Sterling, VA | 3.0 | 2.0 | 1440 | $2,800 | $1.94 | 0d | 1 | 0.09mi |
| 131 N Garfield Rd Sterling, VA | 1.0 | 1.0 | 1356 | $1,295 | $0.96 | 45d | 1 | 0.12mi |
| 131 N Garfield Rd Unit 1 Sterling, VA | 1.0 | 1.0 | 900 | $1,299 | $1.44 | 45d | 1 | 0.12mi |
| 22355 Providence Village Dr Sterling, VA | 1.0–2.0 | 1.0–2.0 | 742 | $2,395 | $3.23 | 7d | 22 | 0.14mi |
| 332 Lancaster Sq Sterling, VA | 2.0 | 1.0 | 840 | $1,950 | $2.32 | 45d | 1 | 0.22mi |
| 103 Saint Charles Sq Sterling, VA | 2.0 | 1.0 | 1078 | $2,500 | $2.32 | 0d | 1 | 0.40mi |
| 1212 Chase Heritage Cir Sterling, VA | 1.0–2.0 | 1.0–2.0 | 1002 | $2,933 | $2.93 | 0d | 11 | 1.06mi |
| 1179 Dublin Pl Herndon, VA | 3.0 | 2.5 | 1240 | $2,700 | $2.18 | 22d | 1 | 1.17mi |
| 1724 Fantasia Cir Herndon, VA | 3.0 | 2.0 | 1400 | $3,300 | $2.36 | 45d | 1 | 1.18mi |
| 1308 Wexford Ct Herndon, VA | 3.0 | 2.5 | 1240 | $2,650 | $2.14 | 45d | 1 | 1.22mi |
| 1030 Margate Ct Sterling, VA | 2.0 | 1.5 | 1162 | $2,100 | $1.81 | 0d | 1 | 1.26mi |
| 1029 Margate Ct Sterling, VA | 1.0 | 1.5 | 1162 | $1,200 | $1.03 | 17d | 1 | 1.27mi |
| 1017 Brixton Ct Unit 1017 Sterling, VA | 1.0 | 1.0 | 1000 | $1,200 | $1.20 | 20d | 1 | 1.31mi |
| 46858 Clarion Ter Sterling, VA | 2.0 | 2.5 | 1260 | $2,450 | $1.94 | 45d | 1 | 1.33mi |
| 46051 Marble Ter Sterling, VA | 3.0 | 2.0 | 1200 | $3,000 | $2.50 | 4d | 1 | 1.38mi |
| 22987 Fontwell Sq Sterling, VA | 1.0 | 1.0 | 1460 | $1,200 | $0.82 | 45d | 1 | 1.49mi |
HOA detail condo
- Monthly dues
- $370 · $4,440/yr
- Assessments
- None detected in remarks — confirm with the listing agent.
Listing history 9 events
-
2026-04-08status Pending
-
2026-03-08historical Active Under Contract
-
2026-02-26$250,000 Active
-
2000-05-26soldstatus $599,000
-
2000-05-26soldstatus $59,900
-
2000-05-25soldstatus $59,900
-
2000-04-27historical
-
2000-04-14$61,900
-
1987-05-11soldstatus $59,000
ⓘ Source: listings_history table (triggers on properties + properties_extension) + one-shot
backfill from property_details.listing_events for pre-trigger history.
Tax reassessment forecast VA · Resets to sale price
- Current annual tax
- $1,975 · $165/mo
- Projected year-2 tax
- $2,050 · $171/mo
- Expected delta
- +$75/yr (+$6/mo · 3.8%)
ⓘ Screening estimate from a state-policy table — verify with the county assessor before closing.
Climate risk First Street
- Flood 1/10 Low FEMA zone X (unshaded) · 0% chance over 30 yrs
- Wildfire 1/10 Low
- Heat 7/10 Severe 7 d/yr ≥103°F today · 16 d/yr by 30 yrs out
- Wind 4/10 Moderate 11% chance of damaging wind over 30 yrs
- Air quality 2/10 Low 1 unhealthy d/yr today · 2 by 30 yrs out
Nearby sold comps map
Loading sold comps map…
Walkable amenities ~0.75 mi
Loading nearby amenities…
Taxation est. · year 1
- Rental income
- $27,492
- − Mortgage interest
- −$14,004
- − Property taxes
- −$1,975
- − Insurance
- −$1,250
- − Repairs & maintenance
- −$2,199
- − Management
- −$2,199
- − HOA
- −$4,440
- − Depreciation
- −$7,273
- Taxable loss
- −$5,848
- Est. tax savings @ 24.0%
- +$1,404
- After-tax cash flow
- $-275/yr
For passive investors: Depreciation is non-cash, so a rental often shows a tax loss while cash-flowing — sheltering income. Rental losses are passive: they offset passive income freely, and up to $25,000/yr can offset ordinary (W-2) income if you actively participate and your MAGI is under $100k (phasing out to $0 by $150k); unused losses carry forward. On sale, claimed depreciation is recaptured at up to 25%, and gains may owe capital-gains tax (a 1031 exchange can defer both). Figures are a year-1 estimate at your 24.0% rate — not tax advice; consult a CPA.
Schools (NCES district)
- District
- Loudoun County Public School District
- NCES district ID
- 5102250
- Math proficiency
- 64% ▼ -22.00%
- Reading proficiency
- 79% ▼ -5.00%
- Median HH income
- $121,927
- Composite
- 67.43/100
- National rank
- #379
- State rank
- #7 of 131 in VA
Livability — Sterling
- Score
- 81/100
- State rank
- #57
- US rank
- #1551
Category grades
Schools grade is shown separately in the Schools card above.
Census & demographics
- Census place
- Sterling, VA
- County
- Loudoun County · 393,062 people
- City population
- 92,473
- Metro
- Washington-Arlington-Alexandria, DC-VA-MD-WV
- Population (ZIP)
- 43,436
- Household income
- $135,660
- Rent vs Own
- Severe rent burden
- 579.0
Population outlook (Loudoun County) Hauer SSP2
- Today (2025)
- 503,590 people
- By 2030
- 568,852 · +13.0%
- By 2040
- 701,480 · +39.3%
- By 2050
- 828,841 · +64.6%
- By 2075
- 1,105,645 · +119.6%
- By 2100
- 1,265,472 · +151.3%
Race, ethnicity, and origin ACS 2023
- Neighborhood character
- Diverse neighborhood (Simpson 0.67)
- Race & ethnicity
- Hispanic / Latino 46% White 30% Two or more races 20% Asian 14% Black 7% Native American 1%
- Hispanic origin (detail)
- Mexican 3%
- Common ancestry
- Italian 2% Lithuanian 2% Romanian 1%
- Foreign-born
- 43% · Canada, Vietnam, Jamaica
- Languages at home
- 41% English-only · Spanish 41% Other Indo-European 8% Arabic 2%
Political lean MEDSL · Loudoun
- 2024 margin
- D (+16.3) · D 56.6% · R 40.4% · Other 3.0%
- 2008→2024 swing
- +8.0pp toward D · 2008: 8.2pp · 2024: 16.3pp
- All cycles
- 2024: D+16.3 2020: D+25.0 2016: D+16.8 2012: D+4.5 2008: D+8.2
Not yet ingested
- Civics
- —
Market trends
- HPI YoY
- ▼ -375.79%
- Current HPI
- 369.4596
- Rent YoY
- ▲ 8.22%
- Metro
- Washington-Arlington-Alexandria, DC-VA-MD-WV
- State GDP YoY
- ▲ 2.40%
- F500 in state
- 50
Industry mix (Fortune 500 HQ in VA)
| Industry | F500 HQs | Revenue |
|---|---|---|
| Aerospace / Defense | 4 | $236B |
|
||
| Technology / Defense | 3 | $32B |
|
||
| Financial Services | 2 | $176B |
|
||
| Utilities | 2 | $27B |
|
||
| Insurance | 2 | $25B |
|
||
| Technology | 2 | $15B |
|
||
Price history
+323.7% since first listed9 events — show timeline
- 2026-04-08 Pending — BRIGHT MLS
- 2026-03-08 Contingent — BRIGHT MLS
- 2026-02-26 Listed $250,000 BRIGHT MLS
- 2000-05-26 Sold (Public Records) $59,900 Public Records
- 2000-05-26 Sold (Public Records) $599,000 Public Records
- 2000-05-25 Sold (MLS) $59,900 MRIS
- 2000-04-27 Delisted — MRIS
- 2000-04-14 Listed $61,900 MRIS
- 1987-05-11 Sold (Public Records) $59,000 Public Records
Property tax history
-0.8%/yrLatest (2025): $1,975 · -6.5% YoY. Source: county tax records.
Cash-flow waterfall
monthlySold comps — $/sqft
last 12 mo · ≤1 miLoading sold comps…