 Multi-family
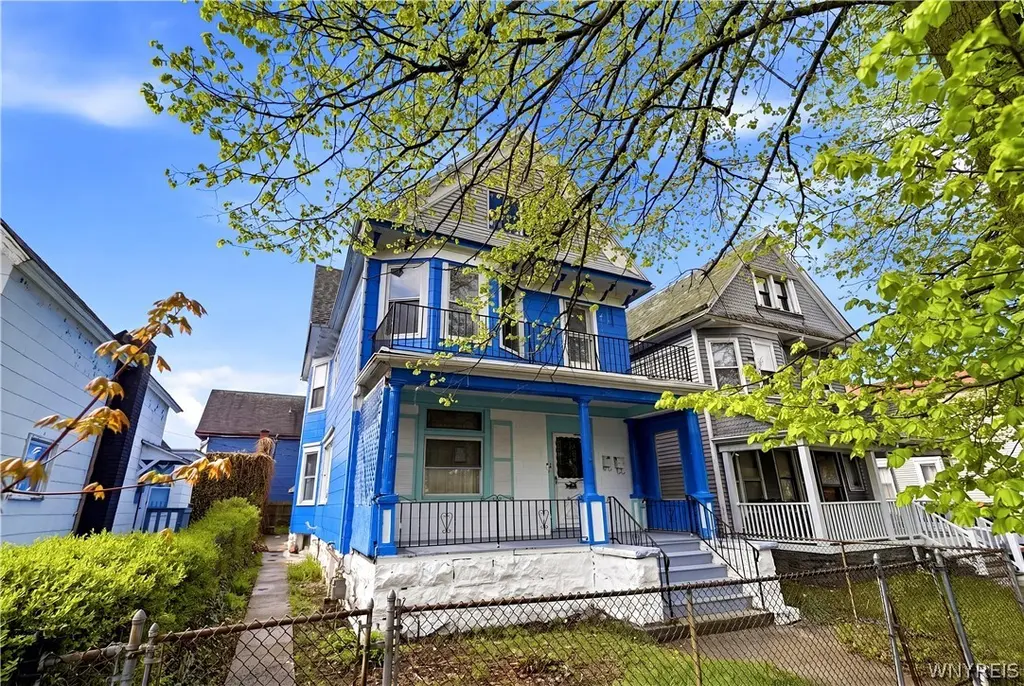
375 Glenwood Ave · Buffalo, NY
Flood risk 1/10 · Minimal
- FEMA flood zone
- X (unshaded)
- Chance of flooding over 30 yrs
- 0.0%
- Est. flood insurance / yr
- $473 – $860
Fire risk 1/10 · Minimal
- Est. fire insurance / yr
- $691 – $1,283
Heat risk 3/10 · Minor
- Hot days now (above 91°F)
- 7 days/yr
- Hot days in 30 yrs
- 15 days/yr
Wind risk 1/10 · Minimal
- Chance of severe wind over 30 yrs
- —
Air-quality risk 4/10 · Minor
- Unhealthy air days now
- 4 days/yr
- Unhealthy air days in 30 yrs
- 9 days/yr
Risk factors via First Street. Map © Google.
Why this score? — see what drove the B- grade
The composite is a weighted blend of 9 inputs, each scored 0–100. Each bar is that input's sub-score; the figure is the points it added to the 100-point composite (weight × sub-score).
- Cash flow +30.0/30.0
- 1% rule +10.0/10.0
- DSCR +10.0/10.0
- Condition / age +4.0/5.0
- Livability +3.9/5.0
- Schools +3.3/10.0
- Rent growth +2.5/5.0
- ARV discount +2.3/15.0
- Appreciation +0.0/10.0
$199,000
🖨 Deal sheet 📄 Offer letter ✓ Due diligence
Multi-family units
County records classify this as Multi-Family (2-4 Unit). Listing-text estimate: 1 unit. estimate disagrees with records
Listing remarks
Welcome to this beautifully updated multi-family home that perfectly blends modern updates, spacious living, and investment potential! Whether you’re looking for an owner-occupied opportunity or a strong income-producing property, this home offers exceptional versatility and comfort. Featuring two separate private entrances, each unit is thoughtfully designed with 3 generously sized bedrooms and 1 fully updated bathroom, offering plenty of space for comfortable everyday living. Step inside and immediately notice the bright and inviting atmosphere created by the abundance of natural light flowing through the home. Freshly painted interiors, updated finishes, and a warm, welcoming layou
Key facts
- Porch area
- Updated finishes
- Renovated bathrooms
Tags
Property features AI
Finance
- Other: Two total residential units; Two separate gas meters and two separate electric meters
- Financial info: Owner pays water; rent includes water; Operating expenses include water/sewer
Exterior
- Parking: No driveway
- Utilities: Public water connected; Sewer connected
- Home design: Two-story building; Existing/resale property
- Construction: Vinyl siding
- Exterior features: Near public transit; Rectangular residential lot; City street frontage; Lot dimensions approximately 30 x 112
Interior
- Kitchen: Gas water heater (appliance listed)
- Bedrooms: Two 3-bedroom units (each unit includes a formal dining room)
- Flooring: Hardwood; Vinyl; Varies
- Bathrooms: Each unit has 1 full bathroom (total 2 full bathrooms)
- Heating & cooling: Gas forced-air heating
- Interior features: Hardwood and vinyl flooring; some areas vary; Full basement
- Laundry & utility: Separate gas and electric meters for each unit
Neighborhood map
What this means for you Summary
Snapshot
- This is a 6-bed/2.0-bath multifamily listed at $199k. Condition is rated good.
Deal economics
- At list price, monthly cash flow is $2k ($19k/yr) — positive.
- The deal already cash-flows at list — no discount required.
- Meets the 1% rule at list price ($4k rent vs $199k).
- Recommended offer: $193k (3.0% below list) — sets the bar for market timing.
- Cap rate 15.7% vs local median 8.0% in Buffalo — top-decile yield for the area; either an underpriced asset or a hidden risk that comps aren't pricing in. Stress-test before assuming the spread holds.
Location & tenants
- Location reads 77/100 on livability (#195 in NY, #3,011 nationally) — a middle-class / working-renter tenant base. Strengths: commute A+, housing A+, health & safety A+; Watch: crime F, employment D-.
- Buffalo City School District (urban): math 41% / reading 40% proficiency, ranked #535 of 590 in NY (top 91%) — families likely to look elsewhere, expect single-tenant / working-renter base with shorter leases; 75% free/reduced lunch — lower-income household profile, screen leases tightly.
- Market conditions: 54 active listings in the ZIP; 2 comparable units currently listed for rent nearby; 1,244 units permitted in Erie County in 2024 (563 in 5+ unit buildings).
- At $3,713/mo this rent would consume 92% of the median local household income ($48k/yr) (locally 723% of renters already pay >50% of income on rent) — very limited rent-growth headroom before tenants either downsize or default.
Forward outlook
- Local home prices are declining (-3.0%/yr); year-one equity from $1k of loan paydown is wiped out by about $6k of value loss. Plan a longer hold.
- At projected returns (-3.0% appreciation + 3.0% rent growth), your $56k cash investment doubles in ~4 years — after that, you're playing with house money.
Negotiation context
- It's been on market 37 days — a 3% lower offer ($193k) is reasonable based on typical stale-listing flexibility.
Risks & watch-outs
- Watch-outs: built in 1899 — expect roof / HVAC / electrical / plumbing capex.
Questions for the listing agent
- It's been on market 37 days. Have you received any prior offers? Is the seller open to a 3% concession, seller financing, or rate buy-down credit?
- Built in 1899 — when were the roof, HVAC, electrical panel, plumbing, and water heater last replaced?
- Is there a deadline driving the sale (1031 exchange, divorce, estate, relocation)? That informs how much negotiation room exists.
- Crime grade is F in this area — have there been break-ins, vandalism, or insurance claims at this property in the last 3 years? What carrier currently insures it and at what premium?
- What's the average days-on-market for RENTAL listings here right now (not sales)? A rising rental-DOM trend means longer vacancies and softer asking-rent achievability than the comps imply.
- What's the recent tenant-quality profile in this submarket — average credit score on applications, eviction rate, late-payment / NSF rate, and stable-employment percentage? A property-management company in the area should have these aggregated.
- How much new apartment / multifamily construction is in the pipeline within 1–3 miles? Heavy new supply (>2% of stock underway) typically softens rents 12–24 months out; light construction supports rent growth.
Investment metrics
- 1% rule
- 1.87% ✓
- Cap rate
- 15.69%
- Cash-on-cash
- 33.55%
- DSCR
- 2.49
- GRM
- 4.5
CMA / ARV
- ARV (on-the-fly)
- $178,464
- Comps found
- 12
Show comp detail 12 sales within ~0.75 mi
| Address | Dist | Beds/Ba | Sqft | Sold | Price | $/sf | Match |
|---|---|---|---|---|---|---|---|
| 497-499 Riley St | 0.27mi | 6/2.0 | 2,380 (+4%) | 2mo | $105,900 | $44 | 79 |
| 502 Glenwood Ave | 0.23mi | 5/2.0 (-1) | 2,294 (+0%) | 7mo | $20,500 | $9 | 78 |
| 622 Woodlawn Ave | 0.50mi | 6/2.0 | 2,288 (0%) | 3mo | $177,500 | $78 | 74 |
| 304 Northland Ave | 0.52mi | 6/2.0 | 2,288 (0%) | 4mo | $121,000 | $53 | 72 |
| 192 Goulding Ave | 0.40mi | 6/2.0 | 2,476 (+8%) | 2mo | $220,000 | $89 | 66 |
| 24 Winslow Ave | 0.09mi | 5/2.0 (-1) | 2,024 (-12%) | 7mo | $220,000 | $109 | 65 |
| 159 Purdy St | 0.32mi | 6/2.0 | 2,080 (-9%) | 6mo | $212,500 | $102 | 65 |
| 26 Pleasant Pl | 0.61mi | 6/2.0 | 2,346 (+2%) | 3mo | $162,000 | $69 | 65 |
| 169 Florida St | 0.55mi | 6/2.0 | 2,138 (-7%) | 3mo | $258,000 | $121 | 61 |
| 211 Riley St | 0.42mi | 6/3.0 | 2,522 (+10%) | 7mo | $210,000 | $83 | 54 |
| 396 Guilford St | 0.74mi | 6/3.0 | 2,144 (-6%) | 2mo | $135,000 | $63 | 49 |
| 361 E North St Unit S | 0.73mi | 5/2.5 (-1) | 2,544 (+11%) | 3mo | $172,500 | $68 | 38 |
Match score weights: distance 35% · size 25% · config 20% · recency 20%. Top-matched comps best support the ARV.
Projected returns pro-forma
-3.0% appreciation · 3.0% rent growth · sell at horizon
- IRR
- 28.8%
- Equity multiple
- 2.20×
- Total profit
- $67,041
- Equity at exit
- $29,672
- IRR
- 36.2%
- Equity multiple
- 4.34×
- Total profit
- $186,382
- Equity at exit
- $17,206
Cash invested: $55,720 (down + closing). Projections, not guarantees.
Landlord ↔ Tenant lean methodology
- Overall (STATE)
- 15 Strongly Tenant-Friendly
- State New York
- 15 Strongly Tenant-Friendly · D+10
- County
- — inherits STATE
- City
- — inherits STATE
ZIP-level market 14208
- Home prices YoY
- -3.4%
- Active inventory
- 54
- Price-to-rent
- 8.9×
Monthly cashflow live
- Estimated rent
- $3,713 high interval (Pro) →
- Mortgage (P&I)
- −$1,044
- Tax est. 1.5%
- −$249 /mo · $2,985/yr
- Insurance
- −$83
- HOA
- −$0
- Vacancy / Maint / Mgmt
- −$780
- Net cashflow
- $1,558
Break-even live
2-unit breakdown (identical units grouped — click to expand)
| Units | Beds | Baths | Est. rent |
|---|---|---|---|
| 2× units | 3 | 1 | $3,714 |
| #1 | 3 | 1 | $1,857 |
| #2 | 3 | 1 | $1,857 |
| Total (2 units) | $3,713 | ||
UW: 25.0% down · 7.5% · 30yr · 1.5% tax · 5.0% vac · 8.0% maint · 8.0% mgmt
Financing live
Cash to close
- Down payment
- $49,750
- Closing costs
- $5,970
- Reserves months
- —
- Total cash needed
- —
Loan-product check · same deal, 3 products live
Conventional
25% down · 7.5% · 30yr
- Down + closing
- —
- Monthly P&I
- —
- Monthly cashflow
- —
- DSCR
- —
- Eligible?
- —
Personal DTI + credit; lowest rate.
DSCR
20% down · 8.5% · 30yr
- Down + closing
- —
- Monthly P&I
- —
- Monthly cashflow
- —
- DSCR
- —
- Eligible?
- —
No personal income docs; deal must DSCR.
Hard money
10% down · 12.0% · 12mo
- Down + closing
- —
- Monthly P&I
- —
- Monthly cashflow
- —
- DSCR
- —
- Eligible?
- —
Short-term bridge; refi at stabilization.
Rent comps 2 comps
| Address | Beds | Baths | Sqft | Rent | $/sqft | DOM | Units | Dist |
|---|---|---|---|---|---|---|---|---|
| 15 Hughes Ave Buffalo, NY | 7.0 | 2.0 | 1650 | $3,000 | $1.82 | 44d | 1 | 0.86mi |
| 518 Wilson St Buffalo, NY | 5.0 | 1.5 | 1848 | $1,500 | $0.81 | 23d | 1 | 1.03mi |
Listing history 15 events
-
2026-06-18days on market $199,000 Active 37 DOM
-
2026-06-17days on market $199,000 Active 36 DOM
-
2026-06-16days on market $199,000 Active 35 DOM
-
2026-06-15days on market $199,000 Active 34 DOM
-
2026-06-13days on market $199,000 Active 32 DOM
-
2026-06-13days on market $199,000 Active 31 DOM
-
2026-06-10days on market $199,000 Active 29 DOM
-
2026-06-09days on market $199,000 Active 28 DOM
-
2026-06-08days on market $199,000 Active 27 DOM
-
2026-06-07days on market $199,000 Active 26 DOM
-
2026-06-03days on market $199,000 Active 22 DOM
-
2026-06-02days on market $199,000 Active 21 DOM
-
2026-06-01days on market $199,000 Active 20 DOM
-
2026-05-31days on market $199,000 Active 19 DOM
-
2026-05-12$199,000 Active
ⓘ Source: listings_history table (triggers on properties + properties_extension) + one-shot
backfill from property_details.listing_events for pre-trigger history.
Climate risk First Street
- Flood 1/10 Low FEMA zone X (unshaded) · 0% chance over 30 yrs
- Wildfire 1/10 Low
- Heat 3/10 Moderate 7 d/yr ≥91°F today · 15 d/yr by 30 yrs out
- Wind 1/10 Low
- Air quality 4/10 Moderate 4 unhealthy d/yr today · 9 by 30 yrs out
Nearby sold comps map
Loading sold comps map…
Walkable amenities ~0.75 mi
Loading nearby amenities…
Taxation est. · year 1
- Rental income
- $44,556
- − Mortgage interest
- −$11,147
- − Property taxes
- −$2,985
- − Insurance
- −$995
- − Repairs & maintenance
- −$3,564
- − Management
- −$3,564
- − Depreciation
- −$5,789
- Taxable income
- $16,511
- Est. tax owed @ 24.0%
- −$3,963
- After-tax cash flow
- $14,734/yr
For passive investors: Depreciation is non-cash, so a rental often shows a tax loss while cash-flowing — sheltering income. Rental losses are passive: they offset passive income freely, and up to $25,000/yr can offset ordinary (W-2) income if you actively participate and your MAGI is under $100k (phasing out to $0 by $150k); unused losses carry forward. On sale, claimed depreciation is recaptured at up to 25%, and gains may owe capital-gains tax (a 1031 exchange can defer both). Figures are a year-1 estimate at your 24.0% rate — not tax advice; consult a CPA.
Condition & rehab AI · 30 photos
This beautifully updated multi-family home offers a good condition with fresh paint, updated kitchens and bathrooms, and a well-maintained exterior. It's ready for immediate move-in and can be further enhanced with minor cosmetic upgrades.
Value-add opportunities
- Both Painting exterior and interior — Enhances curb appeal and interior aesthetics
- Both Reorganizing and decluttering interior spaces — Maximizes living space and improves flow
- Both Upgrading lighting fixtures — Improves ambiance and energy efficiency
Renovation cost estimate screening
Value-add ROI direction
- Both Painting exterior and interior — Enhances curb appeal and interior aesthetics ↑
- Both Reorganizing and decluttering interior spaces — Maximizes living space and improves flow ↑
- Both Upgrading lighting fixtures — Improves ambiance and energy efficiency ↑
ⓘ Cost ranges are severity-bucket heuristics (US national rule-of-thumb). Get contractor quotes + a written scope before underwriting a rehab budget.
Schools (NCES district)
- District
- Buffalo City School District
- NCES district ID
- 3605850
- Math proficiency
- 41% ▲ 11.00%
- Reading proficiency
- 40% ▲ 7.00%
- Median HH income
- $31,665
- Composite
- 33.17/100
- National rank
- #5544
- State rank
- #535 of 590 in NY
Livability — Buffalo
- Score
- 77/100
- State rank
- #195
- US rank
- #3011
Category grades
Schools grade is shown separately in the Schools card above.
Census & demographics
- Census place
- Buffalo, NY
- County
- Erie County · 714,559 people
- City population
- 440,021
- Metro
- Buffalo-Cheektowaga, NY
- Population (ZIP)
- 12,572
- Household income
- $48,476
- Rent vs Own
- Severe rent burden
- 723.0
Population outlook (Erie County) Hauer SSP2
- Today (2025)
- 933,037 people
- By 2030
- 935,181 · +0.2%
- By 2040
- 928,531 · -0.5%
- By 2050
- 905,725 · -2.9%
- By 2075
- 834,037 · -10.6%
- By 2100
- 708,033 · -24.1%
Race, ethnicity, and origin ACS 2023
- Neighborhood character
- Predominantly Black (72%)
- Race & ethnicity
- Black 72% White 15% Asian 6% Two or more races 4% Hispanic / Latino 3%
- Common ancestry
- Romanian 2% Italian 1% Hispanic 0%
- Foreign-born
- 7% · Canada, South Korea, Philippines
- Languages at home
- 89% English-only · Other Indo-European 3% Spanish 2% French/Haitian/Cajun 1%
Political lean MEDSL · Erie
- 2024 margin
- Lean D (+9.7) · D 54.8% · R 45.2%
- 2008→2024 swing
- -7.9pp toward R · 2008: 17.5pp · 2024: 9.7pp
- All cycles
- 2024: D+9.7 2020: D+14.7 2016: D+4.8 2012: D+15.6 2008: D+17.5
Not yet ingested
- Civics
- —
Market trends
- HPI YoY
- ▼ -16.37%
- Current HPI
- 459.2084
- Rent YoY
- —
- Metro
- Buffalo-Cheektowaga, NY
- State GDP YoY
- ▲ 2.60%
- F500 in state
- 92
Industry mix (Fortune 500 HQ in NY)
| Industry | F500 HQs | Revenue |
|---|---|---|
| Financial Services | 10 | $950B |
|
||
| Consumer Goods | 9 | $162B |
|
||
| Insurance | 4 | $225B |
|
||
| Telecommunications | 2 | $144B |
|
||
| Pharmaceuticals | 2 | $112B |
|
||
| Media / Entertainment | 2 | $69B |
|
||
Price history
1 event — show timeline
- 2026-05-12 Listed $199,000 WNYREIS
Cash-flow waterfall
monthlySold comps — $/sqft
last 12 mo · ≤1 miLoading sold comps…