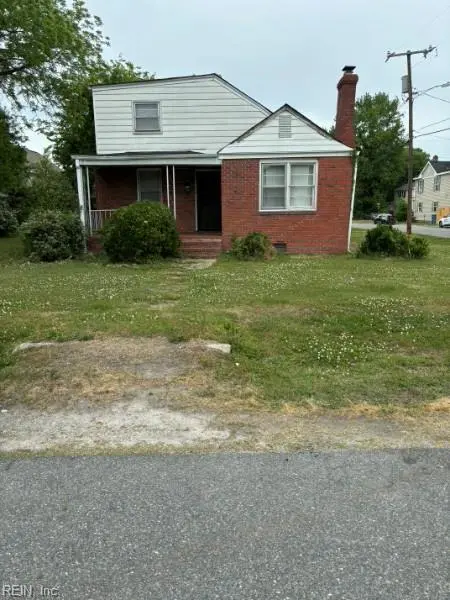
2049 Christian Ave · Chesapeake, VA
Flood risk 1/10 · Minimal
- FEMA flood zone
- X (unshaded)
- Chance of flooding over 30 yrs
- 0.0%
- Est. flood insurance / yr
- $507 – $1,088
Fire risk 1/10 · Minimal
- Est. fire insurance / yr
- $666 – $1,236
Heat risk 9/10 · Severe
- Hot days now (above 106°F)
- 7 days/yr
- Hot days in 30 yrs
- 16 days/yr
Wind risk 8/10 · Major
- Chance of severe wind over 30 yrs
- 80.0%
Air-quality risk 5/10 · Moderate
- Unhealthy air days now
- 6 days/yr
- Unhealthy air days in 30 yrs
- 7 days/yr
Risk factors via First Street. Map © Google.
Why this score? — see what drove the B grade
The composite is a weighted blend of 9 inputs, each scored 0–100. Each bar is that input's sub-score; the figure is the points it added to the 100-point composite (weight × sub-score).
- Cash flow +30.0/30.0
- DSCR +10.0/10.0
- 1% rule +9.4/10.0
- ARV discount +7.5/15.0
- Schools +5.8/10.0
- Livability +3.5/5.0
- Rent growth +2.5/5.0
- Condition / age +2.5/5.0
- Appreciation +0.0/10.0
$169,900
🖨 Deal sheet (PDF) 📄 Offer letter ✓ Due diligence
Listing remarks
Unlock the potential of this Chesapeake property—an exceptional opportunity for investors, builders, or buyers ready to take on a project. Situated on a desirable corner lot and offering larger square footage than several nearby investor comps, this property presents strong upside potential and plenty of room for profit. Offered as-is, where-is, the seller will make no repairs. Whether you're planning a full renovation, repositioning for resale, redevelopment, or a buy-and-hold investment, the possibilities here are undeniable. With nearby development this area is experiencing continued growth, making this a prime opportunity for investors. Conveniently located with easy access to maj
Key facts
- Corner lot
- Nearby development
- Built 1953
Tags
Property features AI
Finance
- Other: Property listed as fixer upper
- HOA & community: No HOA fees
Exterior
- Parking: Street parking
- Utilities: City/County water; City/County sewer; Electric water heater
- Home design: Detached split-level home; 2 stories; 2 living levels; Simple ownership; Crawl foundation
- Construction: Brick and vinyl exterior; Asphalt shingle roof; Crawlspace foundation
- Exterior features: Corner lot; Brick and vinyl siding; Asphalt shingle roof
Interior
- Kitchen: Electric range
- Bedrooms: Master bedroom; Additional bedroom; Bedroom and full bathroom on first floor
- Flooring: Vinyl flooring; Wood flooring
- Bathrooms: 2 full bathrooms
- Heating & cooling: Forced hot air heating; Cooling: Other
- Interior features: Wood-burning fireplace; Attic
- Laundry & utility: Washer hookup; Dryer hookup; Utility room
Neighborhood map
What this means for you Summary
Snapshot
- This is a 4-bed/2.0-bath single-family listed at $170k.
Deal economics
- At list price, monthly cash flow is $782 ($9k/yr) — positive.
- The deal already cash-flows at list — no discount required.
- Meets the 1% rule at list price ($2k rent vs $170k).
- Cap rate 11.8% vs local median 3.7% in Chesapeake — top-decile yield for the area; either an underpriced asset or a hidden risk that comps aren't pricing in. Stress-test before assuming the spread holds.
Location & tenants
- Location reads 70/100 on livability (#236 in VA) — a middle-class / working-renter tenant base. Strengths: employment A+, housing A+; Watch: crime C-, cost of living C-, amenities F.
- Chesapeake City Public School District (suburban): math 58% / reading 74% proficiency, ranked #31 of 131 in VA (top 24%) — acceptable for families but not a draw, mixed tenant base, ~2y average lease.
- Zoned schools: Rena B. Wright Primary (271 students, 96% FRL); Oscar Smith Middle (math 24% / reading 54%, grade F, #309 of 342 statewide, top 91%, 958 students, 90% FRL); Oscar F. Smith High (math 63% / reading 75%, grade B, #170 of 319 statewide, top 55%, 2,291 students, 70% FRL) — zoned schools average 85% FRL vs 28% district-wide (58 pts higher); higher-poverty schools than district average — tighter screening recommended.
- Zoned-school proficiency averages 54% at this address vs 66% district-wide (-12 pts) — the specific schools serving this property underperform the Chesapeake City Public School District average; the district grade overstates school quality for this exact location.
- Market conditions: 118 active listings in the ZIP; 23 comparable units currently listed for rent nearby; rentals at typical pace (median 25d on market — plan ~3-4 weeks tenant-placement turnaround); 43% of comp listings sitting > 30 days — soft ceiling on asking rent; 597 units permitted in Chesapeake city in 2024 (0 in 5+ unit buildings).
- At $2,454/mo this rent would consume 52% of the median local household income ($57k/yr) (locally 1301% of renters already pay >50% of income on rent) — very limited rent-growth headroom before tenants either downsize or default.
Forward outlook
- Local home prices are declining (-3.0%/yr); year-one equity from $1k of loan paydown is wiped out by about $5k of value loss. Plan a longer hold.
- Chesapeake County population projected at +21% by 2050 — long-run rental-demand tailwind backs the buy-and-hold thesis.
- At projected returns (-3.0% appreciation + 3.0% rent growth), your $48k cash investment doubles in ~7 years — after that, you're playing with house money.
Negotiation context
- Only 14 days on market — expect competitive offers; lowballing is unlikely to land.
Risks & watch-outs
- Watch-outs: built in 1953 — expect roof / HVAC / electrical / plumbing capex.
- Climate carrying-cost: severe wind risk, 80% chance of damaging wind over 30y; extreme-heat days projected 7→16/yr by 2055 (HVAC capex compounding) — expect insurance premiums to compound above CPI over the hold.
Questions for the listing agent
- Built in 1953 — when were the roof, HVAC, electrical panel, plumbing, and water heater last replaced?
- Is there a deadline driving the sale (1031 exchange, divorce, estate, relocation)? That informs how much negotiation room exists.
- Schools are A-rated — typically a magnet for longer-tenancy family renters. What's the average tenant stay here, and is there a school-zone premium baked into asking?
- What's the average days-on-market for RENTAL listings here right now (not sales)? A rising rental-DOM trend means longer vacancies and softer asking-rent achievability than the comps imply.
- What's the recent tenant-quality profile in this submarket — average credit score on applications, eviction rate, late-payment / NSF rate, and stable-employment percentage? A property-management company in the area should have these aggregated.
- How much new for-sale + rental construction is in the pipeline within 1–3 miles? Heavy new supply typically softens prices + rents 12–24 months out; constrained supply supports both.
Investment metrics
- 1% rule
- 1.44% ✓
- Cap rate
- 11.82%
- Cash-on-cash
- 19.73%
- DSCR
- 1.88
- GRM
- 5.8
CMA / ARV
- ARV (on-the-fly)
- $360,138
- Comps found
- 12
Show comp detail 12 sales within ~0.75 mi
| Address | Dist | Beds/Ba | Sqft | Sold | Price | $/sf | Match |
|---|---|---|---|---|---|---|---|
| 2049 Christian Ave | 0.00mi | 4/2.0 | 1,866 (0%) | 1mo | $165,000 | $88 | 99 |
| 2130 Berkley Ave | 0.11mi | 4/3.0 | 1,770 (-5%) | 0mo | $351,000 | $198 | 82 |
| 1510 Landsworth St | 0.28mi | 3/2.0 (-1) | 1,722 (-8%) | 1mo | $357,000 | $207 | 68 |
| 1230 Commerce Ave | 0.61mi | 4/3.0 | 1,760 (-6%) | 1mo | $340,000 | $193 | 58 |
| 2016 Jefferson St | 0.43mi | 4/3.0 | 2,080 (+12%) | 2mo | $408,000 | $196 | 56 |
| 1212 Hatton St | 0.51mi | 4/2.5 | 2,092 (+12%) | 2mo | $365,000 | $174 | 53 |
| 1102 Bethel Rd | 0.42mi | 4/2.5 | 2,136 (+14%) | 2mo | $405,000 | $190 | 53 |
| 1308 Seaboard Ave | 0.70mi | 4/3.0 | 2,002 (+7%) | 1mo | $320,000 | $160 | 51 |
| 610 Mooney Rd | 0.71mi | 4/2.5 | 2,040 (+9%) | 1mo | $400,000 | $196 | 48 |
| 1302 Hatton St | 0.49mi | 3/2.0 (-1) | 1,600 (-14%) | 2mo | $310,000 | $194 | 47 |
| 1432 Tatemstown Rd | 0.54mi | 4/3.0 | 2,140 (+15%) | 1mo | $406,000 | $190 | 46 |
| 1416 Martin Ave | 0.65mi | 3/2.5 (-1) | 1,600 (-14%) | 2mo | $230,000 | $144 | 38 |
Match score weights: distance 35% · size 25% · config 20% · recency 20%. Top-matched comps best support the ARV.
Projected returns pro-forma
-3.0% appreciation · 3.0% rent growth · sell at horizon
- IRR
- 11.8%
- Equity multiple
- 1.47×
- Total profit
- $22,312
- Equity at exit
- $25,333
- IRR
- 20.8%
- Equity multiple
- 2.76×
- Total profit
- $83,682
- Equity at exit
- $14,690
Cash invested: $47,572 (down + closing). Projections, not guarantees.
Landlord ↔ Tenant lean methodology
- Overall (STATE)
- 55 Moderately Landlord-Leaning
- State Virginia
- 55 Moderately Landlord-Leaning · D+2
- County
- — inherits STATE
- City
- — inherits STATE
ZIP-level market 23324
- Home prices YoY
- -17.3%
- Active inventory
- 118
- Price-to-rent
- 5.8×
Monthly cashflow live
- Estimated rent
- $2,454 high interval (Pro) →
- Mortgage (P&I)
- −$891
- Tax from tax record
- −$194 /mo · $2,333/yr
- Insurance
- −$71
- HOA
- −$0
- Vacancy / Maint / Mgmt
- −$515
- Net cashflow
- $782
Break-even live
Sensitivity live
| Price | -10% $878 | -5% $830 | +0% $782 | +5% $734 | +10% $686 |
|---|---|---|---|---|---|
| Rent | -10% $588 | -5% $685 | +0% $782 | +5% $879 | +10% $976 |
| Rate | -1.0pp $868 | -0.5pp $825 | base $782 | +0.5pp $738 | +1.0pp $693 |
UW: 25.0% down · 7.5% · 30yr · 1.5% tax · 5.0% vac · 8.0% maint · 8.0% mgmt
Financing live
Cash to close
- Down payment
- $42,475
- Closing costs
- $5,097
- Reserves months
- —
- Total cash needed
- —
Loan-product check · same deal, 3 products live
Conventional
25% down · 7.5% · 30yr
- Down + closing
- —
- Monthly P&I
- —
- Monthly cashflow
- —
- DSCR
- —
- Eligible?
- —
Personal DTI + credit; lowest rate.
DSCR
20% down · 8.5% · 30yr
- Down + closing
- —
- Monthly P&I
- —
- Monthly cashflow
- —
- DSCR
- —
- Eligible?
- —
No personal income docs; deal must DSCR.
Hard money
10% down · 12.0% · 12mo
- Down + closing
- —
- Monthly P&I
- —
- Monthly cashflow
- —
- DSCR
- —
- Eligible?
- —
Short-term bridge; refi at stabilization.
Rent comps 23 comps
| Address | Beds | Baths | Sqft | Rent | $/sqft | DOM | Units | Dist |
|---|---|---|---|---|---|---|---|---|
| 1510 Wilson Rd #4 Norfolk, VA | 3.0 | 1.0 | 1273 | $1,400 | $1.10 | 21d | 1 | 0.45mi |
| 1510 Wilson Rd Unit 3 Norfolk, VA | 3.0 | 1.0 | 1273 | $1,200 | $0.94 | 45d | 1 | 0.45mi |
| 1021 Joyce St Norfolk, VA | 5.0 | 3.0 | 2612 | $4,000 | $1.53 | 45d | 1 | 0.51mi |
| 1729 Todd St Norfolk, VA | 3.0 | 2.5 | 2000 | $2,450 | $1.23 | 25d | 1 | 0.52mi |
| 1009 Elkin St Norfolk, VA | 4.0 | 2.5 | 1914 | $2,500 | $1.31 | 14d | 1 | 0.65mi |
| 1512 Marsh St Norfolk, VA | 3.0 | 2.5 | 1727 | $2,195 | $1.27 | 45d | 1 | 0.69mi |
| 1108 Jackson Ave Chesapeake, VA | 3.0 | 2.0 | 1784 | $2,100 | $1.18 | 5d | 1 | 0.69mi |
| 2638 King Ct Chesapeake, VA | 3.0 | 1.5 | 1462 | $2,000 | $1.37 | 21d | 1 | 0.88mi |
| 2620 Sunrise Ave Chesapeake, VA | 3.0 | 1.5 | 1462 | $1,850 | $1.27 | 25d | 1 | 0.91mi |
| 1110 Park Ave Unit 23324 Chesapeake, VA | 3.0 | 2.0 | 1749 | $2,200 | $1.26 | 25d | 1 | 0.92mi |
| 1110 Park Ave Chesapeake, VA | 3.0 | 2.0 | 1749 | $2,100 | $1.20 | 16d | 1 | 0.92mi |
| 1231 Stewart St Chesapeake, VA | 4.0 | 2.5 | 2159 | $2,550 | $1.18 | 5d | 1 | 0.92mi |
| 722 Culpepper St Norfolk, VA | 5.0 | 4.0 | 1742 | $2,550 | $1.46 | 45d | 1 | 1.01mi |
| 1151 Perry St Chesapeake, VA | 3.0 | 1.0 | 1296 | $2,000 | $1.54 | 18d | 1 | 1.02mi |
| 413 Walker Ave Norfolk, VA | 5.0 | 3.5 | 2200 | $3,500 | $1.59 | 45d | 1 | 1.13mi |
| 1008 Grayson St Norfolk, VA | 3.0 | 2.0 | 2200 | $2,495 | $1.13 | 45d | 1 | 1.22mi |
| 127 Poplar Ave Unit 1 Norfolk, VA | 3.0 | 2.0 | 1700 | $2,199 | $1.29 | 25d | 1 | 1.29mi |
| 201 Bellamy Ave Norfolk, VA | 5.0 | 2.5 | 2200 | $2,750 | $1.25 | 45d | 1 | 1.34mi |
| 2624 Chesterfield Blvd Norfolk, VA | 4.0 | 1.5 | 1512 | $2,000 | $1.32 | 45d | 1 | 1.37mi |
| 2800 Chesterfield Blvd Norfolk, VA | 3.0 | 2.5 | 1760 | $2,400 | $1.36 | 5d | 1 | 1.38mi |
| 2540 Holly Point Blvd Chesapeake, VA | 1.0–3.0 | 1.0–2.0 | 1250 | $2,680 | $2.14 | 3d | 20 | 1.41mi |
| 329 S Main St Norfolk, VA | 3.0 | 3.0 | 1652 | $3,000 | $1.82 | 45d | 1 | 1.43mi |
| 2806 Kimball Ter Norfolk, VA | 3.0 | 2.5 | 1700 | $2,100 | $1.24 | 46d | 1 | 1.49mi |
Listing history 3 events
-
2026-05-16status Under Contract
-
2026-05-07historical Active Under Contract
-
2026-05-01$169,900 Active
ⓘ Source: listings_history table (triggers on properties + properties_extension) + one-shot
backfill from property_details.listing_events for pre-trigger history.
Tax reassessment forecast VA · Resets to sale price
- Current annual tax
- $2,333 · $194/mo
- Projected year-2 tax
- $2,333 · $194/mo
- Expected delta
- $0/yr ($0/mo · 0.0%)
ⓘ Screening estimate from a state-policy table — verify with the county assessor before closing.
Climate risk First Street
- Flood 1/10 Low FEMA zone X (unshaded) · 0% chance over 30 yrs
- Wildfire 1/10 Low
- Heat 9/10 Extreme 7 d/yr ≥106°F today · 16 d/yr by 30 yrs out
- Wind 8/10 Severe 80% chance of damaging wind over 30 yrs
- Air quality 5/10 Major 6 unhealthy d/yr today · 7 by 30 yrs out
Nearby sold comps map
Loading sold comps map…
Walkable amenities ~0.75 mi
Loading nearby amenities…
Taxation est. · year 1
- Rental income
- $29,444
- − Mortgage interest
- −$9,517
- − Property taxes
- −$2,333
- − Insurance
- −$850
- − Repairs & maintenance
- −$2,355
- − Management
- −$2,355
- − Depreciation
- −$4,943
- Taxable income
- $7,090
- Est. tax owed @ 24.0%
- −$1,702
- After-tax cash flow
- $7,684/yr
For passive investors: Depreciation is non-cash, so a rental often shows a tax loss while cash-flowing — sheltering income. Rental losses are passive: they offset passive income freely, and up to $25,000/yr can offset ordinary (W-2) income if you actively participate and your MAGI is under $100k (phasing out to $0 by $150k); unused losses carry forward. On sale, claimed depreciation is recaptured at up to 25%, and gains may owe capital-gains tax (a 1031 exchange can defer both). Figures are a year-1 estimate at your 24.0% rate — not tax advice; consult a CPA.
Schools (NCES district)
- District
- Chesapeake City Public School District
- NCES district ID
- 5100810
- Math proficiency
- 58% ▼ -29.00%
- Reading proficiency
- 74% ▼ -7.00%
- Median HH income
- $69,356
- Composite
- 57.84/100
- National rank
- #1047
- State rank
- #31 of 131 in VA
Livability — Chesapeake
- Score
- 70/100
- State rank
- #236
- US rank
- #7942
Category grades
Schools grade is shown separately in the Schools card above.
Census & demographics
- Census place
- Chesapeake, VA
- County
- Chesapeake City · 253,091 people
- City population
- 253,091
- Metro
- Virginia Beach-Norfolk-Newport News, VA-NC
- Population (ZIP)
- 24,670
- Household income
- $57,045
- Rent vs Own
- Severe rent burden
- 1301.0
Population outlook (Chesapeake County) Hauer SSP2
- Today (2025)
- 263,804 people
- By 2030
- 276,798 · +4.9%
- By 2040
- 299,906 · +13.7%
- By 2050
- 318,284 · +20.7%
- By 2075
- 362,137 · +37.3%
- By 2100
- 372,225 · +41.1%
Race, ethnicity, and origin ACS 2023
- Neighborhood character
- Diverse neighborhood (Simpson 0.59)
- Race & ethnicity
- Black 58% White 27% Two or more races 9% Hispanic / Latino 9% Asian 1%
- Hispanic origin (detail)
- Mexican 3% Puerto Rican 4%
- Common ancestry
- Slovak 2% Italian 2% Romanian 1%
- Foreign-born
- 4% · Canada
- Languages at home
- 92% English-only · Spanish 6% French/Haitian/Cajun 1% Other Indo-European 1%
Political lean MEDSL · Chesapeake
- 2024 margin
- Toss-up / Even · D 51.3% · R 47.5% · Other 1.2%
- 2008→2024 swing
- +2.5pp toward D · 2008: 1.3pp · 2024: 3.8pp
- All cycles
- 2024: D+3.8 2020: D+6.5 2016: R+1.3 2012: D+1.1 2008: D+1.3
Not yet ingested
- Civics
- —
Market trends
- HPI YoY
- ▼ -66.73%
- Current HPI
- 319.2653
- Rent YoY
- —
- Metro
- Virginia Beach-Norfolk-Newport News, VA-NC
- State GDP YoY
- ▲ 2.40%
- F500 in state
- 50
Industry mix (Fortune 500 HQ in VA)
| Industry | F500 HQs | Revenue |
|---|---|---|
| Aerospace / Defense | 4 | $236B |
|
||
| Technology / Defense | 3 | $32B |
|
||
| Financial Services | 2 | $176B |
|
||
| Utilities | 2 | $27B |
|
||
| Insurance | 2 | $25B |
|
||
| Technology | 2 | $15B |
|
||
Price history
3 events — show timeline
- 2026-05-16 Pending — REINMLS
- 2026-05-07 Contingent — REINMLS
- 2026-05-01 Listed $169,900 REINMLS
Property tax history
+3.7%/yrLatest (2025): $2,333 · +2.9% YoY. Source: county tax records.
Cash-flow waterfall
monthlySold comps — $/sqft
last 12 mo · ≤1 miLoading sold comps…