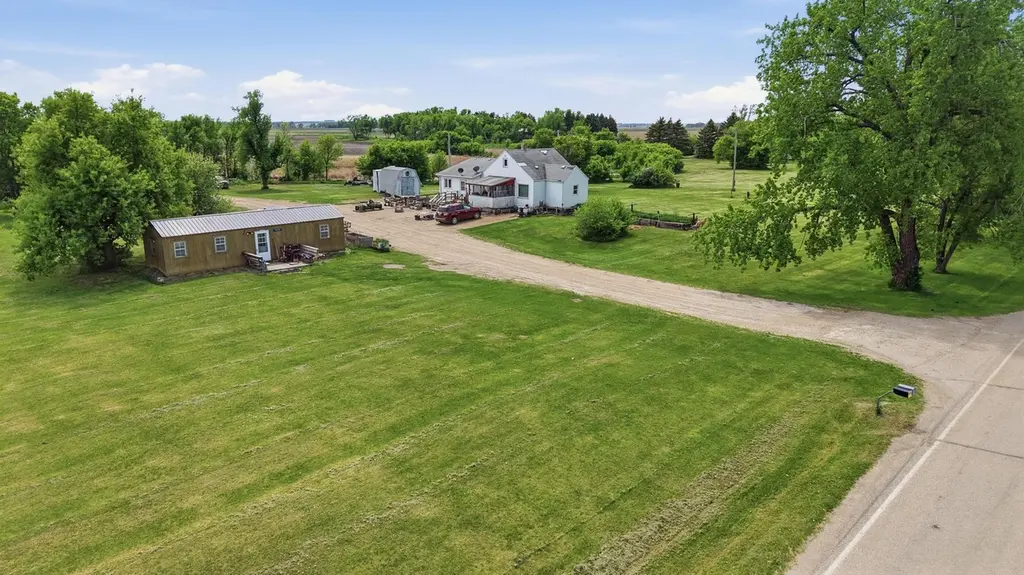
204 East St S · Cogswell, ND
Flood risk 1/10 · Minimal
- FEMA flood zone
- —
- Chance of flooding over 30 yrs
- 0.0%
- Est. flood insurance / yr
- —
Fire risk 1/10 · Minimal
- Est. fire insurance / yr
- $1,289 – $2,393
Heat risk 2/10 · Minimal
- Hot days now (above 99°F)
- 7 days/yr
- Hot days in 30 yrs
- 12 days/yr
Wind risk 2/10 · Minimal
- Chance of severe wind over 30 yrs
- —
Air-quality risk 3/10 · Minor
- Unhealthy air days now
- 2 days/yr
- Unhealthy air days in 30 yrs
- 3 days/yr
Risk factors via First Street. Map © Google.
Why this score? — see what drove the B grade
The composite is a weighted blend of 9 inputs, each scored 0–100. Each bar is that input's sub-score; the figure is the points it added to the 100-point composite (weight × sub-score).
- Cash flow +30.0/30.0
- 1% rule +10.0/10.0
- DSCR +10.0/10.0
- ARV discount +7.5/15.0
- Appreciation +5.0/10.0
- Schools +3.6/10.0
- Livability +3.2/5.0
- Rent growth +2.5/5.0
- Condition / age +2.2/5.0
$60,000
🖨 Deal sheet (PDF) 📄 Offer letter ✓ Due diligence
Key facts
- Peaceful countryside
- Acre size lot
- 1.04 acre lot
Tags
Property features AI
Finance
- Other: Above-grade finished area approximately 1,584; Total living area approximately 1,584; Lot size about 1.044 acres; Directions: south side of Vivian St
- Financial info: $562 annual tax (2025)
Exterior
- Parking: Gravel parking
- Utilities: City water connected; Private sewer; Other fuel source
- Home design: Residential property; One and one-half story; Entry level details not provided
- Construction: Block foundation; Foundation area approximately 1,332
- Exterior features: Vinyl exterior; Multiple lots
Interior
- Bedrooms: 3 bedrooms
- Bathrooms: 1 full bathroom
- Heating & cooling: Forced air heating; Central air; Wall and window air conditioning units
- Interior features: Basement with block foundation
Neighborhood map
What this means for you Summary
Snapshot
- This is a 3-bed/1.0-bath single-family listed at $60k. Condition is rated fair.
Deal economics
- At list price, monthly cash flow is $518 ($6k/yr) — positive.
- The deal already cash-flows at list — no discount required.
- Meets the 1% rule at list price ($1k rent vs $60k).
- Recommended offer: $59k (1.5% below list) — sets the bar for market timing.
Location & tenants
- Location reads 65/100 on livability (#184 in ND) — a middle-class / working-renter tenant base. Strengths: cost of living A+, housing A+, employment B; Watch: health & safety C-, crime D+, amenities F.
- North Sargent 3 (rural): math 25% / reading 50% proficiency, ranked #108 of 169 in ND (top 64%) — families likely to look elsewhere, expect single-tenant / working-renter base with shorter leases; only 17% free/reduced lunch — higher-income household profile.
- Zoned schools: North Sargent Elementary School (math 12% / reading 37%, grade F, #204 of 236 statewide, top 91%, 130 students, 43% FRL); North Sargent High School (math 24% / reading 75%, grade D+, #16 of 144 statewide, top 12%, 55 students, 46% FRL) — zoned schools average 44% FRL vs 17% district-wide (27 pts higher); higher-poverty schools than district average — tighter screening recommended.
- Market conditions: 2 active listings in the ZIP; 1 units permitted in Sargent County in 2024 (0 in 5+ unit buildings).
Forward outlook
- In year one you build about $2k of equity ($415 loan paydown + $2k appreciation (3.0% local appreciation)).
- Sargent County population projected at +4% by 2050 — modest demand growth; plan on rents tracking national, not racing it.
- At projected returns (3.0% appreciation + 3.0% rent growth), your $17k cash investment doubles in ~2 years — after that, you're playing with house money.
Negotiation context
- It's been on market 17 days — a 2% lower offer ($59k) is reasonable based on typical stale-listing flexibility.
Risks & watch-outs
- Watch-outs: built in 1920 — expect roof / HVAC / electrical / plumbing capex.
Questions for the listing agent
- Have any recent inspections been done? Can we get a copy of the seller's disclosures and any deferred-maintenance estimates?
- Built in 1920 — when were the roof, HVAC, electrical panel, plumbing, and water heater last replaced?
- Is there a deadline driving the sale (1031 exchange, divorce, estate, relocation)? That informs how much negotiation room exists.
- Schools are F-rated, which usually means shorter tenancies and higher turnover. Who's the typical renter profile here, and what's been the actual vacancy rate?
- Crime grade is D in this area — have there been break-ins, vandalism, or insurance claims at this property in the last 3 years? What carrier currently insures it and at what premium?
- What's the average days-on-market for RENTAL listings here right now (not sales)? A rising rental-DOM trend means longer vacancies and softer asking-rent achievability than the comps imply.
- What's the recent tenant-quality profile in this submarket — average credit score on applications, eviction rate, late-payment / NSF rate, and stable-employment percentage? A property-management company in the area should have these aggregated.
- How much new for-sale + rental construction is in the pipeline within 1–3 miles? Heavy new supply typically softens prices + rents 12–24 months out; constrained supply supports both.
Investment metrics
- 1% rule
- 1.97% ✓
- Cap rate
- 16.64%
- Cash-on-cash
- 36.97%
- DSCR
- 2.65
- GRM
- 4.2
CMA / ARV
No comps found within radius.
Projected returns pro-forma
3.0% appreciation · 3.0% rent growth · sell at horizon
- IRR
- 42.6%
- Equity multiple
- 3.39×
- Total profit
- $40,212
- Equity at exit
- $26,979
- IRR
- 42.4%
- Equity multiple
- 6.77×
- Total profit
- $96,984
- Equity at exit
- $41,577
Cash invested: $16,800 (down + closing). Projections, not guarantees.
Landlord ↔ Tenant lean methodology
- Overall (STATE)
- 82 Strongly Landlord-Friendly
- State North Dakota
- 82 Strongly Landlord-Friendly · R+20
- County
- — inherits STATE
- City
- — inherits STATE
ZIP-level market 58069
- Active inventory
- 2
- Price-to-rent
- 4.2×
Monthly cashflow live
- Estimated rent
- $1,180 medium interval (Pro) →
- Mortgage (P&I)
- −$315
- Tax est. 1.5%
- −$75 /mo · $900/yr
- Insurance
- −$25
- HOA
- −$0
- Vacancy / Maint / Mgmt
- −$248
- Net cashflow
- $518
Break-even live
Sensitivity live
| Price | -10% $559 | -5% $538 | +0% $518 | +5% $497 | +10% $476 |
|---|---|---|---|---|---|
| Rent | -10% $424 | -5% $471 | +0% $518 | +5% $564 | +10% $611 |
| Rate | -1.0pp $548 | -0.5pp $533 | base $518 | +0.5pp $502 | +1.0pp $486 |
UW: 25.0% down · 7.5% · 30yr · 1.5% tax · 5.0% vac · 8.0% maint · 8.0% mgmt
Financing live
Cash to close
- Down payment
- $15,000
- Closing costs
- $1,800
- Reserves months
- —
- Total cash needed
- —
Loan-product check · same deal, 3 products live
Conventional
25% down · 7.5% · 30yr
- Down + closing
- —
- Monthly P&I
- —
- Monthly cashflow
- —
- DSCR
- —
- Eligible?
- —
Personal DTI + credit; lowest rate.
DSCR
20% down · 8.5% · 30yr
- Down + closing
- —
- Monthly P&I
- —
- Monthly cashflow
- —
- DSCR
- —
- Eligible?
- —
No personal income docs; deal must DSCR.
Hard money
10% down · 12.0% · 12mo
- Down + closing
- —
- Monthly P&I
- —
- Monthly cashflow
- —
- DSCR
- —
- Eligible?
- —
Short-term bridge; refi at stabilization.
Listing history 12 events
-
2026-06-21days on market $60,000 Active 17 DOM
-
2026-06-21days on market $60,000 Active 16 DOM
-
2026-06-18days on market $60,000 Active 14 DOM
-
2026-06-17days on market $60,000 Active 13 DOM
-
2026-06-16days on market $60,000 Active 12 DOM
-
2026-06-15days on market $60,000 Active 11 DOM
-
2026-06-13days on market $60,000 Active 9 DOM
-
2026-06-12days on market $60,000 Active 8 DOM
-
2026-06-09days on market $60,000 Active 5 DOM
-
2026-06-08days on market $60,000 Active 4 DOM
-
2026-06-07days on market $60,000 Active 3 DOM
-
2026-06-05$60,000 Active 1 DOM
ⓘ Source: listings_history table (triggers on properties + properties_extension) + one-shot
backfill from property_details.listing_events for pre-trigger history.
Climate risk First Street
- Flood 1/10 Low 0% chance over 30 yrs
- Wildfire 1/10 Low
- Heat 2/10 Low 7 d/yr ≥99°F today · 12 d/yr by 30 yrs out
- Wind 2/10 Low
- Air quality 3/10 Moderate 2 unhealthy d/yr today · 3 by 30 yrs out
Nearby sold comps map
Loading sold comps map…
Walkable amenities ~0.75 mi
Loading nearby amenities…
Taxation est. · year 1
- Rental income
- $14,161
- − Mortgage interest
- −$3,361
- − Property taxes
- −$900
- − Insurance
- −$300
- − Repairs & maintenance
- −$1,133
- − Management
- −$1,133
- − Depreciation
- −$1,745
- Taxable income
- $5,589
- Est. tax owed @ 24.0%
- −$1,341
- After-tax cash flow
- $4,870/yr
For passive investors: Depreciation is non-cash, so a rental often shows a tax loss while cash-flowing — sheltering income. Rental losses are passive: they offset passive income freely, and up to $25,000/yr can offset ordinary (W-2) income if you actively participate and your MAGI is under $100k (phasing out to $0 by $150k); unused losses carry forward. On sale, claimed depreciation is recaptured at up to 25%, and gains may owe capital-gains tax (a 1031 exchange can defer both). Figures are a year-1 estimate at your 24.0% rate — not tax advice; consult a CPA.
Condition & rehab AI · 13 photos
The home requires significant repairs and maintenance, including a new roof, exterior siding and paint, flooring, HVAC system, and landscaping. These updates would significantly increase its resale and rental value.
Repairs flagged
- Major roof — Significant wear and tear, with visible signs of damage.
- Major exterior siding — Severe peeling and discoloration.
- Major flooring — Old and in need of replacement.
- Major HVAC system — Old and may need replacement or repair.
- Major landscaping — Overgrown and in need of trimming and maintenance.
Value-add opportunities
- Both new roof — A new roof would significantly improve the home's appearance and increase its value.
- Both new exterior siding and paint — New siding and paint would improve the home's curb appeal and increase its value.
- Both new flooring — New flooring would improve the home's appearance and increase its value.
- Both HVAC system replacement — A new HVAC system would improve the home's comfort and increase its value.
- Both landscaping and trimming — A well-maintained landscape would improve the home's curb appeal and increase its value.
Renovation cost estimate screening
| Repair item | Severity | Est. cost |
|---|---|---|
| roof · Significant wear and tear, with visible signs of damage. | Major | $15,000–50,000 |
| exterior siding · Severe peeling and discoloration. | Major | $15,000–50,000 |
| flooring · Old and in need of replacement. | Major | $15,000–50,000 |
| HVAC system · Old and may need replacement or repair. | Major | $15,000–50,000 |
| landscaping · Overgrown and in need of trimming and maintenance. | Major | $15,000–50,000 |
| Total estimated repair cost · 5 items | $75,000–250,000 |
Value-add ROI direction
- Both new roof — A new roof would significantly improve the home's appearance and increase its value. ↑
- Both new exterior siding and paint — New siding and paint would improve the home's curb appeal and increase its value. ↑
- Both new flooring — New flooring would improve the home's appearance and increase its value. ↑
- Both HVAC system replacement — A new HVAC system would improve the home's comfort and increase its value. ↑
- Both landscaping and trimming — A well-maintained landscape would improve the home's curb appeal and increase its value. ↑
ⓘ Cost ranges are severity-bucket heuristics (US national rule-of-thumb). Get contractor quotes + a written scope before underwriting a rehab budget.
Schools (NCES district)
- District
- North Sargent 3
- NCES district ID
- 3814290
- Math proficiency
- 25% ▲ 5.00%
- Reading proficiency
- 50% ▲ 5.00%
- Median HH income
- $57,720
- Composite
- 35.64/100
- National rank
- #9699
- State rank
- #108 of 169 in ND
Livability — Cogswell
- Score
- 65/100
- State rank
- #184
- US rank
- #12794
Category grades
Schools grade is shown separately in the Schools card above.
Census & demographics
- Population (ZIP)
- 144
Population outlook (Sargent County) Hauer SSP2
- Today (2025)
- 3,960 people
- By 2030
- 3,997 · +0.9%
- By 2040
- 4,070 · +2.8%
- By 2050
- 4,137 · +4.5%
- By 2075
- 4,790 · +21.0%
- By 2100
- 5,588 · +41.1%
Race, ethnicity, and origin ACS 2023
- Neighborhood character
- Predominantly White (100%)
- Race & ethnicity
- White 100%
- Common ancestry
- Lithuanian 18% Romanian 15% Portuguese 7%
- Foreign-born
- 13%
Political lean MEDSL · Sargent
- 2024 margin
- Solid R (+32.7) · D 32.8% · R 65.5% · Other 1.8%
- 2008→2024 swing
- -50.2pp toward R · 2008: 17.5pp · 2024: -32.7pp
- All cycles
- 2024: R+32.7 2020: R+25.5 2016: R+20.0 2012: D+9.9 2008: D+17.5
Not yet ingested
- Civics
- —
Market trends
- HPI YoY
- —
- Current HPI
- —
- Rent YoY
- —
- Metro
- —
- State GDP YoY
- ▲ 2.09%
- F500 in state
- 2
Industry mix (Fortune 500 HQ in ND)
| Industry | F500 HQs | Revenue |
|---|---|---|
| Utilities / Construction | 1 | $6B |
|
||
Price history
1 event — show timeline
- 2026-06-04 Listed $60,000 NORTHSTARMLS as Distributed by MLS Grid
Cash-flow waterfall
monthlySold comps — $/sqft
last 12 mo · ≤1 miLoading sold comps…