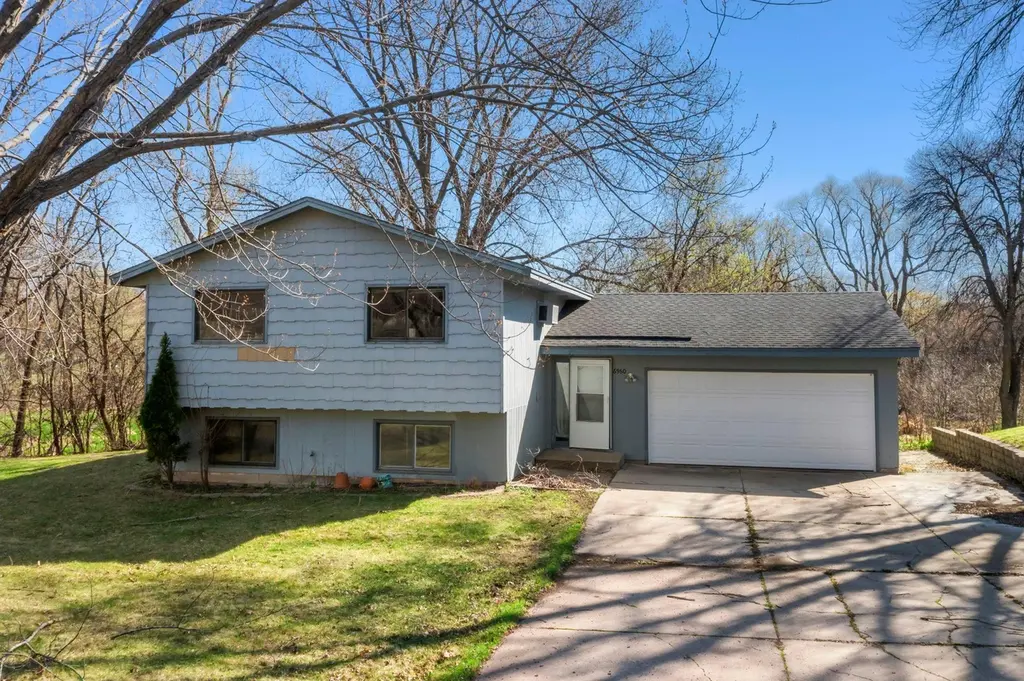
6960 Dallas Ln N · Maple Grove, MN
Flood risk 1/10 · Minimal
- FEMA flood zone
- X (unshaded)
- Chance of flooding over 30 yrs
- 0.0%
- Est. flood insurance / yr
- $473 – $860
Fire risk 1/10 · Minimal
- Est. fire insurance / yr
- $888 – $1,650
Heat risk 2/10 · Minimal
- Hot days now (above 99°F)
- 7 days/yr
- Hot days in 30 yrs
- 14 days/yr
Wind risk 2/10 · Minimal
- Chance of severe wind over 30 yrs
- —
Air-quality risk 2/10 · Minimal
- Unhealthy air days now
- 1 days/yr
- Unhealthy air days in 30 yrs
- 1 days/yr
Risk factors via First Street. Map © Google.
Why this score? — see what drove the D+ grade
The composite is a weighted blend of 9 inputs, each scored 0–100. Each bar is that input's sub-score; the figure is the points it added to the 100-point composite (weight × sub-score).
- Cash flow +17.2/30.0
- ARV discount +7.5/15.0
- DSCR +5.4/10.0
- 1% rule +4.5/10.0
- Schools +4.2/10.0
- Rent growth +4.0/5.0
- Livability +4.0/5.0
- Condition / age +2.5/5.0
- Appreciation +0.0/10.0
$299,000
🖨 Deal sheet 📄 Offer letter ✓ Due diligence
Listing remarks
Welcome to this split-foyer home in the highly sought-after Timber Crest Forest neighborhood of Maple Grove. Set on a quiet, tree-lined 0.25-acre lot, this 4-bedroom property offers a fantastic opportunity for buyers looking to build equity and bring their vision to life. Offering an opportunity for updates and personalization, the home features a functional layout, a sun-filled main living area, and a partially finished basement with great potential for a spacious family room or additional living space. The private backyard offers a great setting for future outdoor enjoyment, and the location is hard to beat- just minutes from Fish Lake Regional Park and the dog park, within the Maple Grov
Key facts
- 0.25 acre lot
- 2 garage spots
- Built 1977
Neighborhood map
What this means for you Summary
Snapshot
- This is a 4-bed/1.0-bath single-family listed at $299k.
Deal economics
- At list price, monthly cash flow is $214 ($3k/yr) — positive.
- The deal already cash-flows at list — no discount required.
- To meet the 1% rule (rent ≥ 1% of price), the offer needs to be $284k (5.0% below list).
- Recommended offer: $284k (5.0% below list) — sets the bar for 1% rule.
- Cap rate 7.2% vs local median 3.4% in Maple Grove — top-decile yield for the area; either an underpriced asset or a hidden risk that comps aren't pricing in. Stress-test before assuming the spread holds.
Location & tenants
- Location reads 81/100 on livability (#54 in MN, #1,353 nationally) — a professional / high-income tenant draw. Strengths: commute A+, employment A+, housing A+; Watch: amenities D, cost of living D.
- Osseo Public School District (suburban): math 42% / reading 51% proficiency, ranked #129 of 301 in MN (top 43%) — families likely to look elsewhere, expect single-tenant / working-renter base with shorter leases.
- Market conditions: Rents rising fast (+5.9%/yr); 300 active listings in the ZIP; 2 comparable units currently listed for rent nearby; high-income renter base; 4,651 units permitted in Hennepin County in 2024 (2,443 in 5+ unit buildings).
Forward outlook
- Local home prices are declining (-3.0%/yr); year-one equity from $2k of loan paydown is wiped out by about $9k of value loss. Plan a longer hold.
- Hennepin County population projected at +30% by 2050 — long-run rental-demand tailwind backs the buy-and-hold thesis.
Negotiation context
- Only 3 days on market — expect competitive offers; lowballing is unlikely to land.
- Current owner paid $45k; list at $299k implies a 571% gain — meaningful room to come down on a strong offer.
Questions for the listing agent
- Built in 1977 — when were the roof, HVAC, electrical panel, plumbing, and water heater last replaced?
- Is there a deadline driving the sale (1031 exchange, divorce, estate, relocation)? That informs how much negotiation room exists.
- Schools are A-rated — typically a magnet for longer-tenancy family renters. What's the average tenant stay here, and is there a school-zone premium baked into asking?
- The area grade is low — what's the realistic commute time and amenity access for the typical tenant pool here? Any planned neighborhood developments (good or bad) we should know about?
- What's the average days-on-market for RENTAL listings here right now (not sales)? A rising rental-DOM trend means longer vacancies and softer asking-rent achievability than the comps imply.
- What's the recent tenant-quality profile in this submarket — average credit score on applications, eviction rate, late-payment / NSF rate, and stable-employment percentage? A property-management company in the area should have these aggregated.
- How much new for-sale + rental construction is in the pipeline within 1–3 miles? Heavy new supply typically softens prices + rents 12–24 months out; constrained supply supports both.
Investment metrics
- 1% rule
- 0.95% ✗
- Cap rate
- 7.15%
- Cash-on-cash
- 3.06%
- DSCR
- 1.14
- GRM
- 8.8
CMA / ARV
No comps found within radius.
Projected returns pro-forma
-3.0% appreciation · 5.86% rent growth · sell at horizon
- IRR
- -8.3%
- Equity multiple
- 0.68×
- Total profit
- $-26,411
- Equity at exit
- $44,582
- IRR
- 4.5%
- Equity multiple
- 1.37×
- Total profit
- $31,205
- Equity at exit
- $25,852
Cash invested: $83,720 (down + closing). Projections, not guarantees.
Landlord ↔ Tenant lean methodology
- Overall (STATE)
- 46 Balanced
- State Minnesota
- 46 Balanced · D+2
- County
- — inherits STATE
- City
- — inherits STATE
ZIP-level market 55311
- Rents YoY
- 5.9%
- Active inventory
- 300
- Price-to-rent
- 8.8×
Monthly cashflow live
- Estimated rent
- $2,841 medium interval (Pro) →
- Mortgage (P&I)
- −$1,568
- Tax from tax record
- −$338 /mo · $4,058/yr
- Insurance
- −$125
- HOA
- −$0
- Vacancy / Maint / Mgmt
- −$597
- Net cashflow
- $214
Break-even live
UW: 25.0% down · 7.5% · 30yr · 1.5% tax · 5.0% vac · 8.0% maint · 8.0% mgmt
Financing live
Cash to close
- Down payment
- $74,750
- Closing costs
- $8,970
- Reserves months
- —
- Total cash needed
- —
Loan-product check · same deal, 3 products live
Conventional
25% down · 7.5% · 30yr
- Down + closing
- —
- Monthly P&I
- —
- Monthly cashflow
- —
- DSCR
- —
- Eligible?
- —
Personal DTI + credit; lowest rate.
DSCR
20% down · 8.5% · 30yr
- Down + closing
- —
- Monthly P&I
- —
- Monthly cashflow
- —
- DSCR
- —
- Eligible?
- —
No personal income docs; deal must DSCR.
Hard money
10% down · 12.0% · 12mo
- Down + closing
- —
- Monthly P&I
- —
- Monthly cashflow
- —
- DSCR
- —
- Eligible?
- —
Short-term bridge; refi at stabilization.
Rent comps 2 comps
| Address | Beds | Baths | Sqft | Rent | $/sqft | DOM | Units | Dist |
|---|---|---|---|---|---|---|---|---|
| 14169 68th Pl N Unit 1 Maple Grove, MN | 3.0 | 1.0 | 1000 | $1,995 | $2.00 | 43d | 1 | 0.23mi |
| 6876 Vicksburg Ln N Maple Grove, MN | 2.0–3.0 | 1.5 | 1110 | $2,350 | $2.12 | 1d | 6 | 1.09mi |
Listing history 4 events
-
2026-04-27status Pending
-
2026-04-24$299,000 Active
-
2026-04-20historical $299,000
-
1977-01-01soldstatus $44,550
ⓘ Source: listings_history table (triggers on properties + properties_extension) + one-shot
backfill from property_details.listing_events for pre-trigger history.
Tax reassessment forecast MN · Partial reset (capped growth)
- Current annual tax
- $4,058 · $338/mo
- Projected year-2 tax
- $4,058 · $338/mo
- Expected delta
- $0/yr ($0/mo · 0.0%)
ⓘ Screening estimate from a state-policy table — verify with the county assessor before closing.
Climate risk First Street
- Flood 1/10 Low FEMA zone X (unshaded) · 0% chance over 30 yrs
- Wildfire 1/10 Low
- Heat 2/10 Low 7 d/yr ≥99°F today · 14 d/yr by 30 yrs out
- Wind 2/10 Low
- Air quality 2/10 Low 1 unhealthy d/yr today · 1 by 30 yrs out
Nearby sold comps map
Loading sold comps map…
Walkable amenities ~0.75 mi
Loading nearby amenities…
Taxation est. · year 1
- Rental income
- $34,092
- − Mortgage interest
- −$16,749
- − Property taxes
- −$4,058
- − Insurance
- −$1,495
- − Repairs & maintenance
- −$2,727
- − Management
- −$2,727
- − Depreciation
- −$8,698
- Taxable loss
- −$2,362
- Est. tax savings @ 24.0%
- +$567
- After-tax cash flow
- $3,131/yr
For passive investors: Depreciation is non-cash, so a rental often shows a tax loss while cash-flowing — sheltering income. Rental losses are passive: they offset passive income freely, and up to $25,000/yr can offset ordinary (W-2) income if you actively participate and your MAGI is under $100k (phasing out to $0 by $150k); unused losses carry forward. On sale, claimed depreciation is recaptured at up to 25%, and gains may owe capital-gains tax (a 1031 exchange can defer both). Figures are a year-1 estimate at your 24.0% rate — not tax advice; consult a CPA.
Schools (NCES district)
- District
- Osseo Public School District
- NCES district ID
- 2725200
- Math proficiency
- 42% ▼ -7.00%
- Reading proficiency
- 51% ▼ -4.00%
- Median HH income
- $76,168
- Composite
- 42.35/100
- National rank
- #3250
- State rank
- #129 of 301 in MN
Livability — Maple Grove
- Score
- 81/100
- State rank
- #54
- US rank
- #1353
Category grades
Schools grade is shown separately in the Schools card above.
Census & demographics
- Census place
- Maple Grove, MN
- County
- Hennepin County · 1,150,272 people
- City population
- 77,762
- Metro
- Minneapolis-St. Paul-Bloomington, MN-WI
- Population (ZIP)
- 38,472
- Household income
- $153,568
- Rent vs Own
- Severe rent burden
- 497.0
Population outlook (Hennepin County) Hauer SSP2
- Today (2025)
- 1,405,227 people
- By 2030
- 1,492,650 · +6.2%
- By 2040
- 1,660,157 · +18.1%
- By 2050
- 1,823,498 · +29.8%
- By 2075
- 2,221,283 · +58.1%
- By 2100
- 2,509,976 · +78.6%
Race, ethnicity, and origin ACS 2023
- Neighborhood character
- Predominantly White (80%)
- Race & ethnicity
- White 80% Asian 8% Black 7% Two or more races 3% Hispanic / Latino 1%
- Common ancestry
- Portuguese 12% Lithuanian 4% Romanian 4%
- Foreign-born
- 12% · Canada, Vietnam, South Korea
- Languages at home
- 87% English-only · Other Indo-European 3% Vietnamese 1% Chinese 1%
Political lean MEDSL · Hennepin
- 2024 margin
- Solid D (+42.6) · D 70.2% · R 27.5% · Other 2.3%
- 2008→2024 swing
- +14.0pp toward D · 2008: 28.6pp · 2024: 42.6pp
- All cycles
- 2024: D+42.6 2020: D+43.2 2016: D+35.3 2012: D+27.1 2008: D+28.6
Not yet ingested
- Civics
- —
Market trends
- HPI YoY
- ▼ -181.69%
- Current HPI
- 213.3896
- Rent YoY
- ▲ 5.86%
- Metro
- Minneapolis-St. Paul-Bloomington, MN-WI
- State GDP YoY
- ▲ 2.41%
- F500 in state
- 34
Industry mix (Fortune 500 HQ in MN)
| Industry | F500 HQs | Revenue |
|---|---|---|
| Healthcare | 2 | $407B |
|
||
| Retail | 2 | $150B |
|
||
| Consumer Goods | 2 | $32B |
|
||
| Industrial Machinery | 2 | $6B |
|
||
| Agriculture | 1 | $40B |
|
||
| Healthcare / Medical Devices | 1 | $32B |
|
||
Price history
+571.2% since first listed4 events — show timeline
- 2026-04-27 Pending — NORTHSTARMLS as Distributed by MLS Grid
- 2026-04-24 Listed $299,000 NORTHSTARMLS as Distributed by MLS Grid
- 2026-04-20 Coming Soon $299,000 NORTHSTARMLS as Distributed by MLS Grid
- 1977-01-01 Sold (Public Records) $44,550 Public Records
Property tax history
+3.0%/yrLatest (2025): $4,058 · -1.4% YoY. Source: county tax records.
Cash-flow waterfall
monthlySold comps — $/sqft
last 12 mo · ≤1 miLoading sold comps…