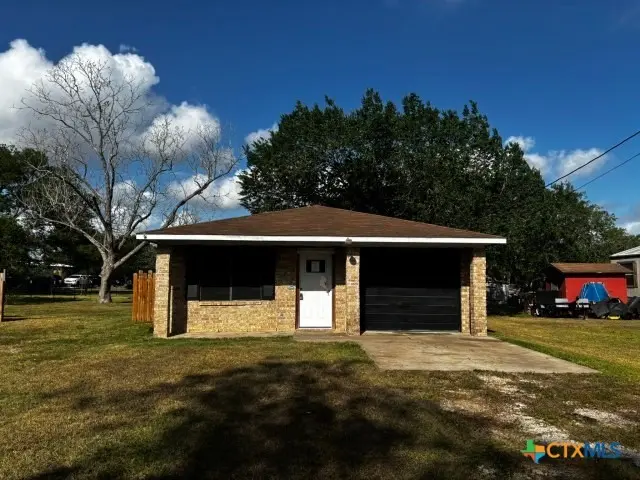
122 Rosa St · Edna, TX
Flood risk 1/10 · Minimal
- FEMA flood zone
- X (unshaded)
- Chance of flooding over 30 yrs
- 0.0%
- Est. flood insurance / yr
- $507 – $1,088
Fire risk 3/10 · Minor
- Est. fire insurance / yr
- $1,222 – $2,270
Heat risk 9/10 · Severe
- Hot days now (above 110°F)
- 7 days/yr
- Hot days in 30 yrs
- 21 days/yr
Wind risk 9/10 · Severe
- Chance of severe wind over 30 yrs
- 99.0%
Air-quality risk 1/10 · Minimal
- Unhealthy air days now
- 0 days/yr
- Unhealthy air days in 30 yrs
- 0 days/yr
Risk factors via First Street. Map © Google.
Why this score? — see what drove the B+ grade
The composite is a weighted blend of 9 inputs, each scored 0–100. Each bar is that input's sub-score; the figure is the points it added to the 100-point composite (weight × sub-score).
- Cash flow +30.0/30.0
- ARV discount +15.0/15.0
- DSCR +10.0/10.0
- 1% rule +8.9/10.0
- Schools +3.6/10.0
- Livability +3.6/5.0
- Rent growth +2.5/5.0
- Condition / age +2.5/5.0
- Appreciation +0.0/10.0
$94,900
🖨 Deal sheet 📄 Offer letter ✓ Due diligence
Listing remarks MLS
Brick 3 bedroom, 2 bath home home on a 0.34 acre lot. Freddie Mac's First Look period expires 5-22-26.
Key facts
- 0.34 acre lot
- Built 1982
- Listed 47 days
Property features AI
Finance
- Other: Property is Real Estate Owned (REO); Lot is less than 0.5 acre (approximately 0.34 acre); Subdivision: Edna; County: Jackson (TX)
- Financial info: Accepts Cash and Conventional offers; No second mortgage
- HOA & community: No homeowners association
Exterior
- Parking: Driveway (no garage or carport)
- Utilities: City water; City sewer; Not in a municipal utility district
- Home design: Single-family residence; Residential property; One story; Preowned (built 1982)
- Construction: Brick construction; Composition roof; Slab foundation; Built in 1982
- Exterior features: Covered front porch; Covered porch(es); No fencing
Interior
- Kitchen: Dishwasher; Electric range
- Bedrooms: 3 bedrooms (primary bedroom on main level)
- Flooring: Tile flooring
- Bathrooms: 2 full bathrooms
- Heating & cooling: Central heating (electric); Central air; Ceiling fan(s)
- Interior features: One living area; One dining area; Other interior features
- Laundry & utility: Washer hookup; Electric dryer hookup; Utility room
Neighborhood map
What this means for you Summary
Snapshot
- This is a 3-bed/2.0-bath single-family listed at $95k.
Deal economics
- At list price, monthly cash flow is $375 ($4k/yr) — positive.
- The deal already cash-flows at list — no discount required.
- Meets the 1% rule at list price ($1k rent vs $95k).
- Recommended offer: $92k (3.0% below list) — sets the bar for market timing.
- Cap rate 11.0% vs local median 2.8% in Edna — top-decile yield for the area; either an underpriced asset or a hidden risk that comps aren't pricing in. Stress-test before assuming the spread holds.
Location & tenants
- Location reads 72/100 on livability (#254 in TX) — a middle-class / working-renter tenant base. Strengths: cost of living A+, housing A+, health & safety A+; Watch: amenities F, commute F.
- Edna ISD (town): math 45% / reading 39% proficiency, ranked #335 of 826 in TX (top 41%) — families likely to look elsewhere, expect single-tenant / working-renter base with shorter leases.
- Zoned schools: Edna El (math 45% / reading 38%, grade F, #1,437 of 4,322 statewide, top 34%, 222 students, 56% FRL) — zoned schools at 56% FRL track the district average.
- Market conditions: 73 active listings in the ZIP.
Forward outlook
- Local home prices are declining (-3.0%/yr); year-one equity from $656 of loan paydown is wiped out by about $3k of value loss. Plan a longer hold.
- Jackson County population projected at +28% by 2050 — long-run rental-demand tailwind backs the buy-and-hold thesis.
- At projected returns (-3.0% appreciation + 3.0% rent growth), your $27k cash investment doubles in ~8 years — after that, you're playing with house money.
Negotiation context
- It's been on market 48 days — a 3% lower offer ($92k) is reasonable based on typical stale-listing flexibility.
- 5 sale attempts; this cycle's ask has dropped $5k (5%) from the opening price — seller is motivated, your offer sets the floor, not the list.
Risks & watch-outs
- Climate carrying-cost: severe wind risk, 99% chance of damaging wind over 30y; extreme-heat days projected 7→21/yr by 2055 (HVAC capex compounding) — expect insurance premiums to compound above CPI over the hold.
Questions for the listing agent
- It's been on market 48 days. Have you received any prior offers? Is the seller open to a 3% concession, seller financing, or rate buy-down credit?
- Is there a deadline driving the sale (1031 exchange, divorce, estate, relocation)? That informs how much negotiation room exists.
- Schools are D-rated, which usually means shorter tenancies and higher turnover. Who's the typical renter profile here, and what's been the actual vacancy rate?
- What's the average days-on-market for RENTAL listings here right now (not sales)? A rising rental-DOM trend means longer vacancies and softer asking-rent achievability than the comps imply.
- What's the recent tenant-quality profile in this submarket — average credit score on applications, eviction rate, late-payment / NSF rate, and stable-employment percentage? A property-management company in the area should have these aggregated.
- How much new for-sale + rental construction is in the pipeline within 1–3 miles? Heavy new supply typically softens prices + rents 12–24 months out; constrained supply supports both.
Investment metrics
- 1% rule
- 1.39% ✓
- Cap rate
- 11.03%
- Cash-on-cash
- 16.92%
- DSCR
- 1.75
- GRM
- 6.0
CMA / ARV
- ARV (median comp)
- $181,512
- List price
- $94,900
- Delta
- -47.72%
- Verdict
- UNDERPRICED
- Comps
- 9 within 1.0 mi
Show comp detail 2 sales within ~0.75 mi
| Address | Dist | Beds/Ba | Sqft | Sold | Price | $/sf | Match |
|---|---|---|---|---|---|---|---|
| 614 Sarah St | 0.50mi | 3/1.5 | 1,248 (+11%) | 1mo | $115,000 | $92 | 56 |
| 513 Suzanne St | 0.23mi | 3/1.0 | 1,296 (+15%) | 22mo | $189,000 | $146 | 42 |
Match score weights: distance 35% · size 25% · config 20% · recency 20%. Top-matched comps best support the ARV.
Projected returns pro-forma
-3.0% appreciation · 3.0% rent growth · sell at horizon
- IRR
- 8.2%
- Equity multiple
- 1.32×
- Total profit
- $8,512
- Equity at exit
- $14,150
- IRR
- 17.4%
- Equity multiple
- 2.44×
- Total profit
- $38,253
- Equity at exit
- $8,205
Cash invested: $26,572 (down + closing). Projections, not guarantees.
Landlord ↔ Tenant lean methodology
- Overall (STATE)
- 87 Strongly Landlord-Friendly
- State Texas
- 87 Strongly Landlord-Friendly · R+5
- County
- — inherits STATE
- City
- — inherits STATE
ZIP-level market 77957
- Home prices YoY
- -25.8%
- Active inventory
- 73
- Price-to-rent
- 6.0×
Monthly cashflow live
- Estimated rent
- $1,322 medium interval (Pro) →
- Mortgage (P&I)
- −$498
- Tax from tax record
- −$132 /mo · $1,587/yr
- Insurance
- −$40
- HOA
- −$0
- Vacancy / Maint / Mgmt
- −$278
- Net cashflow
- $375
Break-even live
UW: 25.0% down · 7.5% · 30yr · 1.5% tax · 5.0% vac · 8.0% maint · 8.0% mgmt
Financing live
Cash to close
- Down payment
- $23,725
- Closing costs
- $2,847
- Reserves months
- —
- Total cash needed
- —
Loan-product check · same deal, 3 products live
Conventional
25% down · 7.5% · 30yr
- Down + closing
- —
- Monthly P&I
- —
- Monthly cashflow
- —
- DSCR
- —
- Eligible?
- —
Personal DTI + credit; lowest rate.
DSCR
20% down · 8.5% · 30yr
- Down + closing
- —
- Monthly P&I
- —
- Monthly cashflow
- —
- DSCR
- —
- Eligible?
- —
No personal income docs; deal must DSCR.
Hard money
10% down · 12.0% · 12mo
- Down + closing
- —
- Monthly P&I
- —
- Monthly cashflow
- —
- DSCR
- —
- Eligible?
- —
Short-term bridge; refi at stabilization.
Listing history 20 events
-
2026-06-18days on market $94,900 Active 48 DOM
-
2026-06-17days on market $94,900 Active 47 DOM
-
2026-06-16days on market $94,900 Active 46 DOM
-
2026-06-15days on market $94,900 Active 45 DOM
-
2026-06-13days on market $94,900 Active 43 DOM
-
2026-06-12days on market $94,900 Active 42 DOM
-
2026-06-09pricedays on market $94,900 Active 39 DOM
Show marketing remark (102 chars)
Brick 3 bedroom, 2 bath home home on a 0.34 acre lot. Freddie Mac's First Look period expires 5-22-26.
-
2026-06-08days on market $99,900 Active 38 DOM
-
2026-06-08days on market $99,900 Active 37 DOM
-
2026-06-07days on market $99,900 Active 36 DOM
-
2026-06-03days on market $99,900 Active 33 DOM
-
2026-06-02days on market $99,900 Active 32 DOM
-
2026-06-01days on market $99,900 Active 31 DOM
-
2026-05-31days on market $99,900 Active 30 DOM
-
2026-04-30status Active 102-char remark
Show marketing remark (102 chars)
Brick 3 bedroom, 2 bath home home on a 0.34 acre lot. Freddie Mac's First Look period expires 5-22-26.
-
2026-04-30status Active
Show marketing remark (102 chars)
Brick 3 bedroom, 2 bath home home on a 0.34 acre lot. Freddie Mac's First Look period expires 5-22-26.
-
2026-04-22$99,900 Active
Show marketing remark (102 chars)
Brick 3 bedroom, 2 bath home home on a 0.34 acre lot. Freddie Mac's First Look period expires 5-22-26.
-
2026-04-22$99,900 Active 102-char remark
Show marketing remark (102 chars)
Brick 3 bedroom, 2 bath home home on a 0.34 acre lot. Freddie Mac's First Look period expires 5-22-26.
-
2022-06-08soldstatus
-
2009-09-01soldstatus
ⓘ Source: listings_history table (triggers on properties + properties_extension) + one-shot
backfill from property_details.listing_events for pre-trigger history.
Tax reassessment forecast TX · Resets to sale price
- Current annual tax
- $1,587 · $132/mo
- Projected year-2 tax
- $1,737 · $145/mo
- Expected delta
- +$150/yr (+$12/mo · 9.4%)
ⓘ Screening estimate from a state-policy table — verify with the county assessor before closing.
Climate risk First Street
- Flood 1/10 Low FEMA zone X (unshaded) · 0% chance over 30 yrs
- Wildfire 3/10 Moderate
- Heat 9/10 Extreme 7 d/yr ≥110°F today · 21 d/yr by 30 yrs out
- Wind 9/10 Extreme 99% chance of damaging wind over 30 yrs
- Air quality 1/10 Low 0 unhealthy d/yr today · 0 by 30 yrs out
Nearby sold comps map
Loading sold comps map…
Walkable amenities ~0.75 mi
Loading nearby amenities…
Taxation est. · year 1
- Rental income
- $15,860
- − Mortgage interest
- −$5,316
- − Property taxes
- −$1,587
- − Insurance
- −$474
- − Repairs & maintenance
- −$1,269
- − Management
- −$1,269
- − Depreciation
- −$2,761
- Taxable income
- $3,184
- Est. tax owed @ 24.0%
- −$764
- After-tax cash flow
- $3,732/yr
For passive investors: Depreciation is non-cash, so a rental often shows a tax loss while cash-flowing — sheltering income. Rental losses are passive: they offset passive income freely, and up to $25,000/yr can offset ordinary (W-2) income if you actively participate and your MAGI is under $100k (phasing out to $0 by $150k); unused losses carry forward. On sale, claimed depreciation is recaptured at up to 25%, and gains may owe capital-gains tax (a 1031 exchange can defer both). Figures are a year-1 estimate at your 24.0% rate — not tax advice; consult a CPA.
Schools (NCES district)
- District
- Edna ISD
- NCES district ID
- 4818210
- Math proficiency
- 45% ▲ 3.00%
- Reading proficiency
- 39% ▼ -3.00%
- Median HH income
- $47,887
- Composite
- 35.99/100
- National rank
- #4793
- State rank
- #335 of 826 in TX
Livability — Edna
- Score
- 72/100
- State rank
- #254
- US rank
- #5996
Category grades
Schools grade is shown separately in the Schools card above.
Census & demographics
- Census place
- Edna, TX
- Population (ZIP)
- 8,919
Population outlook (Jackson County) Hauer SSP2
- Today (2025)
- 16,579 people
- By 2030
- 17,480 · +5.4%
- By 2040
- 19,328 · +16.6%
- By 2050
- 21,182 · +27.8%
- By 2075
- 25,781 · +55.5%
- By 2100
- 28,184 · +70.0%
Race, ethnicity, and origin ACS 2023
- Neighborhood character
- Majority White (60%)
- Race & ethnicity
- White 60% Hispanic / Latino 30% Two or more races 10% Black 8%
- Hispanic origin (detail)
- Mexican 26%
- Common ancestry
- Lithuanian 3% Romanian 2% Iranian 1%
- Foreign-born
- 5% · Canada
- Languages at home
- 82% English-only · Spanish 17% Other Indo-European 1%
Political lean MEDSL · Jackson
- 2024 margin
- Solid R (+70.8) · D 14.3% · R 85.1%
- 2008→2024 swing
- -22.9pp toward R · 2008: -47.9pp · 2024: -70.8pp
- All cycles
- 2024: R+70.8 2020: R+66.2 2016: R+63.7 2012: R+56.5 2008: R+47.9
Not yet ingested
- Civics
- —
Market trends
- HPI YoY
- ▼ -58.92%
- Current HPI
- 169.9334
- Rent YoY
- —
- Metro
- —
- State GDP YoY
- ▲ 3.95%
- F500 in state
- 110
Industry mix (Fortune 500 HQ in TX)
| Industry | F500 HQs | Revenue |
|---|---|---|
| Energy | 16 | $1,198B |
|
||
| Technology | 5 | $198B |
|
||
| Engineering / Construction | 4 | $72B |
|
||
| Energy Services | 3 | $60B |
|
||
| Utilities | 3 | $41B |
|
||
| Healthcare | 2 | $330B |
|
||
Price history
-5.0% since first listed9 events — show timeline
- 2026-06-09 Price Changed $94,900 NTREIS
- 2026-06-09 Price Changed $94,900 CTXMLS
- 2026-05-20 Relisted — NTREIS
- 2026-04-30 Relisted — CTXMLS
- 2026-04-30 Relisted — NTREIS
- 2026-04-22 Listed $99,900 CTXMLS
- 2026-04-22 Listed $99,900 NTREIS
- 2022-06-08 Sold (Public Records) — Public Records
- 2009-09-01 Sold (Public Records) — Public Records
Property tax history
+5.3%/yrLatest (2025): $1,587 · -1.4% YoY. Source: county tax records.
Cash-flow waterfall
monthlySold comps — $/sqft
last 12 mo · ≤1 miLoading sold comps…