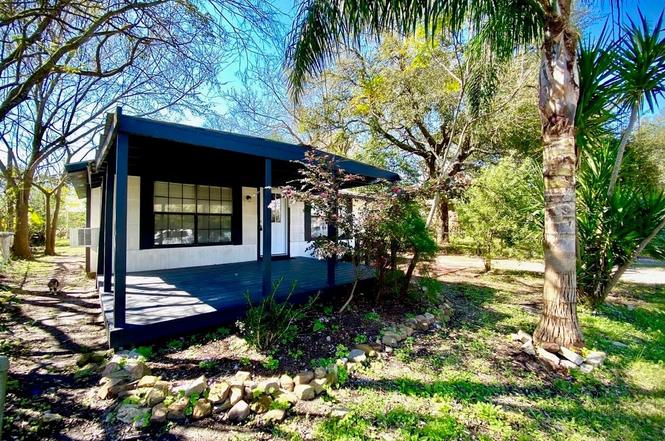
4730 Oleander St · Bacliff, TX
Flood risk 7/10 · Major
- FEMA flood zone
- X (shaded)
- Chance of flooding over 30 yrs
- 0.76%
- Est. flood insurance / yr
- $507 – $1,088
Fire risk 2/10 · Minimal
- Est. fire insurance / yr
- $1,222 – $2,270
Heat risk 10/10 · Severe
- Hot days now (above 109°F)
- 7 days/yr
- Hot days in 30 yrs
- 26 days/yr
Wind risk 9/10 · Severe
- Chance of severe wind over 30 yrs
- 99.0%
Air-quality risk 2/10 · Minimal
- Unhealthy air days now
- 1 days/yr
- Unhealthy air days in 30 yrs
- 1 days/yr
Risk factors via First Street. Map © Google.
Why this score? — see what drove the B grade
The composite is a weighted blend of 9 inputs, each scored 0–100. Each bar is that input's sub-score; the figure is the points it added to the 100-point composite (weight × sub-score).
- Cash flow +29.4/30.0
- ARV discount +11.0/15.0
- DSCR +10.0/10.0
- 1% rule +8.5/10.0
- Schools +3.5/10.0
- Livability +2.9/5.0
- Rent growth +2.5/5.0
- Condition / age +2.5/5.0
- Appreciation +0.0/10.0
$135,000
🖨 Deal sheet 📄 Offer letter ✓ Due diligence
Listing remarks MLS
Investor special! This house hasn't been on the market in over 50 years! Though the home needs some work and updating it will become an amazing property with your personal touches! Hurry and come see it before it's to late!
Key facts
- Near galveston bay
- Fenced backyard
- 6,250 sq ft lot
Tags
Property features AI
Finance
- Financial info: Lease considered
Exterior
- Parking: No designated parking
- Utilities: Public water; Public sewer
- Home design: Residential property; Built in 1940; Pillar/post/pier foundation
- Construction: Cement siding; Wood siding; Composition roof
- Exterior features: Subdivision lot
Interior
- Kitchen: Dishwasher; Electric oven; Electric range
- Bedrooms: Three bedrooms total; Bedroom (First floor) — 15 x 8; Bedroom (First floor) — 11 x 8; Primary bedroom (First floor) — 12 x 7
- Bathrooms: 1 full bathroom
- Heating & cooling: Window unit heating; Window unit cooling
- Interior features: Tub/shower; Ceiling fan(s)
- Laundry & utility: Washer hookup; Electric dryer hookup
Neighborhood map
What this means for you Summary
Snapshot
- This is a 3-bed/1.0-bath single-family listed at $135k.
Deal economics
- At list price, monthly cash flow is $413 ($5k/yr) — positive.
- The deal already cash-flows at list — no discount required.
- Meets the 1% rule at list price ($2k rent vs $135k).
- Recommended offer: $119k (12.0% below list) — sets the bar for market timing.
- Cap rate 10.6% vs local median 5.0% in Bacliff — top-decile yield for the area; either an underpriced asset or a hidden risk that comps aren't pricing in. Stress-test before assuming the spread holds.
Location & tenants
- Location reads 57/100 on livability (#1,252 in TX) — a working-class tenant base; expect higher turnover. Strengths: cost of living A+, housing A+; Watch: employment D+, crime D, amenities F.
- Dickinson ISD (suburban): math 39% / reading 40% proficiency, ranked #366 of 826 in TX (top 44%) — families likely to look elsewhere, expect single-tenant / working-renter base with shorter leases; 60% free/reduced lunch — lower-income household profile, screen leases tightly.
- Zoned schools: Kenneth E Little El (math 32% / reading 25%, grade F, #2,706 of 4,322 statewide, top 63%, 648 students, 88% FRL); Dunbar Middle (math 25% / reading 20%, grade F, #1,341 of 1,662 statewide, top 82%, 654 students, 78% FRL); Dickinson H S (math 30% / reading 46%, grade F, #880 of 1,632 statewide, top 54%, 3,619 students, 64% FRL) — zoned schools average 77% FRL vs 60% district-wide (16 pts higher); higher-poverty schools than district average — tighter screening recommended.
- Market conditions: 62 active listings in the ZIP; 2 comparable units currently listed for rent nearby; 3,258 units permitted in Galveston County in 2024 (0 in 5+ unit buildings).
- This rent runs 43% of the median local income ($51k/yr) — at the standard rent-burdened threshold; future hikes will face affordability resistance.
Forward outlook
- Local home prices are declining (-3.0%/yr); year-one equity from $933 of loan paydown is wiped out by about $4k of value loss. Plan a longer hold.
- Galveston County population projected at +43% by 2050 — long-run rental-demand tailwind backs the buy-and-hold thesis.
- At projected returns (-3.0% appreciation + 3.0% rent growth), your $38k cash investment doubles in ~9 years — after that, you're playing with house money.
Negotiation context
- It's been on market 193 days — a 12% lower offer ($119k) is reasonable based on typical stale-listing flexibility.
- 2 sale attempts since 8y ago; this cycle's ask has dropped $10k (7%) from the opening price — seller is motivated, your offer sets the floor, not the list.
Risks & watch-outs
- Watch-outs: flood insurance adds $66/mo; built in 1940 — expect roof / HVAC / electrical / plumbing capex.
- Climate carrying-cost: major flood risk; severe wind risk, 99% chance of damaging wind over 30y; extreme-heat days projected 7→26/yr by 2055 (HVAC capex compounding) — expect insurance premiums to compound above CPI over the hold.
Questions for the listing agent
- It's been on market 193 days. Have you received any prior offers? Is the seller open to a 12% concession, seller financing, or rate buy-down credit?
- Built in 1940 — when were the roof, HVAC, electrical panel, plumbing, and water heater last replaced?
- What's the actual annual flood-insurance premium (NFIP or private), and is the property in a SFHA with mandatory coverage?
- Why hasn't it sold? Are there any deal-killer items the seller is aware of (foundation, flood, title, zoning, code violations)?
- Is there a deadline driving the sale (1031 exchange, divorce, estate, relocation)? That informs how much negotiation room exists.
- Schools are F-rated, which usually means shorter tenancies and higher turnover. Who's the typical renter profile here, and what's been the actual vacancy rate?
- Crime grade is D in this area — have there been break-ins, vandalism, or insurance claims at this property in the last 3 years? What carrier currently insures it and at what premium?
- What's the average days-on-market for RENTAL listings here right now (not sales)? A rising rental-DOM trend means longer vacancies and softer asking-rent achievability than the comps imply.
- What's the recent tenant-quality profile in this submarket — average credit score on applications, eviction rate, late-payment / NSF rate, and stable-employment percentage? A property-management company in the area should have these aggregated.
- How much new for-sale + rental construction is in the pipeline within 1–3 miles? Heavy new supply typically softens prices + rents 12–24 months out; constrained supply supports both.
Investment metrics
- 1% rule
- 1.35% ✓
- Cap rate
- 10.56%
- Cash-on-cash
- 15.23%
- DSCR
- 1.68
- GRM
- 6.2
CMA / ARV
- ARV (on-the-fly)
- $146,400
- Comps found
- 7
Show comp detail 7 sales within ~0.75 mi
| Address | Dist | Beds/Ba | Sqft | Sold | Price | $/sf | Match |
|---|---|---|---|---|---|---|---|
| 4730 Oleander St | 0.00mi | 3/1.0 | 915 (0%) | 0mo | $135,000 | $148 | 100 |
| 4222 Houx St | 0.58mi | 2/1.0 (-1) | 944 (+3%) | 17mo | $159,900 | $169 | 48 |
| 4446 1st St | 0.26mi | 2/1.0 (-1) | 1,024 (+12%) | 22mo | $125,500 | $123 | 44 |
| 506 Oklahoma Ave | 0.74mi | 3/2.0 | 996 (+9%) | 3mo | $175,000 | $176 | 44 |
| 4111 Brown St | 0.71mi | 2/1.0 (-1) | 850 (-7%) | 10mo | $134,900 | $159 | 42 |
| 303 Texas Ave | 0.75mi | 2/1.0 (-1) | 832 (-9%) | 6mo | $132,900 | $160 | 40 |
| 4102 Houx St | 0.69mi | 2/1.0 (-1) | 840 (-8%) | 24mo | $159,900 | $190 | 30 |
Match score weights: distance 35% · size 25% · config 20% · recency 20%. Top-matched comps best support the ARV.
Projected returns pro-forma
-3.0% appreciation · 3.0% rent growth · sell at horizon
- IRR
- 3.1%
- Equity multiple
- 1.12×
- Total profit
- $4,525
- Equity at exit
- $20,129
- IRR
- 12.7%
- Equity multiple
- 2.01×
- Total profit
- $38,180
- Equity at exit
- $11,672
Cash invested: $37,800 (down + closing). Projections, not guarantees.
Landlord ↔ Tenant lean methodology
- Overall (STATE)
- 87 Strongly Landlord-Friendly
- State Texas
- 87 Strongly Landlord-Friendly · R+5
- County
- — inherits STATE
- City
- — inherits STATE
ZIP-level market 77518
- Home prices YoY
- -7.6%
- Active inventory
- 62
- Price-to-rent
- 6.2×
Monthly cashflow live
- Estimated rent
- $1,828 medium interval (Pro) →
- Mortgage (P&I)
- −$708
- Tax from tax record
- −$201 /mo · $2,409/yr
- Insurance
- −$56
- Flood insurance flood zone
- −$66 /mo · $798/yr
- HOA
- −$0
- Vacancy / Maint / Mgmt
- −$384
- Net cashflow
- $413
Break-even live
UW: 25.0% down · 7.5% · 30yr · 1.5% tax · 5.0% vac · 8.0% maint · 8.0% mgmt
Financing live
Cash to close
- Down payment
- $33,750
- Closing costs
- $4,050
- Reserves months
- —
- Total cash needed
- —
Loan-product check · same deal, 3 products live
Conventional
25% down · 7.5% · 30yr
- Down + closing
- —
- Monthly P&I
- —
- Monthly cashflow
- —
- DSCR
- —
- Eligible?
- —
Personal DTI + credit; lowest rate.
DSCR
20% down · 8.5% · 30yr
- Down + closing
- —
- Monthly P&I
- —
- Monthly cashflow
- —
- DSCR
- —
- Eligible?
- —
No personal income docs; deal must DSCR.
Hard money
10% down · 12.0% · 12mo
- Down + closing
- —
- Monthly P&I
- —
- Monthly cashflow
- —
- DSCR
- —
- Eligible?
- —
Short-term bridge; refi at stabilization.
Rent comps 2 comps
| Address | Beds | Baths | Sqft | Rent | $/sqft | DOM | Units | Dist |
|---|---|---|---|---|---|---|---|---|
| 804 E AVE Unit 2 Bacliff, TX | 2.0 | 1.0 | 850 | $1,100 | $1.29 | 43d | 1 | 0.37mi |
| 320 Louisiana Ave Bacliff, TX | 2.0 | 1.0 | 786 | $2,150 | $2.74 | 1d | 1 | 0.84mi |
Listing history 10 events
-
2026-05-11status Pending
-
2026-04-29status Pending
-
2026-04-15price $135,000
-
2025-10-29$145,000 Active
-
2019-02-15soldstatus Sold 223-char remark
Show marketing remark (223 chars)
Investor special! This house hasn't been on the market in over 50 years! Though the home needs some work and updating it will become an amazing property with your personal touches! Hurry and come see it before it's to late!
-
2019-02-15soldstatus
Show marketing remark (223 chars)
Investor special! This house hasn't been on the market in over 50 years! Though the home needs some work and updating it will become an amazing property with your personal touches! Hurry and come see it before it's to late!
-
2019-01-14status Pending, Continue to Show 223-char remark
Show marketing remark (223 chars)
Investor special! This house hasn't been on the market in over 50 years! Though the home needs some work and updating it will become an amazing property with your personal touches! Hurry and come see it before it's to late!
-
2018-11-27$50,000 Active 223-char remark
Show marketing remark (223 chars)
Investor special! This house hasn't been on the market in over 50 years! Though the home needs some work and updating it will become an amazing property with your personal touches! Hurry and come see it before it's to late!
-
2007-04-19soldstatus
-
2006-08-01soldstatus
ⓘ Source: listings_history table (triggers on properties + properties_extension) + one-shot
backfill from property_details.listing_events for pre-trigger history.
Tax reassessment forecast TX · Resets to sale price
- Current annual tax
- $2,409 · $201/mo
- Projected year-2 tax
- $2,470 · $206/mo
- Expected delta
- +$62/yr (+$5/mo · 2.6%)
ⓘ Screening estimate from a state-policy table — verify with the county assessor before closing.
Climate risk First Street
- Flood 7/10 Severe FEMA zone X (shaded) · 76% chance over 30 yrs
- Wildfire 2/10 Low
- Heat 10/10 Extreme 7 d/yr ≥109°F today · 26 d/yr by 30 yrs out
- Wind 9/10 Extreme 99% chance of damaging wind over 30 yrs
- Air quality 2/10 Low 1 unhealthy d/yr today · 1 by 30 yrs out
Nearby sold comps map
Loading sold comps map…
Walkable amenities ~0.75 mi
Loading nearby amenities…
Taxation est. · year 1
- Rental income
- $21,942
- − Mortgage interest
- −$7,562
- − Property taxes
- −$2,409
- − Insurance
- −$1,472
- − Repairs & maintenance
- −$1,755
- − Management
- −$1,755
- − Depreciation
- −$3,927
- Taxable income
- $3,061
- Est. tax owed @ 24.0%
- −$735
- After-tax cash flow
- $4,223/yr
For passive investors: Depreciation is non-cash, so a rental often shows a tax loss while cash-flowing — sheltering income. Rental losses are passive: they offset passive income freely, and up to $25,000/yr can offset ordinary (W-2) income if you actively participate and your MAGI is under $100k (phasing out to $0 by $150k); unused losses carry forward. On sale, claimed depreciation is recaptured at up to 25%, and gains may owe capital-gains tax (a 1031 exchange can defer both). Figures are a year-1 estimate at your 24.0% rate — not tax advice; consult a CPA.
Schools (NCES district)
- District
- Dickinson ISD
- NCES district ID
- 4817070
- Math proficiency
- 39% ▼ -11.00%
- Reading proficiency
- 40% ▼ -2.00%
- Median HH income
- $61,318
- Composite
- 35.16/100
- National rank
- #5005
- State rank
- #366 of 826 in TX
Livability — Bacliff
- Score
- 57/100
- State rank
- #1252
- US rank
- #21864
Category grades
Schools grade is shown separately in the Schools card above.
Census & demographics
- Census place
- Bacliff, TX
- County
- Galveston County · 357,330 people
- City population
- 9,541
- Metro
- Houston-The Woodlands-Sugar Land, TX
- Population (ZIP)
- 9,541
- Household income
- $51,458
- Rent vs Own
- Severe rent burden
- 672.0
Population outlook (Galveston County) Hauer SSP2
- Today (2025)
- 390,640 people
- By 2030
- 425,226 · +8.9%
- By 2040
- 493,765 · +26.4%
- By 2050
- 559,698 · +43.3%
- By 2075
- 719,260 · +84.1%
- By 2100
- 819,628 · +109.8%
Race, ethnicity, and origin ACS 2023
- Neighborhood character
- Diverse neighborhood (Simpson 0.60)
- Race & ethnicity
- Hispanic / Latino 46% White 43% Two or more races 21% Black 7% Asian 2% Native American 1%
- Hispanic origin (detail)
- Mexican 31%
- Common ancestry
- Slovak 3% Lithuanian 2% Romanian 1%
- Foreign-born
- 15% · Canada, Vietnam, China
- Languages at home
- 66% English-only · Spanish 32% Vietnamese 1%
Political lean MEDSL · Galveston
- 2024 margin
- Strong R (+27.4) · D 35.7% · R 63.1% · Other 1.2%
- 2008→2024 swing
- -7.9pp toward R · 2008: -19.5pp · 2024: -27.4pp
- All cycles
- 2024: R+27.4 2020: R+22.6 2016: R+22.6 2012: R+26.9 2008: R+19.5
Not yet ingested
- Civics
- —
Market trends
- HPI YoY
- ▼ -24.15%
- Current HPI
- 293.2677
- Rent YoY
- —
- Metro
- Houston-The Woodlands-Sugar Land, TX
- State GDP YoY
- ▲ 3.95%
- F500 in state
- 110
Industry mix (Fortune 500 HQ in TX)
| Industry | F500 HQs | Revenue |
|---|---|---|
| Energy | 16 | $1,198B |
|
||
| Technology | 5 | $198B |
|
||
| Engineering / Construction | 4 | $72B |
|
||
| Energy Services | 3 | $60B |
|
||
| Utilities | 3 | $41B |
|
||
| Healthcare | 2 | $330B |
|
||
Price history
+170.0% since first listed10 events — show timeline
- 2026-05-11 Pending — HARMLS
- 2026-04-29 Pending — HARMLS
- 2026-04-15 Price Changed $135,000 HARMLS
- 2025-10-29 Listed $145,000 HARMLS
- 2019-02-15 Sold (Public Records) — Public Records
- 2019-02-15 Sold (MLS) — HARMLS
- 2019-01-14 Pending — HARMLS
- 2018-11-27 Listed $50,000 HARMLS
- 2007-04-19 Sold (Public Records) — Public Records
- 2006-08-01 Sold (Public Records) — Public Records
Property tax history
+9.6%/yrLatest (2025): $2,409 · -1.6% YoY. Source: county tax records.
Cash-flow waterfall
monthlySold comps — $/sqft
last 12 mo · ≤1 miLoading sold comps…