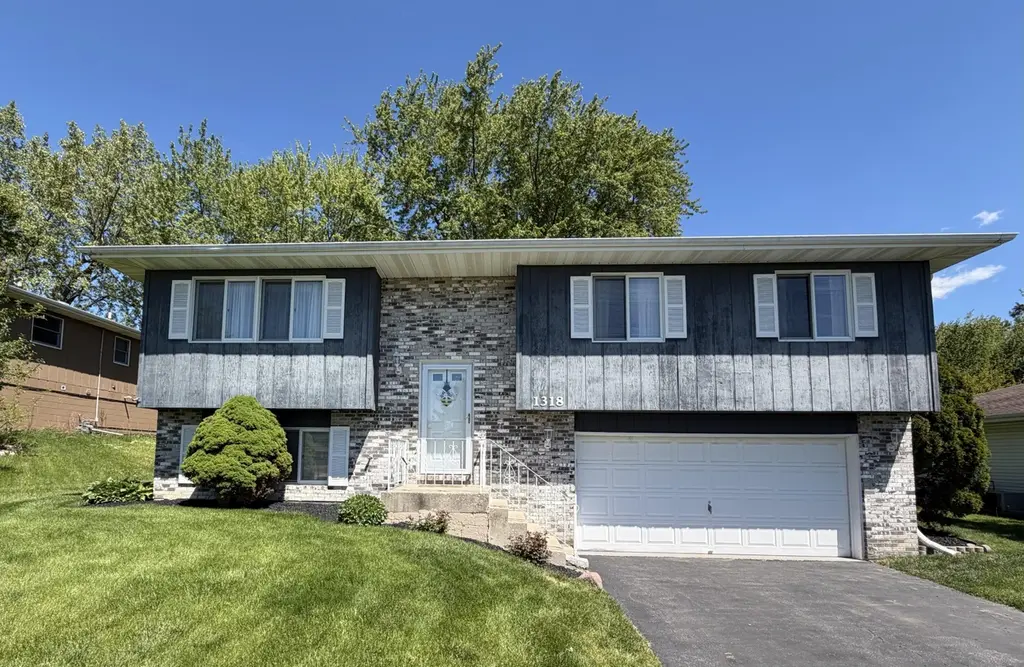
1318 Brandywine Rd · Lakes of the Four Seasons, IN
Flood risk 1/10 · Minimal
- FEMA flood zone
- X (unshaded)
- Chance of flooding over 30 yrs
- 0.0%
- Est. flood insurance / yr
- $507 – $1,088
Fire risk 4/10 · Minor
- Est. fire insurance / yr
- $717 – $1,331
Heat risk 2/10 · Minimal
- Hot days now (above 100°F)
- 7 days/yr
- Hot days in 30 yrs
- 16 days/yr
Wind risk 2/10 · Minimal
- Chance of severe wind over 30 yrs
- —
Air-quality risk 2/10 · Minimal
- Unhealthy air days now
- 1 days/yr
- Unhealthy air days in 30 yrs
- 1 days/yr
Risk factors via First Street. Map © Google.
Why this score? — see what drove the D grade
The composite is a weighted blend of 9 inputs, each scored 0–100. Each bar is that input's sub-score; the figure is the points it added to the 100-point composite (weight × sub-score).
- ARV discount +14.7/15.0
- Cash flow +8.9/30.0
- Schools +3.8/10.0
- Livability +3.5/5.0
- Rent growth +3.1/5.0
- DSCR +2.5/10.0
- Condition / age +2.5/5.0
- 1% rule +2.4/10.0
- Appreciation +0.0/10.0
$309,900
🖨 Deal sheet (PDF) 📄 Offer letter ✓ Due diligence
Listing remarks
Welcome to the highly sought-after Lakes of the Four Seasons--where resort-style living meets everyday comfort! This well-maintained bi-level home offers 3 bedrooms and 3 baths, featuring a fully updated kitchen with stylish new cabinetry and countertops--perfect for both daily living and entertaining. The updated bathrooms add a fresh, modern touch, while the spacious main bedroom boasts its own private en-suite bath for added comfort and privacy. Step from the dining area through the newer sliding glass door onto a relaxing outdoor deck, overlooking a serene backyard with no rear neighbors--your own private retreat. The lower level provides a generously sized recreation room, complete wit
Key facts
- Swimming pool
- Updated bathrooms
- Serene backyard
Tags
Property features AI
Finance
- HOA & community: Part of homeowners association (Lakes of the Four Seasons); Annual association fee; Community amenities include park, pool, playground, and snow removal; Association handles snow removal
Exterior
- Parking: Attached garage with garage door opener; Driveway; Garage faces front; 2-car garage
- Utilities: Public water; Public sewer; Natural gas connected; Electricity connected (200+ amp service); Cable connected
- Home design: Built in 1988
- Construction: Brick and wood siding exterior; Asphalt shingle roof
- Exterior features: Deck; Rain gutters; Neighborhood and trees/woods view; No pool
Interior
- Kitchen: Gas range; Dishwasher; Refrigerator; Granite counters
- Bedrooms: Primary bedroom; Two additional bedrooms
- Flooring: Carpet
- Bathrooms: One full bathroom; One three-quarter bathroom; One half bathroom
- Heating & cooling: Forced air heating (natural gas); Central air conditioning; Ceiling fans
- Interior features: Granite countertops; Country-style kitchen; Laundry room on lower level with utility sink
- Laundry & utility: Washer and dryer included; Gas dryer hookup; Washer hookup; Gas water heater
Neighborhood map
What this means for you Summary
Snapshot
- This is a 3-bed/1.5-bath single-family listed at $310k.
Deal economics
- At list price, monthly cash flow is $-248 ($-3k/yr) — negative.
- To cash-flow at today's rent, offer at most $266k (14.1% below list).
- To meet the 1% rule (rent ≥ 1% of price), the offer needs to be $230k (25.7% below list).
- Recommended offer: $230k (25.7% below list) — sets the bar for 1% rule.
- Cap rate 5.3% vs local median 3.3% in Lakes of the Four Seasons — top-decile yield for the area; either an underpriced asset or a hidden risk that comps aren't pricing in. Stress-test before assuming the spread holds.
Location & tenants
- Location reads 69/100 on livability (#190 in IN) — a middle-class / working-renter tenant base. Strengths: crime A+, employment A+, housing A+; Watch: amenities F, commute F, health & safety D-.
- Porter Township School Corporation (rural): math 33% / reading 49% proficiency, ranked #103 of 301 in IN (top 34%) — families likely to look elsewhere, expect single-tenant / working-renter base with shorter leases; only 17% free/reduced lunch — higher-income household profile.
- Zoned schools: Porter Lakes Elementary School (math 62% / reading 62%, grade B, #101 of 994 statewide, top 12%, 527 students, 34% FRL); Boone Grove Middle School (math 21% / reading 45%, grade F, #180 of 330 statewide, top 56%, 323 students, 34% FRL); Boone Grove High School (math 32% / reading 67%, grade D, #123 of 369 statewide, top 36%, 486 students, 29% FRL) — zoned schools average 32% FRL vs 17% district-wide (16 pts higher); higher-poverty schools than district average — tighter screening recommended.
- Market conditions: Rents rising (+2.5%/yr); 753 active listings in the ZIP; 3 comparable units currently listed for rent nearby; rentals leasing fast (median 1d on market — plan ~1-2 weeks tenant-placement turnaround); solid renter incomes; 542 units permitted in Porter County in 2024 (0 in 5+ unit buildings).
Forward outlook
- Local home prices are declining (-3.0%/yr); year-one equity from $2k of loan paydown is wiped out by about $9k of value loss. Plan a longer hold.
- Porter County population projected at +6% by 2050 — modest demand growth; plan on rents tracking national, not racing it.
Negotiation context
- It's been on market 45 days — a 3% lower offer ($301k) is reasonable based on typical stale-listing flexibility.
- 2 sale attempts since 16y ago with the ask held roughly flat each time — persistent listings suggest the price (not the market) is what's stuck; bring a comps-based counter.
Questions for the listing agent
- What do current leases actually rent for vs. the listed asking? Can we see a recent rent roll and the last 12 months of T-12 income?
- It's been on market 45 days. Have you received any prior offers? Is the seller open to a 26% concession, seller financing, or rate buy-down credit?
- What does the HOA fee cover, when was the last increase, and are there any pending special assessments or reserve-fund shortfalls?
- Is there a deadline driving the sale (1031 exchange, divorce, estate, relocation)? That informs how much negotiation room exists.
- Schools are D-rated, which usually means shorter tenancies and higher turnover. Who's the typical renter profile here, and what's been the actual vacancy rate?
- The area grade is low — what's the realistic commute time and amenity access for the typical tenant pool here? Any planned neighborhood developments (good or bad) we should know about?
- What's the average days-on-market for RENTAL listings here right now (not sales)? A rising rental-DOM trend means longer vacancies and softer asking-rent achievability than the comps imply.
- What's the recent tenant-quality profile in this submarket — average credit score on applications, eviction rate, late-payment / NSF rate, and stable-employment percentage? A property-management company in the area should have these aggregated.
- How much new for-sale + rental construction is in the pipeline within 1–3 miles? Heavy new supply typically softens prices + rents 12–24 months out; constrained supply supports both.
Investment metrics
- 1% rule
- 0.74% ✗
- Cap rate
- 5.33%
- Cash-on-cash
- -3.43%
- DSCR
- 0.85
- GRM
- 11.2
CMA / ARV
- ARV (median comp)
- $369,383
- List price
- $309,900
- Delta
- -16.10%
- Verdict
- UNDERPRICED
- Comps
- 20 within 1.0 mi
Show comp detail 12 sales within ~0.75 mi
| Address | Dist | Beds/Ba | Sqft | Sold | Price | $/sf | Match |
|---|---|---|---|---|---|---|---|
| 1128 Country Club Dr | 0.37mi | 4/3.0 (+1) | 2,078 (+1%) | 0mo | $320,000 | $154 | 70 |
| 1293 Brandywine Rd | 0.17mi | 3/2.5 | 1,806 (-12%) | 1mo | $250,000 | $138 | 67 |
| 1275 Brandywine Rd | 0.30mi | 4/2.0 (+1) | 1,962 (-4%) | 10mo | $338,000 | $172 | 64 |
| 1515 Happy Valley Rd | 0.49mi | 3/2.5 | 1,985 (-3%) | 7mo | $325,000 | $164 | 62 |
| 1588 Sunnyslope Dr | 0.50mi | 4/2.5 (+1) | 2,040 (-1%) | 8mo | $450,000 | $221 | 60 |
| 1397 Brandywine Rd | 0.44mi | 3/1.5 | 1,840 (-10%) | 5mo | $207,000 | $113 | 58 |
| 1586 Sunnyslope Dr | 0.50mi | 3/1.5 | 1,848 (-10%) | 4mo | $290,000 | $157 | 57 |
| 1603 Sunnyslope Dr | 0.59mi | 2/3.0 (-1) | 2,045 (-0%) | 6mo | $399,900 | $196 | 56 |
| 1608 Sunnyslope Dr | 0.58mi | 3/1.5 | 2,236 (+9%) | 5mo | $322,000 | $144 | 54 |
| 717 Druim Trl | 0.74mi | 3/2.0 | 2,270 (+11%) | 3mo | $498,795 | $220 | 43 |
| 3002 Sunrise Dr | 0.63mi | 4/2.5 (+1) | 2,288 (+12%) | 2mo | $430,000 | $188 | 41 |
| 3003 Sunrise Dr | 0.67mi | 2/2.5 (-1) | 1,764 (-14%) | 9mo | $240,000 | $136 | 29 |
Match score weights: distance 35% · size 25% · config 20% · recency 20%. Top-matched comps best support the ARV.
Projected returns pro-forma
-3.0% appreciation · 2.53% rent growth · sell at horizon
- IRR
- -22.6%
- Equity multiple
- 0.23×
- Total profit
- $-67,121
- Equity at exit
- $46,207
- IRR
- -18.0%
- Equity multiple
- 0.04×
- Total profit
- $-83,255
- Equity at exit
- $26,794
Cash invested: $86,772 (down + closing). Projections, not guarantees.
Landlord ↔ Tenant lean methodology
- Overall (STATE)
- 90 Strongly Landlord-Friendly
- State Indiana
- 90 Strongly Landlord-Friendly · R+11
- County
- — inherits STATE
- City
- — inherits STATE
ZIP-level market 46307
- Rents YoY
- 2.5%
- Active inventory
- 753
- Price-to-rent
- 11.2×
Monthly cashflow live
- Estimated rent
- $2,303 medium interval (Pro) →
- Mortgage (P&I)
- −$1,625
- Tax from tax record
- −$159 /mo · $1,912/yr
- Insurance
- −$129
- HOA
- −$154
- Vacancy / Maint / Mgmt
- −$484
- Net cashflow
- $-248
Break-even live
Sensitivity live
| Price | -10% $-73 | -5% $-161 | +0% $-248 | +5% $-336 | +10% $-424 |
|---|---|---|---|---|---|
| Rent | -10% $-430 | -5% $-339 | +0% $-248 | +5% $-157 | +10% $-66 |
| Rate | -1.0pp $-92 | -0.5pp $-169 | base $-248 | +0.5pp $-329 | +1.0pp $-410 |
UW: 25.0% down · 7.5% · 30yr · 1.5% tax · 5.0% vac · 8.0% maint · 8.0% mgmt
Financing live
Cash to close
- Down payment
- $77,475
- Closing costs
- $9,297
- Reserves months
- —
- Total cash needed
- —
Loan-product check · same deal, 3 products live
Conventional
25% down · 7.5% · 30yr
- Down + closing
- —
- Monthly P&I
- —
- Monthly cashflow
- —
- DSCR
- —
- Eligible?
- —
Personal DTI + credit; lowest rate.
DSCR
20% down · 8.5% · 30yr
- Down + closing
- —
- Monthly P&I
- —
- Monthly cashflow
- —
- DSCR
- —
- Eligible?
- —
No personal income docs; deal must DSCR.
Hard money
10% down · 12.0% · 12mo
- Down + closing
- —
- Monthly P&I
- —
- Monthly cashflow
- —
- DSCR
- —
- Eligible?
- —
Short-term bridge; refi at stabilization.
Rent comps 3 comps
| Address | Beds | Baths | Sqft | Rent | $/sqft | DOM | Units | Dist |
|---|---|---|---|---|---|---|---|---|
| 1586 Sunnyslope Dr Crown Point, IN | 3.0 | 1.5 | 1848 | $2,400 | $1.30 | 0d | 1 | 0.51mi |
| 10859 Park St Crown Point, IN | 3.0 | 2.0 | 1800 | $2,200 | $1.22 | 3d | 1 | 1.49mi |
| 10859 Park St Unit Park Crown Point, IN | 3.0 | 2.0 | 1600 | $2,200 | $1.38 | 0d | 1 | 1.49mi |
HOA detail
- Monthly dues
- $154 · $1,848/yr
Listing history 17 events
-
2026-06-21days on market $309,900 Active 45 DOM
-
2026-06-18days on market $309,900 Active 42 DOM
-
2026-06-17days on market $309,900 Active 41 DOM
-
2026-06-16days on market $309,900 Active 40 DOM
-
2026-06-15days on market $309,900 Active 39 DOM
-
2026-06-13pricedays on market $309,900 Active 37 DOM
-
2026-06-09days on market $319,900 Active 33 DOM
-
2026-06-08days on market $319,900 Active 32 DOM
-
2026-06-07days on market $319,900 Active 31 DOM
-
2026-06-04days on market $319,900 Active 28 DOM
-
2026-06-03days on market $319,900 Active 27 DOM
-
2026-06-02days on market $319,900 Active 26 DOM
-
2026-06-01days on market $319,900 Active 25 DOM
-
2026-05-31days on market $319,900 Active 24 DOM
-
2026-05-07$319,900 Active 1269-char remark
-
2011-07-26historical
-
2010-07-24$156,000
ⓘ Source: listings_history table (triggers on properties + properties_extension) + one-shot
backfill from property_details.listing_events for pre-trigger history.
Tax reassessment forecast IN · Partial reset (capped growth)
- Current annual tax
- $1,912 · $159/mo
- Projected year-2 tax
- $2,273 · $189/mo
- Expected delta
- +$361/yr (+$30/mo · 18.9%)
ⓘ Screening estimate from a state-policy table — verify with the county assessor before closing.
Climate risk First Street
- Flood 1/10 Low FEMA zone X (unshaded) · 0% chance over 30 yrs
- Wildfire 4/10 Moderate
- Heat 2/10 Low 7 d/yr ≥100°F today · 16 d/yr by 30 yrs out
- Wind 2/10 Low
- Air quality 2/10 Low 1 unhealthy d/yr today · 1 by 30 yrs out
Nearby sold comps map
Loading sold comps map…
Walkable amenities ~0.75 mi
Loading nearby amenities…
Taxation est. · year 1
- Rental income
- $27,637
- − Mortgage interest
- −$17,359
- − Property taxes
- −$1,912
- − Insurance
- −$1,550
- − Repairs & maintenance
- −$2,211
- − Management
- −$2,211
- − HOA
- −$1,848
- − Depreciation
- −$9,015
- Taxable loss
- −$8,470
- Est. tax savings @ 24.0%
- +$2,033
- After-tax cash flow
- $-946/yr
For passive investors: Depreciation is non-cash, so a rental often shows a tax loss while cash-flowing — sheltering income. Rental losses are passive: they offset passive income freely, and up to $25,000/yr can offset ordinary (W-2) income if you actively participate and your MAGI is under $100k (phasing out to $0 by $150k); unused losses carry forward. On sale, claimed depreciation is recaptured at up to 25%, and gains may owe capital-gains tax (a 1031 exchange can defer both). Figures are a year-1 estimate at your 24.0% rate — not tax advice; consult a CPA.
Schools (NCES district)
- District
- Porter Township School Corporation
- NCES district ID
- 1809180
- Math proficiency
- 33% ▼ -7.00%
- Reading proficiency
- 49% ▼ -4.00%
- Median HH income
- $77,819
- Composite
- 37.92/100
- National rank
- #4311
- State rank
- #103 of 301 in IN
Livability — Lakes of the Four Seasons
- Score
- 69/100
- State rank
- #190
- US rank
- #8734
Category grades
Schools grade is shown separately in the Schools card above.
Census & demographics
- Census place
- Lakes of the Four Seasons, IN
- County
- Lake County · 422,878 people
- City population
- 71,673
- Metro
- Chicago-Naperville-Elgin, IL-IN-WI
- Population (ZIP)
- 71,673
- Household income
- $107,800
- Rent vs Own
- Severe rent burden
- 705.0
Population outlook (Porter County) Hauer SSP2
- Today (2025)
- 177,804 people
- By 2030
- 181,552 · +2.1%
- By 2040
- 185,830 · +4.5%
- By 2050
- 187,498 · +5.5%
- By 2075
- 189,585 · +6.6%
- By 2100
- 183,722 · +3.3%
Race, ethnicity, and origin ACS 2023
- Neighborhood character
- Predominantly White (76%)
- Race & ethnicity
- White 76% Hispanic / Latino 12% Two or more races 10% Black 7% Asian 2%
- Hispanic origin (detail)
- Mexican 9% Puerto Rican 1%
- Common ancestry
- Romanian 12% Iranian 3% Lithuanian 2%
- Foreign-born
- 7% · Canada, Vietnam
- Languages at home
- 88% English-only · Spanish 5% Russian/Polish/Slavic 3% Other Indo-European 1%
Political lean MEDSL · Porter
- 2024 margin
- R (+10.5) · D 43.8% · R 54.3% · Other 1.8%
- 2008→2024 swing
- -17.7pp toward R · 2008: 7.2pp · 2024: -10.5pp
- All cycles
- 2024: R+10.5 2020: R+6.1 2016: R+6.8 2012: D+3.8 2008: D+7.2
Not yet ingested
- Civics
- —
Market trends
- HPI YoY
- ▼ -164.91%
- Current HPI
- 226.0335
- Rent YoY
- ▲ 2.53%
- Metro
- Chicago-Naperville-Elgin, IL-IN-WI
- State GDP YoY
- ▲ 2.90%
- F500 in state
- 18
Industry mix (Fortune 500 HQ in IN)
| Industry | F500 HQs | Revenue |
|---|---|---|
| Industrial Machinery | 2 | $37B |
|
||
| Healthcare | 1 | $177B |
|
||
| Pharmaceuticals | 1 | $45B |
|
||
| Metals / Steel | 1 | $18B |
|
||
| Agriculture | 1 | $17B |
|
||
| Packaging | 1 | $12B |
|
||
Price history
+98.7% since first listed4 events — show timeline
- 2026-06-11 Price Changed $309,900 NIRA MLS as Distributed by MLS Grid
- 2026-05-07 Listed $319,900 NIRA MLS as Distributed by MLS Grid
- 2011-07-26 Listing Removed — NIRA MLS as Distributed by MLS Grid
- 2010-07-24 Listed $156,000 NIRA MLS as Distributed by MLS Grid
Property tax history
+6.2%/yrLatest (2024): $1,912 · +19.3% YoY. Source: county tax records.
Cash-flow waterfall
monthlySold comps — $/sqft
last 12 mo · ≤1 miLoading sold comps…