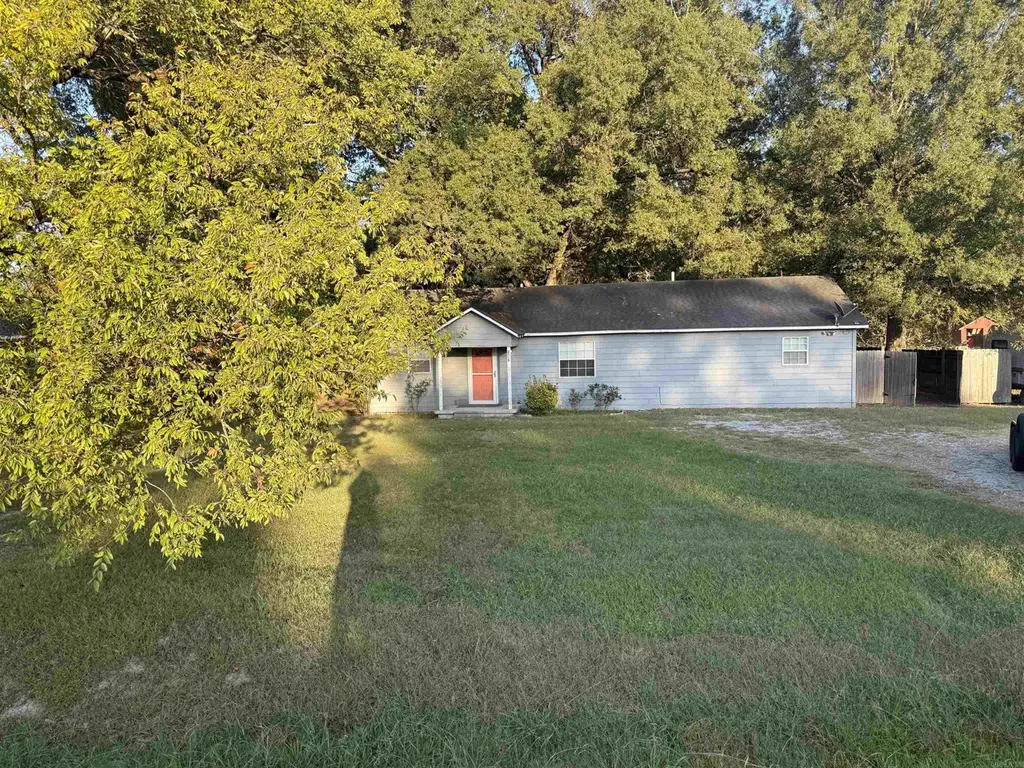
626 N Holman St · Brookland, AR
Flood risk 6/10 · Moderate
- FEMA flood zone
- X
- Chance of flooding over 30 yrs
- 0.71%
- Est. flood insurance / yr
- $507 – $1,088
Fire risk 4/10 · Minor
- Est. fire insurance / yr
- $1,499 – $2,785
Heat risk 5/10 · Moderate
- Hot days now (above 110°F)
- 7 days/yr
- Hot days in 30 yrs
- 21 days/yr
Wind risk 4/10 · Minor
- Chance of severe wind over 30 yrs
- 8.0%
Air-quality risk 1/10 · Minimal
- Unhealthy air days now
- 0 days/yr
- Unhealthy air days in 30 yrs
- 0 days/yr
Risk factors via First Street. Map © Google.
Why this score? — see what drove the B grade
The composite is a weighted blend of 9 inputs, each scored 0–100. Each bar is that input's sub-score; the figure is the points it added to the 100-point composite (weight × sub-score).
- Cash flow +21.5/30.0
- ARV discount +15.0/15.0
- Appreciation +10.0/10.0
- DSCR +6.9/10.0
- 1% rule +5.6/10.0
- Schools +3.6/10.0
- Livability +3.5/5.0
- Rent growth +2.5/5.0
- Condition / age +2.5/5.0
$133,900
🖨 Deal sheet (PDF) 📄 Offer letter ✓ Due diligence
Listing remarks
Welcome to 626 N Holman in Brookland! This 3-bedroom, 2-bath home sits on a large 0.75-acre lot and offers 1,272 sq. ft. of living space. You'll love the LVP flooring and the easy layout that's perfect for everyday living. Located just minutes from Brookland schools and Jonesboro/Paragould, it's the best of both worlds small-town living with quick access to the city.
Key facts
- Large lot
- Quick access
- Lvp flooring
Tags
Property features AI
Finance
- Financial info: Financing available: Conventional loan or cash
Exterior
- Utilities: Public water; Public sewer
- Home design: Single-family property; Metal/vinyl siding; Architectural shingle roof
- Construction: Crawl space foundation
- Exterior features: Deck; Paved road access; Level lot; Inside city limits
Interior
- Kitchen: Electric range; Dishwasher
- Flooring: Luxury vinyl flooring
- Bathrooms: 2 full bathrooms
- Heating & cooling: Central electric heating; Central electric cooling
- Interior features: Electric water heater; Ceiling fans
Neighborhood map
What this means for you Summary
Snapshot
- This is a 3-bed/1.0-bath single-family listed at $134k.
Deal economics
- At list price, monthly cash flow is $200 ($2k/yr) — positive.
- The deal already cash-flows at list — no discount required.
- Meets the 1% rule at list price ($1k rent vs $134k).
- Cap rate 8.1% vs local median 4.2% in Brookland — top-decile yield for the area; either an underpriced asset or a hidden risk that comps aren't pricing in. Stress-test before assuming the spread holds.
Location & tenants
- Location reads 70/100 on livability (#57 in AR) — a middle-class / working-renter tenant base. Strengths: cost of living A+, housing A+, health & safety A; Watch: crime D, amenities F, commute F.
- Brookland School District (suburban): math 45% / reading 39% proficiency, ranked #47 of 238 in AR (top 20%) — families likely to look elsewhere, expect single-tenant / working-renter base with shorter leases.
- Zoned schools: Brookland Middle School (math 56% / reading 35%, grade D-, #135 of 454 statewide, top 30%, 878 students, 31% FRL); Brookland High School (math 22% / reading 37%, grade F, #142 of 292 statewide, top 53%, 589 students, 27% FRL) — zoned schools at 29% FRL track the district average.
- Market conditions: 118 active listings in the ZIP; 5 comparable units currently listed for rent nearby; rentals lingering (median 45d on market — plan ~5-8 weeks vacancy on turnover, expect pricing pressure); 100% of comp listings sitting > 30 days — soft ceiling on asking rent; 926 units permitted in Craighead County in 2024 (69 in 5+ unit buildings).
Forward outlook
- In year one you build about $14k of equity ($926 loan paydown + $13k appreciation (10.0% local appreciation)).
- Craighead County population projected at +38% by 2050 — long-run rental-demand tailwind backs the buy-and-hold thesis.
- At projected returns (10.0% appreciation + 3.0% rent growth), your $37k cash investment doubles in ~3 years — after that, you're playing with house money.
- By year 3, paydown + projected appreciation supports a ~$36k cash-out refi (75% LTV) — recoverable capital for the next deal without selling this one.
Negotiation context
- Only 11 days on market — expect competitive offers; lowballing is unlikely to land.
- 6 sale attempts with the ask held roughly flat each time — persistent listings suggest the price (not the market) is what's stuck; bring a comps-based counter.
- Current owner paid $28k; list at $134k implies a 378% gain — meaningful room to come down on a strong offer.
Risks & watch-outs
- Climate carrying-cost: major flood risk; extreme-heat days projected 7→21/yr by 2055 (HVAC capex compounding) — expect insurance premiums to compound above CPI over the hold.
Questions for the listing agent
- Is there a deadline driving the sale (1031 exchange, divorce, estate, relocation)? That informs how much negotiation room exists.
- Crime grade is D in this area — have there been break-ins, vandalism, or insurance claims at this property in the last 3 years? What carrier currently insures it and at what premium?
- What's the average days-on-market for RENTAL listings here right now (not sales)? A rising rental-DOM trend means longer vacancies and softer asking-rent achievability than the comps imply.
- What's the recent tenant-quality profile in this submarket — average credit score on applications, eviction rate, late-payment / NSF rate, and stable-employment percentage? A property-management company in the area should have these aggregated.
- How much new for-sale + rental construction is in the pipeline within 1–3 miles? Heavy new supply typically softens prices + rents 12–24 months out; constrained supply supports both.
Investment metrics
- 1% rule
- 1.06% ✓
- Cap rate
- 8.09%
- Cash-on-cash
- 6.41%
- DSCR
- 1.29
- GRM
- 7.8
CMA / ARV
- ARV (on-the-fly)
- $189,528
- Comps found
- 12
Show comp detail 12 sales within ~0.75 mi
| Address | Dist | Beds/Ba | Sqft | Sold | Price | $/sf | Match |
|---|---|---|---|---|---|---|---|
| 626 N Holman St | 0.00mi | 3/2.0 | 1,272 (0%) | 1mo | $133,900 | $105 | 95 |
| 114 Oak Meadow Cir | 0.20mi | 3/1.5 | 1,248 (-2%) | 3mo | $164,500 | $132 | 83 |
| 305 W School St | 0.38mi | 3/2.0 | 1,294 (+2%) | 1mo | $185,000 | $143 | 75 |
| 125 Logan | 0.42mi | 3/2.0 | 1,200 (-6%) | 2mo | $182,000 | $152 | 66 |
| 587 E Matthews St | 0.44mi | 4/2.0 (+1) | 1,320 (+4%) | 1mo | $188,000 | $142 | 63 |
| 322 W School | 0.49mi | 3/2.0 | 1,209 (-5%) | 5mo | $179,900 | $149 | 61 |
| 400 Harper Dr | 0.71mi | 3/2.0 | 1,284 (+1%) | 2mo | $199,300 | $155 | 60 |
| 126 Ellis Dr | 0.41mi | 3/2.0 | 1,386 (+9%) | 2mo | $218,850 | $158 | 60 |
| 101 Ellis Dr | 0.41mi | 3/2.0 | 1,436 (+13%) | 2mo | $220,000 | $153 | 53 |
| 233 N Oak St N | 0.71mi | 3/2.0 | 1,385 (+9%) | 1mo | $198,000 | $143 | 47 |
| 104 Weston Cv | 0.68mi | 3/2.0 | 1,380 (+8%) | 4mo | $198,500 | $144 | 46 |
| 227 Cole Dr | 0.62mi | 3/2.0 | 1,128 (-11%) | 2mo | $190,000 | $168 | 46 |
Match score weights: distance 35% · size 25% · config 20% · recency 20%. Top-matched comps best support the ARV.
Projected returns pro-forma
10.0% appreciation · 3.0% rent growth · sell at horizon
- IRR
- 28.9%
- Equity multiple
- 3.29×
- Total profit
- $85,702
- Equity at exit
- $120,628
- IRR
- 25.2%
- Equity multiple
- 7.47×
- Total profit
- $242,390
- Equity at exit
- $260,138
Cash invested: $37,492 (down + closing). Projections, not guarantees.
Landlord ↔ Tenant lean methodology
- Overall (STATE)
- 92 Strongly Landlord-Friendly
- State Arkansas
- 92 Strongly Landlord-Friendly · R+14
- County
- — inherits STATE
- City
- — inherits STATE
ZIP-level market 72417
- Home prices YoY
- 20.6%
- Active inventory
- 118
- Price-to-rent
- 7.8×
Monthly cashflow live
- Estimated rent
- $1,425 high interval (Pro) →
- Mortgage (P&I)
- −$702
- Tax est. 1.5%
- −$167 /mo · $2,008/yr
- Insurance
- −$56
- HOA
- −$0
- Vacancy / Maint / Mgmt
- −$299
- Net cashflow
- $200
Break-even live
Sensitivity live
| Price | -10% $293 | -5% $247 | +0% $200 | +5% $154 | +10% $108 |
|---|---|---|---|---|---|
| Rent | -10% $88 | -5% $144 | +0% $200 | +5% $257 | +10% $313 |
| Rate | -1.0pp $268 | -0.5pp $234 | base $200 | +0.5pp $166 | +1.0pp $130 |
UW: 25.0% down · 7.5% · 30yr · 1.5% tax · 5.0% vac · 8.0% maint · 8.0% mgmt
Financing live
Cash to close
- Down payment
- $33,475
- Closing costs
- $4,017
- Reserves months
- —
- Total cash needed
- —
Loan-product check · same deal, 3 products live
Conventional
25% down · 7.5% · 30yr
- Down + closing
- —
- Monthly P&I
- —
- Monthly cashflow
- —
- DSCR
- —
- Eligible?
- —
Personal DTI + credit; lowest rate.
DSCR
20% down · 8.5% · 30yr
- Down + closing
- —
- Monthly P&I
- —
- Monthly cashflow
- —
- DSCR
- —
- Eligible?
- —
No personal income docs; deal must DSCR.
Hard money
10% down · 12.0% · 12mo
- Down + closing
- —
- Monthly P&I
- —
- Monthly cashflow
- —
- DSCR
- —
- Eligible?
- —
Short-term bridge; refi at stabilization.
Rent comps 5 comps
| Address | Beds | Baths | Sqft | Rent | $/sqft | DOM | Units | Dist |
|---|---|---|---|---|---|---|---|---|
| 315 Story St Brookland, AR | 3.0 | 2.0 | 1250 | $1,270 | $1.02 | 45d | 1 | 0.15mi |
| 300 Story St Brookland, AR | 3.0 | 2.0 | 1200 | $1,270 | $1.06 | 45d | 1 | 0.17mi |
| 338 Story St Brookland, AR | 3.0 | 2.0 | 1250 | $1,270 | $1.02 | 45d | 1 | 0.17mi |
| 105 Cherry St Brookland, AR | 3.0 | 2.0 | 1170 | $1,575 | $1.35 | 45d | 1 | 0.32mi |
| 203 N Bernis St Brookland, AR | 3.0 | 2.0 | 1328 | $1,550 | $1.17 | 45d | 1 | 0.36mi |
Listing history 14 events
-
2026-04-28status Under Contract
-
2026-04-14$133,900 New Listing
-
2026-04-14historical
-
2026-04-03price $133,900
-
2026-02-12status Active
-
2026-02-11historical
-
2026-01-14$134,900 New Listing
-
2026-01-14$134,900 Active
-
2026-01-14historical
-
2025-12-30price $134,900
-
2025-12-29price $134,900
-
2025-10-17$139,900 Active
-
2025-10-17$139,900 New Listing
-
2000-06-09soldstatus $28,000
ⓘ Source: listings_history table (triggers on properties + properties_extension) + one-shot
backfill from property_details.listing_events for pre-trigger history.
Climate risk First Street
- Flood 6/10 Major FEMA zone X · 71% chance over 30 yrs
- Wildfire 4/10 Moderate
- Heat 5/10 Major 7 d/yr ≥110°F today · 21 d/yr by 30 yrs out
- Wind 4/10 Moderate 8% chance of damaging wind over 30 yrs
- Air quality 1/10 Low 0 unhealthy d/yr today · 0 by 30 yrs out
Nearby sold comps map
Loading sold comps map…
Walkable amenities ~0.75 mi
Loading nearby amenities…
Taxation est. · year 1
- Rental income
- $17,098
- − Mortgage interest
- −$7,500
- − Property taxes
- −$2,008
- − Insurance
- −$670
- − Repairs & maintenance
- −$1,368
- − Management
- −$1,368
- − Depreciation
- −$3,895
- Taxable income
- $289
- Est. tax owed @ 24.0%
- −$69
- After-tax cash flow
- $2,334/yr
For passive investors: Depreciation is non-cash, so a rental often shows a tax loss while cash-flowing — sheltering income. Rental losses are passive: they offset passive income freely, and up to $25,000/yr can offset ordinary (W-2) income if you actively participate and your MAGI is under $100k (phasing out to $0 by $150k); unused losses carry forward. On sale, claimed depreciation is recaptured at up to 25%, and gains may owe capital-gains tax (a 1031 exchange can defer both). Figures are a year-1 estimate at your 24.0% rate — not tax advice; consult a CPA.
Schools (NCES district)
- District
- Brookland School District
- NCES district ID
- 0503640
- Math proficiency
- 45% ▼ -15.00%
- Reading proficiency
- 39% ▼ -16.00%
- Median HH income
- $52,226
- Composite
- 36.4/100
- National rank
- #4678
- State rank
- #47 of 238 in AR
Livability — Brookland
- Score
- 70/100
- State rank
- #57
- US rank
- #7817
Category grades
Schools grade is shown separately in the Schools card above.
Census & demographics
- Census place
- Brookland, AR
- County
- Craighead County · 97,185 people
- City population
- 5,940
- Metro
- Jonesboro, AR
- Population (ZIP)
- 5,940
- Household income
- $61,964
- Rent vs Own
- Severe rent burden
- 152.0
Population outlook (Craighead County) Hauer SSP2
- Today (2025)
- 122,235 people
- By 2030
- 131,338 · +7.4%
- By 2040
- 149,862 · +22.6%
- By 2050
- 168,034 · +37.5%
- By 2075
- 208,094 · +70.2%
- By 2100
- 233,251 · +90.8%
Race, ethnicity, and origin ACS 2023
- Neighborhood character
- Predominantly White (91%)
- Race & ethnicity
- White 91% Two or more races 5% Black 2% Hispanic / Latino 2%
- Common ancestry
- Slovak 3% Italian 3%
- Foreign-born
- 1% · Canada, South Korea
Political lean MEDSL · Craighead
- 2024 margin
- Solid R (+37.4) · D 30.1% · R 67.5% · Other 2.4%
- 2008→2024 swing
- -12.9pp toward R · 2008: -24.5pp · 2024: -37.4pp
- All cycles
- 2024: R+37.4 2020: R+35.4 2016: R+35.2 2012: R+31.1 2008: R+24.5
Not yet ingested
- Civics
- —
Market trends
- HPI YoY
- ▲ 56.75%
- Current HPI
- 331.5025
- Rent YoY
- —
- Metro
- Jonesboro, AR
- State GDP YoY
- ▲ 3.80%
- F500 in state
- 10
Industry mix (Fortune 500 HQ in AR)
| Industry | F500 HQs | Revenue |
|---|---|---|
| Retail | 1 | $681B |
|
||
| Food / Agriculture | 1 | $53B |
|
||
| Retail / Energy | 1 | $22B |
|
||
| Transportation / Logistics | 1 | $12B |
|
||
| Energy | 1 | $4B |
|
||
Price history
+378.2% since first listed14 events — show timeline
- 2026-04-28 Pending — CARMLS
- 2026-04-14 Listed $133,900 CARMLS
- 2026-04-14 Listing Removed — CARMLS
- 2026-04-03 Price Changed $133,900 CARMLS
- 2026-02-12 Relisted — NEABOR MLS
- 2026-02-11 Delisted — NEABOR MLS
- 2026-01-14 Listed $134,900 NEABOR MLS
- 2026-01-14 Listed $134,900 CARMLS
- 2026-01-14 Listing Removed — CARMLS
- 2025-12-30 Price Changed $134,900 CARMLS
- 2025-12-29 Price Changed $134,900 NEABOR MLS
- 2025-10-17 Listed $139,900 CARMLS
- 2025-10-17 Listed $139,900 NEABOR MLS
- 2000-06-09 Sold (Public Records) $28,000 Public Records
Property tax history
-5.6%/yrLatest (2024): $58 · -46.7% YoY. Source: county tax records.
Cash-flow waterfall
monthlySold comps — $/sqft
last 12 mo · ≤1 miLoading sold comps…