 🏗️ New Construction
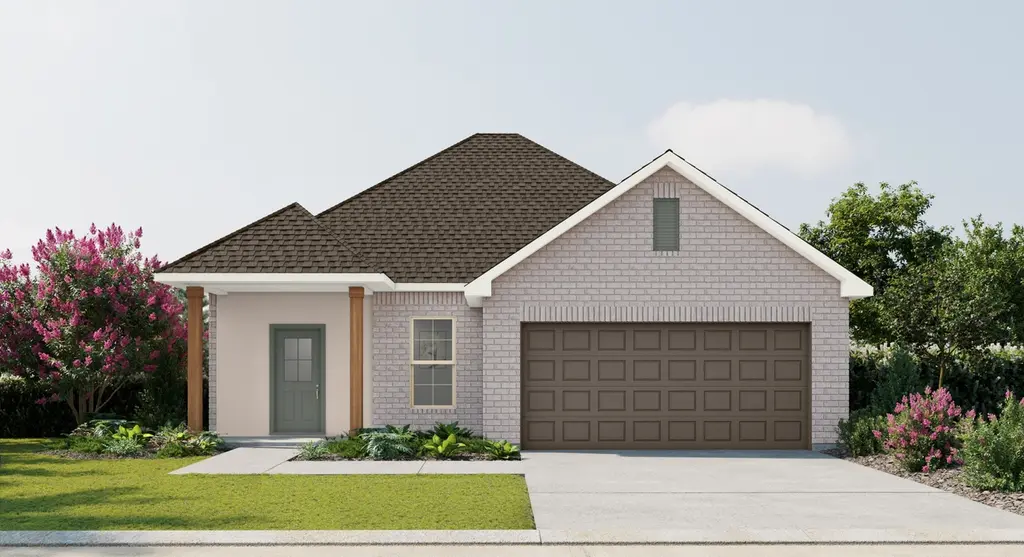
Bolton II A Plan · Haughton, LA
Flood risk No data
- FEMA flood zone
- —
- Chance of flooding over 30 yrs
- —
- Est. flood insurance / yr
- —
Fire risk No data
- Est. fire insurance / yr
- —
Heat risk No data
- Hot days now (above threshold)
- —
- Hot days in 30 yrs
- —
Wind risk No data
- Chance of severe wind over 30 yrs
- —
Air-quality risk No data
- Unhealthy air days now
- —
- Unhealthy air days in 30 yrs
- —
Risk factors via First Street. Map © Google.
Why this score? — see what drove the D- grade
The composite is a weighted blend of 9 inputs, each scored 0–100. Each bar is that input's sub-score; the figure is the points it added to the 100-point composite (weight × sub-score).
- Cash flow +9.2/30.0
- ARV discount +7.5/15.0
- Condition / age +4.0/5.0
- Schools +3.8/10.0
- Livability +3.4/5.0
- 1% rule +2.8/10.0
- DSCR +2.6/10.0
- Rent growth +2.5/5.0
- Appreciation +0.0/10.0
$247,990
🖨 Deal sheet 📄 Offer letter ✓ Due diligence
Listing remarks MLS
Welcome to the Bolton II A floor plan by DSLD Homes, a smartly designed 1,501 sq. ft. home featuring 4 bedrooms, 2 full bathrooms, and a two-car garage. The exterior blends classic charm with durability, showcasing brick, stucco, and siding finishes, plus a covered rear porch perfect for outdoor relaxation. Inside, enjoy a bright, functional layout with recessed can lighting in the kitchen. The master suite offers a garden tub, separate shower, and a walk-in closet, delivering both comfort and convenience. Ideal for growing families or anyone needing extra space, this energy-efficient home combines value, style, and everyday functionality.
Key facts
- Walk-in closet
- Separate shower
- Covered rear porch
Tags
Neighborhood map
What this means for you Summary
Snapshot
- This is a 4-bed/2.0-bath single-family listed at $248k. Condition is rated good.
Deal economics
- At list price, monthly cash flow is $-198 ($-2k/yr) — negative.
- To cash-flow at today's rent, offer at most $238k (4.0% below list).
- To meet the 1% rule (rent ≥ 1% of price), the offer needs to be $208k (16.0% below list).
- Recommended offer: $208k (16.0% below list) — sets the bar for 1% rule.
Location & tenants
- Location reads 67/100 on livability (#105 in LA) — a middle-class / working-renter tenant base. Strengths: crime A+, cost of living A+, housing A+; Watch: employment C-, amenities F, commute F.
- Bossier Parish (urban): math 40% / reading 47% proficiency, ranked #17 of 98 in LA (top 17%) — families likely to look elsewhere, expect single-tenant / working-renter base with shorter leases.
- Market conditions: 333 active listings in the ZIP; 1 comparable units currently listed for rent nearby; solid renter incomes; 716 units permitted in Bossier Parish in 2024 (0 in 5+ unit buildings).
- This rent runs 32% of the median local income ($79k/yr) — at the standard rent-burdened threshold; future hikes will face affordability resistance.
Forward outlook
- Local home prices are declining (-3.0%/yr); year-one equity from $2k of loan paydown is wiped out by about $8k of value loss. Plan a longer hold.
- Bossier County population projected at +28% by 2050 — long-run rental-demand tailwind backs the buy-and-hold thesis.
Negotiation context
- It's been on market 269 days — a 12% lower offer ($218k) is reasonable based on typical stale-listing flexibility.
Questions for the listing agent
- What do current leases actually rent for vs. the listed asking? Can we see a recent rent roll and the last 12 months of T-12 income?
- It's been on market 269 days. Have you received any prior offers? Is the seller open to a 16% concession, seller financing, or rate buy-down credit?
- Why hasn't it sold? Are there any deal-killer items the seller is aware of (foundation, flood, title, zoning, code violations)?
- Is there a deadline driving the sale (1031 exchange, divorce, estate, relocation)? That informs how much negotiation room exists.
- Schools are B-rated — typically a magnet for longer-tenancy family renters. What's the average tenant stay here, and is there a school-zone premium baked into asking?
- The area grade is low — what's the realistic commute time and amenity access for the typical tenant pool here? Any planned neighborhood developments (good or bad) we should know about?
- What's the average days-on-market for RENTAL listings here right now (not sales)? A rising rental-DOM trend means longer vacancies and softer asking-rent achievability than the comps imply.
- What's the recent tenant-quality profile in this submarket — average credit score on applications, eviction rate, late-payment / NSF rate, and stable-employment percentage? A property-management company in the area should have these aggregated.
- How much new for-sale + rental construction is in the pipeline within 1–3 miles? Heavy new supply typically softens prices + rents 12–24 months out; constrained supply supports both.
Investment metrics
- 1% rule
- 0.78% ✗
- Cap rate
- 5.40%
- Cash-on-cash
- -3.18%
- DSCR
- 0.86
- GRM
- 10.7
CMA / ARV
- ARV (median comp)
- $266,796
- List price
- $247,990
- Delta
- -7.05%
- Verdict
- FAIR
- Comps
- 20 within 1.0 mi
Show comp detail 12 sales within ~0.75 mi
| Address | Dist | Beds/Ba | Sqft | Sold | Price | $/sf | Match |
|---|---|---|---|---|---|---|---|
| 186 Berkshire Pl | 0.03mi | 4/2.0 | 1,501 (0%) | 0mo | $251,439 | $168 | 98 |
| 185 Berkshire Pl | 0.01mi | 3/2.0 (-1) | 1,522 (+1%) | 1mo | $251,683 | $165 | 92 |
| 194 Berkshire Pl | 0.03mi | 4/2.0 | 1,568 (+4%) | 1mo | $259,265 | $165 | 90 |
| 247 Berkshire Pl | 0.07mi | 3/2.0 (-1) | 1,538 (+2%) | 4mo | $255,000 | $166 | 84 |
| 219 Berkshire Pl | 0.12mi | 3/2.0 (-1) | 1,538 (+2%) | 2mo | $246,900 | $161 | 84 |
| 607 Girard Ct | 0.15mi | 3/2.0 (-1) | 1,538 (+2%) | 1mo | $261,668 | $170 | 83 |
| 303 Babineaux Ln | 0.14mi | 3/2.0 (-1) | 1,451 (-3%) | 2mo | $245,790 | $169 | 82 |
| 188 Berkshire Pl | 0.03mi | 4/2.0 | 1,691 (+13%) | 3mo | $265,744 | $157 | 75 |
| 422 Zinfandel Pl | 0.19mi | 3/2.0 (-1) | 1,423 (-5%) | 7mo | $233,370 | $164 | 72 |
| 428 Shady Wood Ln | 0.47mi | 3/2.0 (-1) | 1,475 (-2%) | 1mo | $219,900 | $149 | 70 |
| 141 W Mckinley Ave | 0.49mi | 3/2.0 (-1) | 1,453 (-3%) | 1mo | $219,000 | $151 | 66 |
| 223 W Mckinley Ave | 0.46mi | 3/2.0 (-1) | 1,560 (+4%) | 6mo | $179,000 | $115 | 62 |
Match score weights: distance 35% · size 25% · config 20% · recency 20%. Top-matched comps best support the ARV.
Projected returns pro-forma
-3.0% appreciation · 3.0% rent growth · sell at horizon
- IRR
- -21.6%
- Equity multiple
- 0.25×
- Total profit
- $-55,814
- Equity at exit
- $39,780
- IRR
- -15.3%
- Equity multiple
- 0.13×
- Total profit
- $-64,716
- Equity at exit
- $23,068
Cash invested: $74,703 (down + closing). Projections, not guarantees.
Landlord ↔ Tenant lean methodology
- Overall (STATE)
- 90 Strongly Landlord-Friendly
- State Louisiana
- 90 Strongly Landlord-Friendly · R+12
- County
- — inherits STATE
- City
- — inherits STATE
ZIP-level market 71037
- Home prices YoY
- -27.8%
- Active inventory
- 333
- Price-to-rent
- 9.9×
Monthly cashflow live
- Estimated rent
- $2,083 medium interval (Pro) →
- Mortgage (P&I)
- −$1,399
- Tax est. 1.5%
- −$333 /mo · $4,002/yr
- Insurance
- −$111
- HOA
- −$0
- Vacancy / Maint / Mgmt
- −$437
- Net cashflow
- $-198
Break-even live
UW: 25.0% down · 7.5% · 30yr · 1.5% tax · 5.0% vac · 8.0% maint · 8.0% mgmt
Financing live
Cash to close
- Down payment
- $66,699
- Closing costs
- $8,004
- Reserves months
- —
- Total cash needed
- —
Loan-product check · same deal, 3 products live
Conventional
25% down · 7.5% · 30yr
- Down + closing
- —
- Monthly P&I
- —
- Monthly cashflow
- —
- DSCR
- —
- Eligible?
- —
Personal DTI + credit; lowest rate.
DSCR
20% down · 8.5% · 30yr
- Down + closing
- —
- Monthly P&I
- —
- Monthly cashflow
- —
- DSCR
- —
- Eligible?
- —
No personal income docs; deal must DSCR.
Hard money
10% down · 12.0% · 12mo
- Down + closing
- —
- Monthly P&I
- —
- Monthly cashflow
- —
- DSCR
- —
- Eligible?
- —
Short-term bridge; refi at stabilization.
Rent comps 1 comps
| Address | Beds | Baths | Sqft | Rent | $/sqft | DOM | Units | Dist |
|---|---|---|---|---|---|---|---|---|
| 190 Berkshire Pl Haughton, LA | 3.0 | 2.0 | 1867 | $2,200 | $1.18 | 13d | 1 | 0.04mi |
Listing history 15 events
-
2026-06-18days on market $247,990 Active 269 DOM
-
2026-06-17days on market $247,990 Active 268 DOM
-
2026-06-16days on market $247,990 Active 267 DOM
-
2026-06-15days on market $247,990 Active 266 DOM
-
2026-06-14days on market $247,990 Active 264 DOM
-
2026-06-13days on market $247,990 Active 263 DOM
-
2026-06-10days on market $247,990 Active 261 DOM
-
2026-06-09days on market $247,990 Active 260 DOM
-
2026-06-08days on market $247,990 Active 259 DOM
-
2026-06-07days on market $247,990 Active 258 DOM
-
2026-06-02days on market $247,990 Active 253 DOM
-
2026-06-01days on market $247,990 Active 252 DOM
-
2026-05-31days on market $247,990 Active 251 DOM
-
2026-05-30days on market $247,990 Active 250 DOM
-
2025-09-23$247,990 Active 647-char remark
Show marketing remark (647 chars)
Welcome to the Bolton II A floor plan by DSLD Homes, a smartly designed 1,501 sq. ft. home featuring 4 bedrooms, 2 full bathrooms, and a two-car garage. The exterior blends classic charm with durability, showcasing brick, stucco, and siding finishes, plus a covered rear porch perfect for outdoor relaxation. Inside, enjoy a bright, functional layout with recessed can lighting in the kitchen. The master suite offers a garden tub, separate shower, and a walk-in closet, delivering both comfort and convenience. Ideal for growing families or anyone needing extra space, this energy-efficient home combines value, style, and everyday functionality.
ⓘ Source: listings_history table (triggers on properties + properties_extension) + one-shot
backfill from property_details.listing_events for pre-trigger history.
Nearby sold comps map
Loading sold comps map…
Walkable amenities ~0.75 mi
Loading nearby amenities…
Taxation est. · year 1
- Rental income
- $24,998
- − Mortgage interest
- −$14,945
- − Property taxes
- −$4,002
- − Insurance
- −$1,334
- − Repairs & maintenance
- −$2,000
- − Management
- −$2,000
- − Depreciation
- −$7,761
- Taxable loss
- −$7,043
- Est. tax savings @ 24.0%
- +$1,690
- After-tax cash flow
- $-686/yr
For passive investors: Depreciation is non-cash, so a rental often shows a tax loss while cash-flowing — sheltering income. Rental losses are passive: they offset passive income freely, and up to $25,000/yr can offset ordinary (W-2) income if you actively participate and your MAGI is under $100k (phasing out to $0 by $150k); unused losses carry forward. On sale, claimed depreciation is recaptured at up to 25%, and gains may owe capital-gains tax (a 1031 exchange can defer both). Figures are a year-1 estimate at your 24.0% rate — not tax advice; consult a CPA.
Condition & rehab AI · 1 photo
This Bolton II A floor plan by DSLD Homes is in good condition with a good condition score of 80. It is move-in ready with minimal cosmetic updates needed to enhance its resale and rental value.
Value-add opportunities
- Both Painting exterior and interior walls — Enhances curb appeal and interior aesthetics.
- Both Landscaping improvements — Enhances curb appeal and adds value.
- Both New flooring in bathrooms and kitchen — Improves functionality and aesthetics, attracting more buyers/renters.
- Both Upgrading lighting fixtures — Enhances interior ambiance and can increase home value.
- Both Reorganizing and updating kitchen appliances — Modernizes the kitchen and can attract more buyers/renters.
- Both Upgrading HVAC system — Ensures comfort and energy efficiency, attracting more buyers/renters.
- Both Adding smart home features — Enhances home automation and can increase home value and appeal to tech-savvy buyers/renters.
Renovation cost estimate screening
Value-add ROI direction
- Both Painting exterior and interior walls — Enhances curb appeal and interior aesthetics. ↑
- Both Landscaping improvements — Enhances curb appeal and adds value. ↑
- Both New flooring in bathrooms and kitchen — Improves functionality and aesthetics, attracting more buyers/renters. ↑
- Both Upgrading lighting fixtures — Enhances interior ambiance and can increase home value. ↑
- Both Reorganizing and updating kitchen appliances — Modernizes the kitchen and can attract more buyers/renters. ↑
- Both Upgrading HVAC system — Ensures comfort and energy efficiency, attracting more buyers/renters. ↑
- Both Adding smart home features — Enhances home automation and can increase home value and appeal to tech-savvy buyers/renters. ↑
ⓘ Cost ranges are severity-bucket heuristics (US national rule-of-thumb). Get contractor quotes + a written scope before underwriting a rehab budget.
Schools (NCES district)
- District
- Bossier Parish
- NCES district ID
- 2200270
- Math proficiency
- 40% ▼ -32.00%
- Reading proficiency
- 47% ▼ -28.00%
- Median HH income
- $51,326
- Composite
- 37.5/100
- National rank
- #4402
- State rank
- #17 of 98 in LA
Livability — Haughton
- Score
- 67/100
- State rank
- #105
- US rank
- #10251
Category grades
Schools grade is shown separately in the Schools card above.
Census & demographics
- Census place
- Haughton, LA
- County
- Bossier Parish · 98,704 people
- City population
- 21,192
- Metro
- Shreveport-Bossier City, LA
- Population (ZIP)
- 21,192
- Household income
- $78,571
- Rent vs Own
- Severe rent burden
- 171.0
Population outlook (Bossier County) Hauer SSP2
- Today (2025)
- 143,247 people
- By 2030
- 151,802 · +6.0%
- By 2040
- 168,194 · +17.4%
- By 2050
- 183,533 · +28.1%
- By 2075
- 217,009 · +51.5%
- By 2100
- 230,091 · +60.6%
Race, ethnicity, and origin ACS 2023
- Neighborhood character
- Predominantly White (76%)
- Race & ethnicity
- White 76% Black 15% Hispanic / Latino 6% Two or more races 3%
- Hispanic origin (detail)
- Mexican 4%
- Common ancestry
- Lithuanian 2% Italian 1% Slovak 1%
- Foreign-born
- 3% · Canada
- Languages at home
- 95% English-only · Spanish 4%
Political lean MEDSL · Bossier
- 2024 margin
- Solid R (+43.3) · D 27.7% · R 71.0% · Other 1.3%
- 2008→2024 swing
- +0.3pp no change · 2008: -43.7pp · 2024: -43.3pp
- All cycles
- 2024: R+43.3 2020: R+41.0 2016: R+45.8 2012: R+45.4 2008: R+43.7
Not yet ingested
- Civics
- —
Market trends
- HPI YoY
- ▼ -59.53%
- Current HPI
- 154.5064
- Rent YoY
- —
- Metro
- Shreveport-Bossier City, LA
- State GDP YoY
- ▲ 3.29%
- F500 in state
- 10
Industry mix (Fortune 500 HQ in LA)
| Industry | F500 HQs | Revenue |
|---|---|---|
| Telecommunications | 2 | $23B |
|
||
| Utilities | 1 | $12B |
|
||
| Wholesale / Distribution | 1 | $5B |
|
||
| Advertising | 1 | $2B |
|
||
Price history
1 event — show timeline
- 2025-09-23 Listed $247,990 Zillow
Cash-flow waterfall
monthlySold comps — $/sqft
last 12 mo · ≤1 miLoading sold comps…