 Multi-family
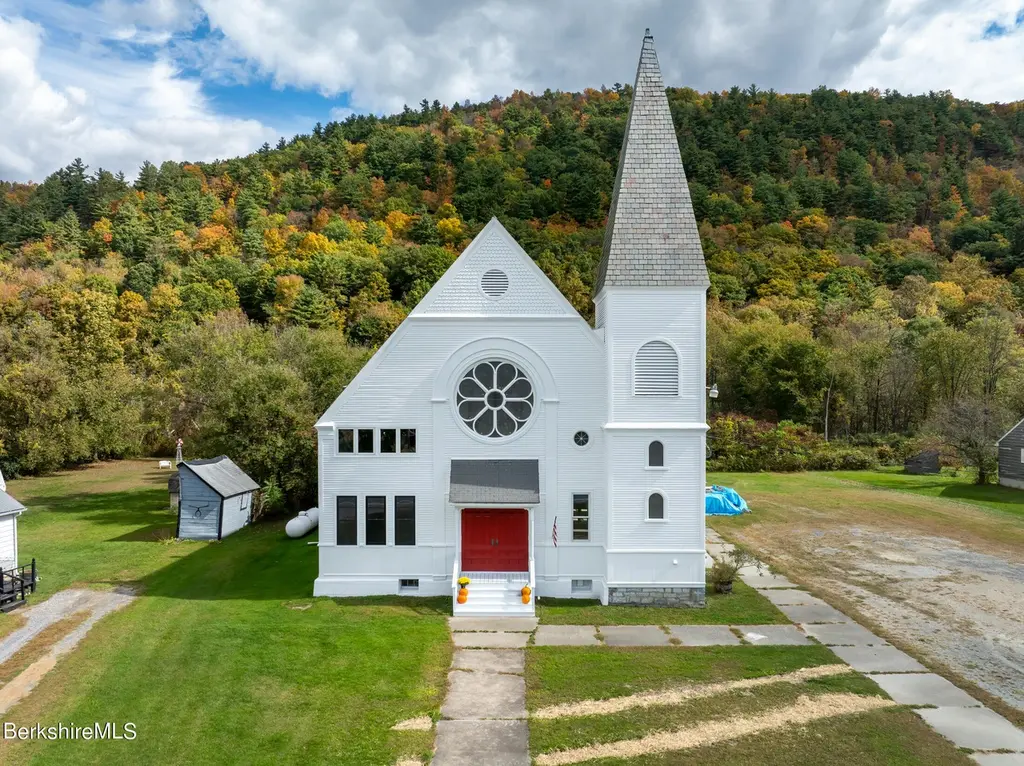
3310 VT Route 346 · North Pownal, VT
Flood risk 4/10 · Minor
- FEMA flood zone
- X (unshaded)
- Chance of flooding over 30 yrs
- 0.22%
- Est. flood insurance / yr
- $473 – $860
Fire risk 3/10 · Minor
- Est. fire insurance / yr
- $480 – $892
Heat risk 3/10 · Minor
- Hot days now (above 92°F)
- 8 days/yr
- Hot days in 30 yrs
- 19 days/yr
Wind risk 3/10 · Minor
- Chance of severe wind over 30 yrs
- 6.0%
Air-quality risk 2/10 · Minimal
- Unhealthy air days now
- 1 days/yr
- Unhealthy air days in 30 yrs
- 1 days/yr
Risk factors via First Street. Map © Google.
Why this score? — see what drove the F grade
The composite is a weighted blend of 9 inputs, each scored 0–100. Each bar is that input's sub-score; the figure is the points it added to the 100-point composite (weight × sub-score).
- ARV discount +7.5/15.0
- Appreciation +6.2/10.0
- Schools +5.0/10.0
- Condition / age +3.8/5.0
- Rent growth +2.5/5.0
- Livability +2.5/5.0
- Cash flow +0.6/30.0
- 1% rule +0.0/10.0
- DSCR +0.0/10.0
$429,000
🖨 Deal sheet 📄 Offer letter ✓ Due diligence
Multi-family units
County records classify this as Multi-Family (5+ Unit). Listing-text estimate: 1 unit. estimate disagrees with records
5+ unit building — per-unit beds/baths from public records are typically unavailable; the breakdown below (if shown) is an estimate from the listing text.
Listing remarks MLS
What might be your dream or requirements? This 1889 Church located in the quiet country village of North Pownal, Vermont, could fill them, however big or small. A single family home for all seasons and celebrations? A wedding venue? A place to live and work, rolled into one with plenty of space no matter what you do, from sculpting to computer imaging? This amazing building has so many possibilities. With the exterior restoration just completed and some very attractive new interior spaces for living including the fully equipped kitchen, delightful bedroom, walk-in closet, and three quarter bath, and second floor bedroom suite, one can move right in while you imagine how you might like to change the other very large spaces on both floors to suit your plans and vision. The setting is pastoral with lovely mountain views in every direction. The area across the main road is a Christmas tree farm and the mountain behind is owned by the Nature Conservancy. Attractions in nearby Williamstown, MA or Bennington VT, are just 15 minutes away and Albany/Troy a mere 50 minutes. Easy access to all that Vermont and the Berkshires have to offer from skiing, to boating, hiking, fishing, hunting, dining, and so much more. Following the sale of the church by the Diocese in 2017, the building has benefitted from a progression of three owners each of whom have made their own contributions towards the preservation of this remarkable building. Now it’s your turn to take this to the next level.
Key facts
- 0.86 acre lot
- Built 1890
- Listed 9 days
Property features AI
Exterior
- Parking: Off-street parking
- Utilities: 200 Amp electric service with circuit breakers; Private sewer and public sewer available
- Home design: Certified historic; Updated/remodeled
- Construction: Slate roof; Building area approximately 7000
- Exterior features: Private trash service; Porch; Deck; School bus access
Interior
- Kitchen: Refrigerator; Water treatment (owned)
- Bedrooms: Accessible bedroom
- Flooring: Wood
- Bathrooms: 2 full bathrooms
- Heating & cooling: Propane heating; Wood heating; Electric heating; Radiant heat
- Interior features: Cathedral ceilings; Radiant heat; Walk-in closet(s); Accessible bedroom
- Laundry & utility: Washer; Dryer
Neighborhood map
What this means for you Summary
Snapshot
- This is a 1-bed/1.0-bath multifamily listed at $429k. Condition is rated good.
Deal economics
- At list price, monthly cash flow is $-2k ($-22k/yr) — negative.
- To cash-flow at today's rent, offer at most $102k (76.2% below list).
- To meet the 1% rule (rent ≥ 1% of price), the offer needs to be $111k (74.2% below list).
- Recommended offer: $102k (76.2% below list) — sets the bar for cash-flow.
Location & tenants
- Location reads: area grade F — affects rentability + tenant quality, not the cash-flow math above.
- Market conditions: 23 active listings in the ZIP; 59 units permitted in Bennington County in 2024 (0 in 5+ unit buildings).
Forward outlook
- In year one you build about $13k of equity ($3k loan paydown + $10k appreciation (2.3% local appreciation)).
- Bennington County population projected at -23% by 2050 — secular population decline; favor cash flow + early exit over multi-decade hold.
- By year 3, paydown + projected appreciation supports a ~$33k cash-out refi (75% LTV) — recoverable capital for the next deal without selling this one.
Negotiation context
- Only 10 days on market — expect competitive offers; lowballing is unlikely to land.
- 3 sale attempts since 2y ago with the ask held roughly flat each time — persistent listings suggest the price (not the market) is what's stuck; bring a comps-based counter.
Risks & watch-outs
- Watch-outs: built in 1890 — expect roof / HVAC / electrical / plumbing capex.
Questions for the listing agent
- What do current leases actually rent for vs. the listed asking? Can we see a recent rent roll and the last 12 months of T-12 income?
- Built in 1890 — when were the roof, HVAC, electrical panel, plumbing, and water heater last replaced?
- Is there a deadline driving the sale (1031 exchange, divorce, estate, relocation)? That informs how much negotiation room exists.
- The area grade is low — what's the realistic commute time and amenity access for the typical tenant pool here? Any planned neighborhood developments (good or bad) we should know about?
- What's the average days-on-market for RENTAL listings here right now (not sales)? A rising rental-DOM trend means longer vacancies and softer asking-rent achievability than the comps imply.
- What's the recent tenant-quality profile in this submarket — average credit score on applications, eviction rate, late-payment / NSF rate, and stable-employment percentage? A property-management company in the area should have these aggregated.
- How much new apartment / multifamily construction is in the pipeline within 1–3 miles? Heavy new supply (>2% of stock underway) typically softens rents 12–24 months out; light construction supports rent growth.
Investment metrics
- 1% rule
- 0.26% ✗
- Cap rate
- 1.12%
- Cash-on-cash
- -18.48%
- DSCR
- 0.18
- GRM
- 32.3
CMA / ARV
No comps found within radius.
Projected returns pro-forma
2.34% appreciation · 3.0% rent growth · sell at horizon
- IRR
- -12.2%
- Equity multiple
- 0.32×
- Total profit
- $-81,092
- Equity at exit
- $177,098
- IRR
- -5.9%
- Equity multiple
- 0.13×
- Total profit
- $-104,733
- Equity at exit
- $261,228
Cash invested: $120,120 (down + closing). Projections, not guarantees.
Landlord ↔ Tenant lean methodology
- Overall (STATE)
- 41 Moderately Tenant-Leaning
- State Vermont
- 41 Moderately Tenant-Leaning · D+15
- County
- — inherits STATE
- City
- — inherits STATE
ZIP-level market 05261
- Home prices YoY
- 0.8%
- Active inventory
- 23
- Price-to-rent
- 32.3×
Monthly cashflow live
- Estimated rent
- $1,108 medium interval (Pro) →
- Mortgage (P&I)
- −$2,250
- Tax from tax record
- −$296 /mo · $3,556/yr
- Insurance
- −$179
- HOA
- −$0
- Vacancy / Maint / Mgmt
- −$233
- Net cashflow
- $-1,849
Break-even live
UW: 25.0% down · 7.5% · 30yr · 1.5% tax · 5.0% vac · 8.0% maint · 8.0% mgmt
Financing live
Cash to close
- Down payment
- $107,250
- Closing costs
- $12,870
- Reserves months
- —
- Total cash needed
- —
Loan-product check · same deal, 3 products live
Conventional
25% down · 7.5% · 30yr
- Down + closing
- —
- Monthly P&I
- —
- Monthly cashflow
- —
- DSCR
- —
- Eligible?
- —
Personal DTI + credit; lowest rate.
DSCR
20% down · 8.5% · 30yr
- Down + closing
- —
- Monthly P&I
- —
- Monthly cashflow
- —
- DSCR
- —
- Eligible?
- —
No personal income docs; deal must DSCR.
Hard money
10% down · 12.0% · 12mo
- Down + closing
- —
- Monthly P&I
- —
- Monthly cashflow
- —
- DSCR
- —
- Eligible?
- —
Short-term bridge; refi at stabilization.
Listing history 10 events
-
2026-06-19days on market $429,000 Active 10 DOM
-
2026-06-18days on market $429,000 Active 9 DOM
-
2026-06-17days on market $429,000 Active 8 DOM
-
2026-06-16days on market $429,000 Active 7 DOM
-
2026-06-15days on market $429,000 Active 6 DOM
-
2026-06-14days on market $429,000 Active 4 DOM
-
2026-06-12days on market $429,000 Active 3 DOM
-
2026-06-09$429,000 Active 1 DOM
-
2026-06-09remarks 699-char remark
-
2026-06-09$429,000 Active 1 DOM
ⓘ Source: listings_history table (triggers on properties + properties_extension) + one-shot
backfill from property_details.listing_events for pre-trigger history.
Tax reassessment forecast VT · Partial reset (capped growth)
- Current annual tax
- $3,556 · $296/mo
- Projected year-2 tax
- $5,854 · $488/mo
- Expected delta
- +$2,297/yr (+$191/mo · 64.6%)
ⓘ Screening estimate from a state-policy table — verify with the county assessor before closing.
Climate risk First Street
- Flood 4/10 Moderate FEMA zone X (unshaded) · 22% chance over 30 yrs
- Wildfire 3/10 Moderate
- Heat 3/10 Moderate 8 d/yr ≥92°F today · 19 d/yr by 30 yrs out
- Wind 3/10 Moderate 6% chance of damaging wind over 30 yrs
- Air quality 2/10 Low 1 unhealthy d/yr today · 1 by 30 yrs out
Nearby sold comps map
Loading sold comps map…
Walkable amenities ~0.75 mi
Loading nearby amenities…
Taxation est. · year 1
- Rental income
- $13,298
- − Mortgage interest
- −$24,031
- − Property taxes
- −$3,556
- − Insurance
- −$2,145
- − Repairs & maintenance
- −$1,064
- − Management
- −$1,064
- − Depreciation
- −$12,480
- Taxable loss
- −$31,042
- Est. tax savings @ 24.0%
- +$7,450
- After-tax cash flow
- $-14,743/yr
For passive investors: Depreciation is non-cash, so a rental often shows a tax loss while cash-flowing — sheltering income. Rental losses are passive: they offset passive income freely, and up to $25,000/yr can offset ordinary (W-2) income if you actively participate and your MAGI is under $100k (phasing out to $0 by $150k); unused losses carry forward. On sale, claimed depreciation is recaptured at up to 25%, and gains may owe capital-gains tax (a 1031 exchange can defer both). Figures are a year-1 estimate at your 24.0% rate — not tax advice; consult a CPA.
Condition & rehab AI · 13 photos
This former church has been converted into a single-family home with good condition and moderate rehab needs. The property offers a unique opportunity with potential for various uses, including rental or resale.
Repairs flagged
- Minor exterior paint — some fading
- Minor interior paint — some fading
Value-add opportunities
- Both landscaping — enhances curb appeal and value
- Both interior paint — enhances interior aesthetics and value
Renovation cost estimate screening
| Repair item | Severity | Est. cost |
|---|---|---|
| exterior paint · some fading | Minor | $500–3,000 |
| interior paint · some fading | Minor | $500–3,000 |
| Total estimated repair cost · 2 items | $1,000–6,000 |
Value-add ROI direction
- Both landscaping — enhances curb appeal and value ↑
- Both interior paint — enhances interior aesthetics and value ↑
ⓘ Cost ranges are severity-bucket heuristics (US national rule-of-thumb). Get contractor quotes + a written scope before underwriting a rehab budget.
Schools (NCES district)
No district data.
Livability — North Pownal
No livability data for this city. (Only ~50 U.S. cities are tracked.)
Census & demographics
- Census place
- North Pownal, VT
- Population (ZIP)
- 2,200
Population outlook (Bennington County) Hauer SSP2
- Today (2025)
- 34,407 people
- By 2030
- 32,975 · -4.2%
- By 2040
- 29,711 · -13.6%
- By 2050
- 26,638 · -22.6%
- By 2075
- 21,318 · -38.0%
- By 2100
- 16,086 · -53.2%
Race, ethnicity, and origin ACS 2023
- Neighborhood character
- Predominantly White (94%)
- Race & ethnicity
- White 94% Hispanic / Latino 3% Two or more races 2%
- Common ancestry
- Lithuanian 9% Romanian 4% Slovak 1%
Political lean MEDSL · Bennington
- 2024 margin
- Strong D (+22.5) · D 60.0% · R 37.5% · Other 2.6%
- 2008→2024 swing
- -10.9pp toward R · 2008: 33.4pp · 2024: 22.5pp
- All cycles
- 2024: D+22.5 2020: D+27.3 2016: D+22.1 2012: D+33.3 2008: D+33.4
Not yet ingested
- Civics
- —
Market trends
- HPI YoY
- ▲ 2.34%
- Current HPI
- 301.5888
- Rent YoY
- —
- Metro
- —
- State GDP YoY
- —
- F500 in state
- 0
Price history
+95.0% since first listed12 events — show timeline
- 2026-05-28 Listed $429,000 BCMLS
- 2025-02-04 Sold (Public Records) $395,000 Public Records
- 2025-01-30 Sold (MLS) $395,000 BCMLS
- 2025-01-30 Sold (MLS) $395,000 PrimeMLS
- 2025-01-06 Contingent — PrimeMLS
- 2025-01-06 Pending — BCMLS
- 2024-12-12 Price Changed $423,000 PrimeMLS
- 2024-12-12 Price Changed $423,000 BCMLS
- 2024-10-04 Listed $449,000 BCMLS
- 2024-10-04 Listed $449,000 PrimeMLS
- 2023-11-17 Sold (Public Records) $282,000 Public Records
- 2022-08-23 Sold (Public Records) $220,000 Public Records
Property tax history
+18.1%/yrLatest (2024): $3,556 · +18.1% YoY. Source: county tax records.
Cash-flow waterfall
monthlySold comps — $/sqft
last 12 mo · ≤1 miLoading sold comps…