 🏷️ Likely Rental
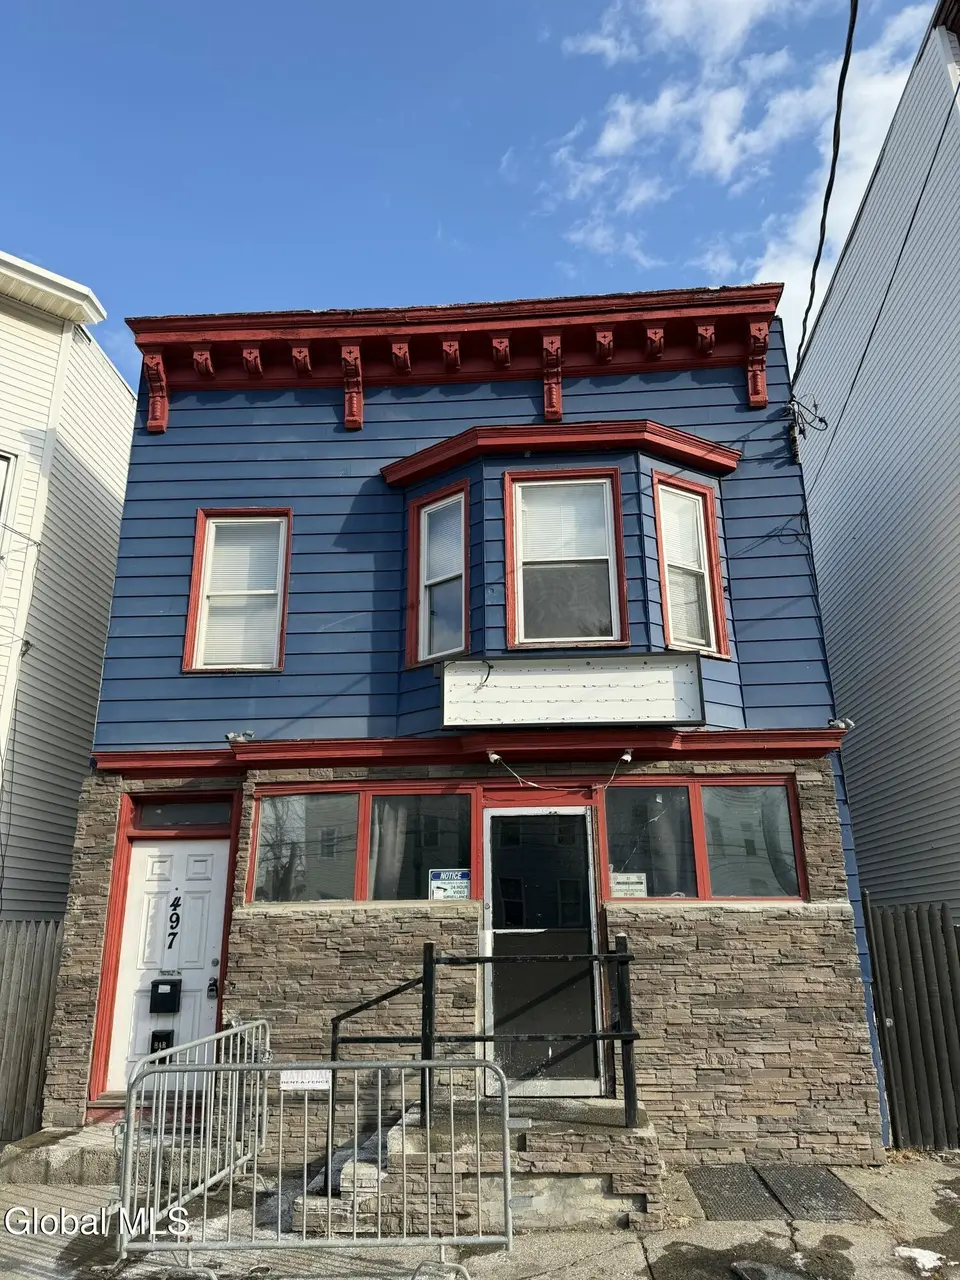
497 Washington Ave · Albany, NY
Flood risk No data
- FEMA flood zone
- —
- Chance of flooding over 30 yrs
- —
- Est. flood insurance / yr
- —
Fire risk No data
- Est. fire insurance / yr
- —
Heat risk No data
- Hot days now (above threshold)
- —
- Hot days in 30 yrs
- —
Wind risk No data
- Chance of severe wind over 30 yrs
- —
Air-quality risk No data
- Unhealthy air days now
- —
- Unhealthy air days in 30 yrs
- —
Risk factors via First Street. Map © Google.
Why this score? — see what drove the C grade
The composite is a weighted blend of 9 inputs, each scored 0–100. Each bar is that input's sub-score; the figure is the points it added to the 100-point composite (weight × sub-score).
- Cash flow +19.2/30.0
- ARV discount +15.0/15.0
- DSCR +6.1/10.0
- 1% rule +5.1/10.0
- Livability +4.0/5.0
- Rent growth +3.8/5.0
- Schools +3.2/10.0
- Condition / age +2.5/5.0
- Appreciation +0.0/10.0
$199,999
🖨 Deal sheet 📄 Offer letter ✓ Due diligence
Listing remarks MLS
Don't miss one of the best-priced commercial opportunities in Pine Hills! This mixed-use property offers immediate income with future upside in a highly visible location for your next business, just one block from the UAlbany Downtown Campus. The second floor features a leased 2-bedroom apartment secured through May 2027, providing stable income from the start. The vacant first-floor commercial space offers incredible flexibility. It is currently vacant and ready for your vision -- ideal for retail, office, studio, or service-based business. Close to Washington Park, the SUNY Albany downtown campus, and directly on the bus line, this property benefits from strong tenant demand, visibility, and convenience. This is a rare opportunity to secure a well-located mixed-use property in one of Albany's most active rental corridors with built-in income and future growth potential.
Key facts
- Leased apartment
- Mixed-use property
- Strong tenant demand
Tags
Neighborhood map
What this means for you Summary
Snapshot
- This is a 2-bed/2.0-bath single-family listed at $200k.
Deal economics
- At list price, monthly cash flow is $216 ($3k/yr) — positive.
- The deal already cash-flows at list — no discount required.
- Meets the 1% rule at list price ($2k rent vs $200k).
- Recommended offer: $182k (9.0% below list) — sets the bar for market timing.
- Cap rate 7.6% vs local median 5.7% in Albany — top-decile yield for the area; either an underpriced asset or a hidden risk that comps aren't pricing in. Stress-test before assuming the spread holds.
Location & tenants
- Location reads 79/100 on livability (#129 in NY, #2,083 nationally) — a middle-class / working-renter tenant base. Strengths: amenities A+, commute A+, housing A+; Watch: employment C-, crime F.
- Albany City School District (urban): math 37% / reading 40% proficiency, ranked #543 of 590 in NY (top 92%) — families likely to look elsewhere, expect single-tenant / working-renter base with shorter leases; 66% free/reduced lunch — lower-income household profile, screen leases tightly.
- Market conditions: Rents rising fast (+5.4%/yr); 89 active listings in the ZIP; 25 comparable units currently listed for rent nearby; rentals at typical pace (median 24d on market — plan ~3-4 weeks tenant-placement turnaround); lower-income renter base — watch delinquency; 675 units permitted in Albany County in 2024 (451 in 5+ unit buildings).
- At $2,022/mo this rent would consume 58% of the median local household income ($42k/yr) (locally 2035% of renters already pay >50% of income on rent) — very limited rent-growth headroom before tenants either downsize or default.
Forward outlook
- Local home prices are declining (-3.0%/yr); year-one equity from $1k of loan paydown is wiped out by about $6k of value loss. Plan a longer hold.
- Albany County population projected at +9% by 2050 — modest demand growth; plan on rents tracking national, not racing it.
Negotiation context
- It's been on market 117 days — a 9% lower offer ($182k) is reasonable based on typical stale-listing flexibility.
- 7 sale attempts since 6y ago; this cycle's ask has dropped $50k (20%) from the opening price — seller is motivated, your offer sets the floor, not the list.
Risks & watch-outs
- Watch-outs: built in 1910 — expect roof / HVAC / electrical / plumbing capex.
Questions for the listing agent
- It's been on market 117 days. Have you received any prior offers? Is the seller open to a 9% concession, seller financing, or rate buy-down credit?
- Built in 1910 — when were the roof, HVAC, electrical panel, plumbing, and water heater last replaced?
- Why hasn't it sold? Are there any deal-killer items the seller is aware of (foundation, flood, title, zoning, code violations)?
- Is there a deadline driving the sale (1031 exchange, divorce, estate, relocation)? That informs how much negotiation room exists.
- Crime grade is F in this area — have there been break-ins, vandalism, or insurance claims at this property in the last 3 years? What carrier currently insures it and at what premium?
- What's the average days-on-market for RENTAL listings here right now (not sales)? A rising rental-DOM trend means longer vacancies and softer asking-rent achievability than the comps imply.
- What's the recent tenant-quality profile in this submarket — average credit score on applications, eviction rate, late-payment / NSF rate, and stable-employment percentage? A property-management company in the area should have these aggregated.
- How much new for-sale + rental construction is in the pipeline within 1–3 miles? Heavy new supply typically softens prices + rents 12–24 months out; constrained supply supports both.
Investment metrics
- 1% rule
- 1.01% ✓
- Cap rate
- 7.59%
- Cash-on-cash
- 4.62%
- DSCR
- 1.21
- GRM
- 8.2
CMA / ARV
- ARV (median comp)
- $334,399
- List price
- $199,999
- Delta
- -40.19%
- Verdict
- UNDERPRICED
- Comps
- 20 within 1.0 mi
Show comp detail 5 sales within ~0.75 mi
| Address | Dist | Beds/Ba | Sqft | Sold | Price | $/sf | Match |
|---|---|---|---|---|---|---|---|
| 294 Western Ave | 0.32mi | 3/1.5 (+1) | 1,840 (-4%) | 12mo | $275,000 | $149 | 61 |
| 282 Morris St | 0.52mi | 3/1.5 (+1) | 1,766 (-8%) | 14mo | $250,000 | $142 | 43 |
| 564 Myrtle Ave | 0.55mi | 3/1.5 (+1) | 1,692 (-12%) | 8mo | $309,000 | $183 | 41 |
| 257 Quail St | 0.36mi | 2/2.5 | 2,208 (+15%) | 23mo | $200,000 | $91 | 38 |
| 105 S Lake Ave | 0.47mi | 3/2.5 (+1) | 2,200 (+14%) | 20mo | $360,000 | $164 | 30 |
Match score weights: distance 35% · size 25% · config 20% · recency 20%. Top-matched comps best support the ARV.
Projected returns pro-forma
-3.0% appreciation · 5.37% rent growth · sell at horizon
- IRR
- -6.4%
- Equity multiple
- 0.76×
- Total profit
- $-13,711
- Equity at exit
- $29,821
- IRR
- 5.9%
- Equity multiple
- 1.48×
- Total profit
- $27,131
- Equity at exit
- $17,292
Cash invested: $56,000 (down + closing). Projections, not guarantees.
Landlord ↔ Tenant lean methodology
- Overall (STATE)
- 15 Strongly Tenant-Friendly
- State New York
- 15 Strongly Tenant-Friendly · D+10
- County
- — inherits STATE
- City
- — inherits STATE
ZIP-level market 12206
- Home prices YoY
- -9.9%
- Rents YoY
- 5.4%
- Active inventory
- 89
- Price-to-rent
- 8.2×
Monthly cashflow live
- Estimated rent
- $2,022 high interval (Pro) →
- Mortgage (P&I)
- −$1,049
- Tax est. 1.5%
- −$250 /mo · $3,000/yr
- Insurance
- −$83
- HOA
- −$0
- Vacancy / Maint / Mgmt
- −$425
- Net cashflow
- $216
Break-even live
UW: 25.0% down · 7.5% · 30yr · 1.5% tax · 5.0% vac · 8.0% maint · 8.0% mgmt
Financing live
Cash to close
- Down payment
- $50,000
- Closing costs
- $6,000
- Reserves months
- —
- Total cash needed
- —
Loan-product check · same deal, 3 products live
Conventional
25% down · 7.5% · 30yr
- Down + closing
- —
- Monthly P&I
- —
- Monthly cashflow
- —
- DSCR
- —
- Eligible?
- —
Personal DTI + credit; lowest rate.
DSCR
20% down · 8.5% · 30yr
- Down + closing
- —
- Monthly P&I
- —
- Monthly cashflow
- —
- DSCR
- —
- Eligible?
- —
No personal income docs; deal must DSCR.
Hard money
10% down · 12.0% · 12mo
- Down + closing
- —
- Monthly P&I
- —
- Monthly cashflow
- —
- DSCR
- —
- Eligible?
- —
Short-term bridge; refi at stabilization.
Rent comps 25 comps
| Address | Beds | Baths | Sqft | Rent | $/sqft | DOM | Units | Dist |
|---|---|---|---|---|---|---|---|---|
| 147 Western Ave Albany, NY | 3.0 | 1.0 | 1428 | $1,800 | $1.26 | 14d | 1 | 0.13mi |
| 154 Spring St Albany, NY | 3.0 | 1.0 | 2500 | $1,695 | $0.68 | 43d | 1 | 0.15mi |
| 178 Western Ave Unit 3 Albany, NY | 3.0 | 1.0 | 1500 | $1,725 | $1.15 | 14d | 1 | 0.16mi |
| 240 Washington Ave Albany, NY | 2.0 | 2.0 | 1560 | $2,450 | $1.57 | 43d | 1 | 0.61mi |
| 363 Ontario St Albany, NY | 1.0–2.0 | 1.0–2.5 | 1610 | $3,485 | $2.16 | 14d | 1 | 0.68mi |
| 546 Mercer St Unit 1 Albany, NY | 3.0 | 1.0 | 1400 | $1,800 | $1.29 | 23d | 1 | 0.71mi |
| 88 Willett St Albany, NY | 3.0 | 1.0 | 825 | $1,802 | $2.18 | 14d | 10 | 0.72mi |
| 602 Morris St Albany, NY | 3.0 | 1.0 | 1270 | $1,850 | $1.46 | 14d | 1 | 0.72mi |
| 227 Jay St Albany, NY | 2.0 | 2.0 | 1710 | $2,150 | $1.26 | 43d | 1 | 0.74mi |
| 282 Livingston Ave Albany, NY | 3.0 | 1.5 | 1464 | $2,400 | $1.64 | 23d | 1 | 0.80mi |
| 21 Woodlawn Ave Unit 3RDFL Albany, NY | 3.0 | 1.0 | 1300 | $1,500 | $1.15 | 43d | 1 | 0.81mi |
| 21 Woodlawn Ave Unit 3rd floor Albany, NY | 3.0 | 1.0 | 1300 | $1,500 | $1.15 | 23d | 1 | 0.81mi |
| 41 Dove St Albany, NY | 2.0 | 2.5 | 2400 | $2,350 | $0.98 | 14d | 1 | 0.83mi |
| 366 Hamilton St #2 Albany, NY | 1.0 | 1.0 | 1400 | $1,800 | $1.29 | 14d | 1 | 0.86mi |
| 154 Lancaster St Unit 1 Albany, NY | 2.0 | 1.5 | 1500 | $2,200 | $1.47 | 23d | 1 | 0.88mi |
| 32 Peyster St Unit 2nd Albany, NY | 3.0 | 2.0 | 1500 | $2,300 | $1.53 | 43d | 1 | 0.91mi |
| 104 S Main Ave Unit 1 Albany, NY | 3.0 | 1.0 | 1300 | $2,600 | $2.00 | 43d | 1 | 0.99mi |
| 346 Madison Ave Albany, NY | 3.0 | 2.0 | 1500 | $2,495 | $1.66 | 23d | 1 | 0.99mi |
| 201 Park Ave Unit 10 Albany, NY | 3.0 | 2.0 | 1600 | $2,100 | $1.31 | 43d | 1 | 1.09mi |
| 78 S Pine Ave Unit 2 Albany, NY | 3.0 | 1.5 | 1541 | $2,350 | $1.52 | 14d | 1 | 1.13mi |
| 135 Winthrop Ave Albany, NY | 3.0 | 2.0 | 1788 | $3,500 | $1.96 | 43d | 1 | 1.17mi |
| 15 Ten Broeck St Albany, NY | 2.0 | 1.5 | 1900 | $1,750 | $0.92 | 21d | 1 | 1.28mi |
| 48 N Pearl St Albany, NY | 2.0 | 1.0–2.5 | 1251 | $3,500 | $2.80 | 14d | 17 | 1.37mi |
| 563 New Scotland Ave Albany, NY | 2.0 | 1.0–2.0 | 931 | $3,125 | $3.36 | 14d | 37 | 1.47mi |
| 32 Richmond St Unit 2 Albany, NY | 3.0 | 3.0 | 1248 | $2,500 | $2.00 | 14d | 1 | 1.48mi |
Listing history 32 events
-
2026-06-18days on market $199,999 Active 117 DOM
-
2026-06-17days on market $199,999 Active 116 DOM
-
2026-06-16days on market $199,999 Active 115 DOM
-
2026-06-15days on market $199,999 Active 114 DOM
-
2026-06-14days on market $199,999 Active 112 DOM
-
2026-06-10days on market $199,999 Active 109 DOM
-
2026-06-08days on market $199,999 Active 107 DOM
-
2026-06-07days on market $199,999 Active 106 DOM
-
2026-06-03days on market $199,999 Active 102 DOM
-
2026-06-02pricedays on market $199,999 Active 101 DOM
-
2026-06-01days on market $224,900 Active 100 DOM
-
2026-05-31days on market $224,900 Active 99 DOM
-
2026-05-31days on market $224,900 Active 98 DOM
-
2026-04-17price $224,900 894-char remark
Show marketing remark (894 chars)
Don't miss one of the best-priced commercial opportunities in Pine Hills! This mixed-use property offers immediate income with future upside in a highly visible location for your next business, just one block from the UAlbany Downtown Campus. The second floor features a leased 2-bedroom apartment secured through May 2027, providing stable income from the start. The vacant first-floor commercial space offers incredible flexibility. It is currently vacant and ready for your vision -- ideal for retail, office, studio, or service-based business. Close to Washington Park, the SUNY Albany downtown campus, and directly on the bus line, this property benefits from strong tenant demand, visibility, and convenience. This is a rare opportunity to secure a well-located mixed-use property in one of Albany's most active rental corridors with built-in income and future growth potential.
-
2026-02-21$250,000 Active 894-char remark
Show marketing remark (894 chars)
Don't miss one of the best-priced commercial opportunities in Pine Hills! This mixed-use property offers immediate income with future upside in a highly visible location for your next business, just one block from the UAlbany Downtown Campus. The second floor features a leased 2-bedroom apartment secured through May 2027, providing stable income from the start. The vacant first-floor commercial space offers incredible flexibility. It is currently vacant and ready for your vision -- ideal for retail, office, studio, or service-based business. Close to Washington Park, the SUNY Albany downtown campus, and directly on the bus line, this property benefits from strong tenant demand, visibility, and convenience. This is a rare opportunity to secure a well-located mixed-use property in one of Albany's most active rental corridors with built-in income and future growth potential.
-
2025-03-30price $219,900
-
2025-03-17status Active
-
2025-03-04status Pending
-
2025-03-04historical
-
2025-01-28status Active
-
2025-01-23historical Contingent
-
2024-12-30price $229,900
-
2024-12-30$299,900 Active
-
2024-12-28price $229,900
-
2024-07-10status Active
-
2024-07-07status Pending
-
2024-07-07historical
-
2024-07-07price $250,000
-
2024-06-28$250,000 Active
-
2020-08-07status Pend (Under Cntr)
-
2020-08-07historical
-
2020-03-03$149,000 New
ⓘ Source: listings_history table (triggers on properties + properties_extension) + one-shot
backfill from property_details.listing_events for pre-trigger history.
Nearby sold comps map
Loading sold comps map…
Walkable amenities ~0.75 mi
Loading nearby amenities…
Taxation est. · year 1
- Rental income
- $24,269
- − Mortgage interest
- −$11,203
- − Property taxes
- −$3,000
- − Insurance
- −$1,000
- − Repairs & maintenance
- −$1,942
- − Management
- −$1,942
- − Depreciation
- −$5,818
- Taxable loss
- −$635
- Est. tax savings @ 24.0%
- +$152
- After-tax cash flow
- $2,739/yr
For passive investors: Depreciation is non-cash, so a rental often shows a tax loss while cash-flowing — sheltering income. Rental losses are passive: they offset passive income freely, and up to $25,000/yr can offset ordinary (W-2) income if you actively participate and your MAGI is under $100k (phasing out to $0 by $150k); unused losses carry forward. On sale, claimed depreciation is recaptured at up to 25%, and gains may owe capital-gains tax (a 1031 exchange can defer both). Figures are a year-1 estimate at your 24.0% rate — not tax advice; consult a CPA.
Schools (NCES district)
- District
- Albany City School District
- NCES district ID
- 3602460
- Math proficiency
- 37% ▲ 6.00%
- Reading proficiency
- 40% ▲ 7.00%
- Median HH income
- $40,568
- Composite
- 32.34/100
- National rank
- #5744
- State rank
- #543 of 590 in NY
Livability — Albany
- Score
- 79/100
- State rank
- #129
- US rank
- #2083
Category grades
Schools grade is shown separately in the Schools card above.
Census & demographics
- Census place
- Albany, NY
- County
- Albany County · 196,626 people
- City population
- 116,921
- Metro
- Albany-Schenectady-Troy, NY
- Population (ZIP)
- 14,572
- Household income
- $41,548
- Rent vs Own
- Severe rent burden
- 2035.0
Population outlook (Albany County) Hauer SSP2
- Today (2025)
- 320,794 people
- By 2030
- 327,401 · +2.1%
- By 2040
- 338,218 · +5.4%
- By 2050
- 348,467 · +8.6%
- By 2075
- 381,693 · +19.0%
- By 2100
- 393,809 · +22.8%
Race, ethnicity, and origin ACS 2023
- Neighborhood character
- Highly diverse neighborhood (Simpson 0.75)
- Race & ethnicity
- Black 38% White 27% Hispanic / Latino 15% Two or more races 12% Asian 10%
- Hispanic origin (detail)
- Puerto Rican 10% Dominican 1%
- Common ancestry
- Italian 2% Lithuanian 2% Romanian 1%
- Foreign-born
- 22% · Canada, China
- Languages at home
- 75% English-only · Spanish 10% Other Indo-European 5% Chinese 3%
Political lean MEDSL · Albany
- 2024 margin
- Strong D (+25.8) · D 62.9% · R 37.1%
- 2008→2024 swing
- -3.6pp toward R · 2008: 29.4pp · 2024: 25.8pp
- All cycles
- 2024: D+25.8 2020: D+31.4 2016: D+24.3 2012: D+31.0 2008: D+29.4
Not yet ingested
- Civics
- —
Market trends
- HPI YoY
- ▼ -30.24%
- Current HPI
- 275.8109
- Rent YoY
- ▲ 5.37%
- Metro
- Albany-Schenectady-Troy, NY
- State GDP YoY
- ▲ 2.60%
- F500 in state
- 92
Industry mix (Fortune 500 HQ in NY)
| Industry | F500 HQs | Revenue |
|---|---|---|
| Financial Services | 10 | $950B |
|
||
| Consumer Goods | 9 | $162B |
|
||
| Insurance | 4 | $225B |
|
||
| Telecommunications | 2 | $144B |
|
||
| Pharmaceuticals | 2 | $112B |
|
||
| Media / Entertainment | 2 | $69B |
|
||
Price history
+50.9% since first listed19 events — show timeline
- 2026-04-17 Price Changed $224,900 Global MLS
- 2026-02-21 Listed $250,000 Global MLS
- 2025-03-30 Price Changed $219,900 Global MLS
- 2025-03-17 Relisted — Global MLS
- 2025-03-04 Pending — Global MLS
- 2025-03-04 Listing Removed — Global MLS
- 2025-01-28 Relisted — Global MLS
- 2025-01-23 Contingent — Global MLS
- 2024-12-30 Price Changed $229,900 Global MLS
- 2024-12-30 Listed $299,900 Global MLS
- 2024-12-28 Price Changed $229,900 Global MLS
- 2024-07-10 Relisted — Global MLS
- 2024-07-07 Pending — Global MLS
- 2024-07-07 Price Changed $250,000 Global MLS
- 2024-07-07 Listing Removed — Global MLS
- 2024-06-28 Listed $250,000 Global MLS
- 2020-08-07 Pending — Global MLS
- 2020-08-07 Listing Removed — Global MLS
- 2020-03-03 Listed $149,000 Global MLS
Cash-flow waterfall
monthlySold comps — $/sqft
last 12 mo · ≤1 miLoading sold comps…