 Multi-family
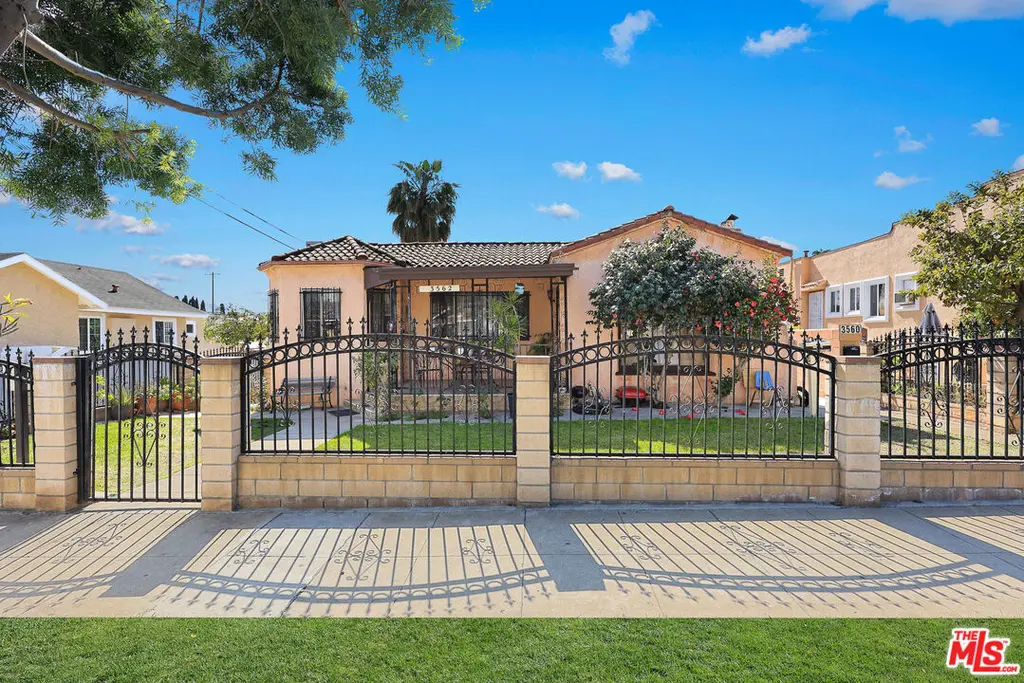
3560 Siskiyou St · Los Angeles, CA
Flood risk 1/10 · Minimal
- FEMA flood zone
- X (unshaded)
- Chance of flooding over 30 yrs
- 0.0%
- Est. flood insurance / yr
- $507 – $1,088
Fire risk 1/10 · Minimal
- Est. fire insurance / yr
- $659 – $1,223
Heat risk 6/10 · Moderate
- Hot days now (above 92°F)
- 7 days/yr
- Hot days in 30 yrs
- 21 days/yr
Wind risk 1/10 · Minimal
- Chance of severe wind over 30 yrs
- —
Air-quality risk 5/10 · Moderate
- Unhealthy air days now
- 9 days/yr
- Unhealthy air days in 30 yrs
- 9 days/yr
Risk factors via First Street. Map © Google.
Why this score? — see what drove the D grade
The composite is a weighted blend of 9 inputs, each scored 0–100. Each bar is that input's sub-score; the figure is the points it added to the 100-point composite (weight × sub-score).
- Cash flow +14.4/30.0
- ARV discount +10.4/15.0
- DSCR +4.4/10.0
- Schools +3.6/10.0
- Livability +3.4/5.0
- 1% rule +3.1/10.0
- Rent growth +2.6/5.0
- Condition / age +2.5/5.0
- Appreciation +0.0/10.0
$849,000
🖨 Deal sheet 📄 Offer letter ✓ Due diligence
Multi-family units
County records classify this as Multi-Family (2-4 Unit). Listing-text estimate: 1 unit. estimate disagrees with records
Listing remarks MLS
* * * 3 UNITS PRICED @ $849,000 * * * We are pleased to present three single story detached homes located in the East Los Angeles/Boyle Heights Neighborhood area. This property is being offered for sale for the first time in 23 years as it has been family owned, managed and operated for over two decades. Opportunity knocks to invest in this high density zoned (LARD1.5) with triple frontage lot on an 8,715 square foot lot. The three separate structures are outlined with a front house (3 bedroom + 1.5 bathroom, of 1,400 square foot and built in 1929), a middle cottage (2 bedroom + 1 bathroom, of 746 square foot and built in 1982 * * this unit is not subject to LA City RSO), and a rear cottage (2 bedroom + 1 bathroom, of 936 square foot and built in 1920). A new investor has substantial rental upside potential of +/- 96% with minimum expenses as these units are separately metered for gas and electricity. This location is considered 'Very Walkable with an 85 Walk Score'. Also, it is conveniently located near the 5, 60 and 101 freeways. Please note, this property is subject to Los Angeles City Rent Control (with the exception of 1 unit). Buyer to verify at their own expense.
Key facts
- Triple frontage lot
- 8,712 sq ft lot
- Garage
Tags
Neighborhood map
What this means for you Summary
Snapshot
- This is a 1-bed/1.0-bath multifamily listed at $849k.
Deal economics
- At list price, monthly cash flow is $170 ($2k/yr) — positive.
- The deal already cash-flows at list — no discount required.
- To meet the 1% rule (rent ≥ 1% of price), the offer needs to be $691k (18.6% below list).
- Recommended offer: $691k (18.6% below list) — sets the bar for 1% rule.
- Cap rate 6.5% vs local median 2.1% in Los Angeles — top-decile yield for the area; either an underpriced asset or a hidden risk that comps aren't pricing in. Stress-test before assuming the spread holds.
Location & tenants
- Location reads 68/100 on livability (#273 in CA) — a middle-class / working-renter tenant base. Strengths: amenities A+, commute A+, employment B; Watch: health & safety C-, schools D+, crime F.
- Los Angeles Unified (urban): math 29% / reading 54% proficiency, ranked #223 of 517 in CA (top 43%) — families likely to look elsewhere, expect single-tenant / working-renter base with shorter leases; 67% free/reduced lunch — lower-income household profile, screen leases tightly.
- Market conditions: Rents flat; 57 active listings in the ZIP; 36 comparable units currently listed for rent nearby; rentals at typical pace (median 25d on market — plan ~3-4 weeks tenant-placement turnaround); 44% of comp listings sitting > 30 days — soft ceiling on asking rent; 19,697 units permitted in Los Angeles County in 2024 (9,426 in 5+ unit buildings).
- At $6,911/mo this rent would consume 140% of the median local household income ($59k/yr) (locally 2670% of renters already pay >50% of income on rent) — very limited rent-growth headroom before tenants either downsize or default.
Forward outlook
- Local home prices are declining (-3.0%/yr); year-one equity from $6k of loan paydown is wiped out by about $25k of value loss. Plan a longer hold.
- Los Angeles County population projected at +9% by 2050 — modest demand growth; plan on rents tracking national, not racing it.
Negotiation context
- It's been on market 448 days — a 12% lower offer ($747k) is reasonable based on typical stale-listing flexibility.
- Current owner paid $200k; list at $849k implies a 324% gain — meaningful room to come down on a strong offer.
Risks & watch-outs
- Watch-outs: built in 1920 — expect roof / HVAC / electrical / plumbing capex.
- Climate carrying-cost: extreme-heat days projected 7→21/yr by 2055 (HVAC capex compounding) — expect insurance premiums to compound above CPI over the hold.
Questions for the listing agent
- It's been on market 448 days. Have you received any prior offers? Is the seller open to a 19% concession, seller financing, or rate buy-down credit?
- Built in 1920 — when were the roof, HVAC, electrical panel, plumbing, and water heater last replaced?
- Why hasn't it sold? Are there any deal-killer items the seller is aware of (foundation, flood, title, zoning, code violations)?
- Is there a deadline driving the sale (1031 exchange, divorce, estate, relocation)? That informs how much negotiation room exists.
- Schools are D-rated, which usually means shorter tenancies and higher turnover. Who's the typical renter profile here, and what's been the actual vacancy rate?
- Crime grade is F in this area — have there been break-ins, vandalism, or insurance claims at this property in the last 3 years? What carrier currently insures it and at what premium?
- The area grade is low — what's the realistic commute time and amenity access for the typical tenant pool here? Any planned neighborhood developments (good or bad) we should know about?
- What's the average days-on-market for RENTAL listings here right now (not sales)? A rising rental-DOM trend means longer vacancies and softer asking-rent achievability than the comps imply.
- What's the recent tenant-quality profile in this submarket — average credit score on applications, eviction rate, late-payment / NSF rate, and stable-employment percentage? A property-management company in the area should have these aggregated.
- How much new apartment / multifamily construction is in the pipeline within 1–3 miles? Heavy new supply (>2% of stock underway) typically softens rents 12–24 months out; light construction supports rent growth.
Investment metrics
- 1% rule
- 0.81% ✗
- Cap rate
- 6.53%
- Cash-on-cash
- 0.86%
- DSCR
- 1.04
- GRM
- 10.2
CMA / ARV
- ARV (median comp)
- $906,429
- List price
- $849,000
- Delta
- -6.34%
- Verdict
- FAIR
- Comps
- 20 within 1.0 mi
Show comp detail 1 sale within ~0.75 mi
| Address | Dist | Beds/Ba | Sqft | Sold | Price | $/sf | Match |
|---|---|---|---|---|---|---|---|
| 1212 Spence St | 0.43mi | 2/2.0 (+1) | 904 (-3%) | 18mo | $675,205 | $747 | 50 |
Match score weights: distance 35% · size 25% · config 20% · recency 20%. Top-matched comps best support the ARV.
Projected returns pro-forma
-3.0% appreciation · 0.21% rent growth · sell at horizon
- IRR
- -17.8%
- Equity multiple
- 0.39×
- Total profit
- $-145,846
- Equity at exit
- $126,589
- IRR
- -15.8%
- Equity multiple
- 0.21×
- Total profit
- $-187,290
- Equity at exit
- $73,406
Cash invested: $237,720 (down + closing). Projections, not guarantees.
Landlord ↔ Tenant lean methodology
- Overall (CITY)
- 0 Strongly Tenant-Friendly
- State California
- 18 Strongly Tenant-Friendly · D+13
- County
- — inherits STATE
- City Los Angeles
- 0 Strongly Tenant-Friendly · D+22
ZIP-level market 90023
- Rents YoY
- 0.2%
- Active inventory
- 57
- Price-to-rent
- 26.7×
Monthly cashflow live
- Estimated rent
- $6,911 medium interval (Pro) →
- Mortgage (P&I)
- −$4,452
- Tax from tax record
- −$483 /mo · $5,799/yr
- Insurance
- −$354
- HOA
- −$0
- Vacancy / Maint / Mgmt
- −$1,451
- Net cashflow
- $170
Break-even live
3-unit breakdown (identical units grouped — click to expand)
| Units | Beds | Baths | Est. rent |
|---|---|---|---|
| 1× unit | 3 | 1.5 | $2,648 |
| 1× unit | 2 | 1 | $2,243 |
| 1× unit | 0 | 0 | $2,021 |
| Total (3 units) | $6,911 | ||
UW: 25.0% down · 7.5% · 30yr · 1.5% tax · 5.0% vac · 8.0% maint · 8.0% mgmt
Financing live
Cash to close
- Down payment
- $212,250
- Closing costs
- $25,470
- Reserves months
- —
- Total cash needed
- —
Loan-product check · same deal, 3 products live
Conventional
25% down · 7.5% · 30yr
- Down + closing
- —
- Monthly P&I
- —
- Monthly cashflow
- —
- DSCR
- —
- Eligible?
- —
Personal DTI + credit; lowest rate.
DSCR
20% down · 8.5% · 30yr
- Down + closing
- —
- Monthly P&I
- —
- Monthly cashflow
- —
- DSCR
- —
- Eligible?
- —
No personal income docs; deal must DSCR.
Hard money
10% down · 12.0% · 12mo
- Down + closing
- —
- Monthly P&I
- —
- Monthly cashflow
- —
- DSCR
- —
- Eligible?
- —
Short-term bridge; refi at stabilization.
Rent comps 36 comps
| Address | Beds | Baths | Sqft | Rent | $/sqft | DOM | Units | Dist |
|---|---|---|---|---|---|---|---|---|
| 3420 Percy St Unit 3 Los Angeles, CA | 1.0 | 1.0 | 600 | $1,750 | $2.92 | 43d | 1 | 0.25mi |
| 969 S Lorena St Unit 1/2 Commerce, CA | 2.0 | 2.5 | 1100 | $2,600 | $2.36 | 7d | 1 | 0.26mi |
| 969 S Lorena St Unit 1/2 Commerce, CA | 2.0 | 2.5 | 1100 | $2,600 | $2.36 | 5d | 1 | 0.26mi |
| 3436 Hunter St Unit A Los Angeles, CA | — | 1.0 | 600 | $1,787 | $2.98 | 14d | 1 | 0.53mi |
| 3824 Princeton St Los Angeles, CA | 2.0 | 1.0 | 980 | $2,380 | $2.43 | 14d | 1 | 0.57mi |
| 3059 E 5th St Los Angeles, CA | 1.0 | 1.0 | 530 | $1,800 | $3.40 | 43d | 1 | 0.72mi |
| 2853 E 6th St Los Angeles, CA | 2.0 | 1.0 | 552 | $2,000 | $3.62 | 44d | 1 | 0.81mi |
| 2853 E 6th St Unit 2 Los Angeles, CA | 2.0 | 1.0 | 1000 | $2,800 | $2.80 | 43d | 1 | 0.81mi |
| 607 Camulos St Los Angeles, CA | 1.0 | 1.0 | 600 | $1,600 | $2.67 | 43d | 1 | 0.91mi |
| 2735 E 6th St Los Angeles, CA | 1.0 | 1.0 | 520 | $2,245 | $4.31 | 3d | 43 | 0.95mi |
| 1149 Marietta St Los Angeles, CA | 1.0 | 1.0 | 650 | $2,100 | $3.23 | 22d | 1 | 0.96mi |
| 1140 S Record Ave Los Angeles, CA | 2.0 | 1.0 | 800 | $2,700 | $3.38 | 43d | 1 | 0.98mi |
| 2901 E Olympic Blvd Los Angeles, CA | 3.0 | 1.0 | 711 | $1,750 | $2.46 | 2d | 11 | 1.00mi |
| 2901 E Olympic Blvd Los Angeles, CA | 2.0 | 1.0 | 565 | $1,800 | $3.19 | 43d | 14 | 1.00mi |
| 1050 1/2 S Bonnie Beach Pl Los Angeles, CA | 2.0 | 1.5 | 985 | $2,562 | $2.60 | 24d | 1 | 1.03mi |
| 460 S Mott St Los Angeles, CA | 2.0 | 2.0 | 736 | $3,500 | $4.76 | 43d | 1 | 1.05mi |
| 652 S Mathews St Unit 2508 Los Angeles, CA | 2.0 | 1.0 | 572 | $2,900 | $5.07 | 15d | 1 | 1.11mi |
| 2617 E 4th St Los Angeles, CA | 1.0 | 1.0 | 527 | $1,950 | $3.70 | 43d | 1 | 1.17mi |
| 150 1/2 S Bonnie Beach Pl Los Angeles, CA | 1.0 | 1.0 | 700 | $1,800 | $2.57 | 24d | 1 | 1.21mi |
| 321 S Fickett St Unit 503 Los Angeles, CA | 2.0 | 1.0 | 900 | $2,495 | $2.77 | 7d | 1 | 1.22mi |
| 215 S Fickett St Unit 5 Los Angeles, CA | 2.0 | 1.0 | 750 | $1,913 | $2.55 | 11d | 1 | 1.25mi |
| 215 S Fickett St Unit 5 Los Angeles, CA | 2.0 | 1.0 | 750 | $1,913 | $2.55 | 7d | 1 | 1.25mi |
| 220 N Saratoga St Los Angeles, CA | 1.0 | 1.0 | 600 | $1,800 | $3.00 | 43d | 1 | 1.27mi |
| 456 S Breed St Unit 28 Los Angeles, CA | 2.0 | 2.0 | 613 | $2,650 | $4.32 | 43d | 1 | 1.34mi |
| 456 S Breed St Apt 207 Los Angeles, CA | 1.0 | 1.0 | 550 | $1,925 | $3.50 | 43d | 1 | 1.34mi |
| 456 S Breed St Los Angeles, CA | 1.0 | 1.0 | 574 | $1,775 | $3.09 | 24d | 3 | 1.34mi |
| 116 S Mathews St Los Angeles, CA | 1.0 | 1.0 | 700 | $1,575 | $2.25 | 43d | 1 | 1.36mi |
| 215 N Fickett St Unit 5 Los Angeles, CA | 2.0 | 1.0 | 750 | $1,913 | $2.55 | 14d | 1 | 1.40mi |
| 215 N Fickett St Unit 5 Los Angeles, CA | 2.0 | 1.0 | 750 | $1,913 | $2.55 | 5d | 1 | 1.40mi |
| 215 N Fickett St Los Angeles, CA | 2.0 | 1.0 | 750 | $2,195 | $2.93 | 17d | 1 | 1.40mi |
| 215 N Fickett St Unit 5 Los Angeles, CA | 2.0 | 1.0 | 750 | $1,913 | $2.55 | 4d | 1 | 1.40mi |
| 215 N Fickett St Los Angeles, CA | 2.0 | 1.0 | 750 | $1,913 | $2.55 | 11d | 1 | 1.40mi |
| 201 S Soto St Unit 04 Los Angeles, CA | 1.0 | 1.0 | 650 | $1,850 | $2.85 | 43d | 1 | 1.41mi |
| 2819 Folsom St Los Angeles, CA | 2.0 | 1.0 | 800 | $2,800 | $3.50 | 43d | 1 | 1.43mi |
| 2424 Michigan Ave Unit 1-17 Los Angeles, CA | 1.0 | 1.0 | 526 | $2,172 | $4.13 | 43d | 1 | 1.47mi |
| 4045 San Carlos St Los Angeles, CA | 2.0 | 1.0 | 700 | $2,550 | $3.64 | 7d | 1 | 1.49mi |
Listing history 5 events
-
2025-08-20price $849,000 1196-char remark
Show marketing remark (1196 chars)
* * * 3 UNITS PRICED @ $849,000 * * * We are pleased to present three single story detached homes located in the East Los Angeles/Boyle Heights Neighborhood area. This property is being offered for sale for the first time in 23 years as it has been family owned, managed and operated for over two decades. Opportunity knocks to invest in this high density zoned (LARD1.5) with triple frontage lot on an 8,715 square foot lot. The three separate structures are outlined with a front house (3 bedroom + 1.5 bathroom, of 1,400 square foot and built in 1929), a middle cottage (2 bedroom + 1 bathroom, of 746 square foot and built in 1982 * * this unit is not subject to LA City RSO), and a rear cottage (2 bedroom + 1 bathroom, of 936 square foot and built in 1920). A new investor has substantial rental upside potential of +/- 96% with minimum expenses as these units are separately metered for gas and electricity. This location is considered 'Very Walkable with an 85 Walk Score'. Also, it is conveniently located near the 5, 60 and 101 freeways. Please note, this property is subject to Los Angeles City Rent Control (with the exception of 1 unit). Buyer to verify at their own expense.
-
2025-04-01price $899,000 1196-char remark
Show marketing remark (1196 chars)
* * * 3 UNITS PRICED @ $849,000 * * * We are pleased to present three single story detached homes located in the East Los Angeles/Boyle Heights Neighborhood area. This property is being offered for sale for the first time in 23 years as it has been family owned, managed and operated for over two decades. Opportunity knocks to invest in this high density zoned (LARD1.5) with triple frontage lot on an 8,715 square foot lot. The three separate structures are outlined with a front house (3 bedroom + 1.5 bathroom, of 1,400 square foot and built in 1929), a middle cottage (2 bedroom + 1 bathroom, of 746 square foot and built in 1982 * * this unit is not subject to LA City RSO), and a rear cottage (2 bedroom + 1 bathroom, of 936 square foot and built in 1920). A new investor has substantial rental upside potential of +/- 96% with minimum expenses as these units are separately metered for gas and electricity. This location is considered 'Very Walkable with an 85 Walk Score'. Also, it is conveniently located near the 5, 60 and 101 freeways. Please note, this property is subject to Los Angeles City Rent Control (with the exception of 1 unit). Buyer to verify at their own expense.
-
2025-03-04$995,000 Active 1196-char remark
Show marketing remark (1196 chars)
* * * 3 UNITS PRICED @ $849,000 * * * We are pleased to present three single story detached homes located in the East Los Angeles/Boyle Heights Neighborhood area. This property is being offered for sale for the first time in 23 years as it has been family owned, managed and operated for over two decades. Opportunity knocks to invest in this high density zoned (LARD1.5) with triple frontage lot on an 8,715 square foot lot. The three separate structures are outlined with a front house (3 bedroom + 1.5 bathroom, of 1,400 square foot and built in 1929), a middle cottage (2 bedroom + 1 bathroom, of 746 square foot and built in 1982 * * this unit is not subject to LA City RSO), and a rear cottage (2 bedroom + 1 bathroom, of 936 square foot and built in 1920). A new investor has substantial rental upside potential of +/- 96% with minimum expenses as these units are separately metered for gas and electricity. This location is considered 'Very Walkable with an 85 Walk Score'. Also, it is conveniently located near the 5, 60 and 101 freeways. Please note, this property is subject to Los Angeles City Rent Control (with the exception of 1 unit). Buyer to verify at their own expense.
-
2002-04-26soldstatus $200,000
-
1974-10-18soldstatus $31,500
ⓘ Source: listings_history table (triggers on properties + properties_extension) + one-shot
backfill from property_details.listing_events for pre-trigger history.
Tax reassessment forecast CA · Resets to sale price
- Current annual tax
- $5,799 · $483/mo
- Projected year-2 tax
- $6,452 · $538/mo
- Expected delta
- +$653/yr (+$54/mo · 11.3%)
ⓘ Screening estimate from a state-policy table — verify with the county assessor before closing.
Climate risk First Street
- Flood 1/10 Low FEMA zone X (unshaded) · 0% chance over 30 yrs
- Wildfire 1/10 Low
- Heat 6/10 Major 7 d/yr ≥92°F today · 21 d/yr by 30 yrs out
- Wind 1/10 Low
- Air quality 5/10 Major 9 unhealthy d/yr today · 9 by 30 yrs out
Nearby sold comps map
Loading sold comps map…
Walkable amenities ~0.75 mi
Loading nearby amenities…
Taxation est. · year 1
- Rental income
- $82,932
- − Mortgage interest
- −$47,557
- − Property taxes
- −$5,799
- − Insurance
- −$4,245
- − Repairs & maintenance
- −$6,635
- − Management
- −$6,635
- − Depreciation
- −$24,698
- Taxable loss
- −$12,637
- Est. tax savings @ 24.0%
- +$3,033
- After-tax cash flow
- $5,078/yr
For passive investors: Depreciation is non-cash, so a rental often shows a tax loss while cash-flowing — sheltering income. Rental losses are passive: they offset passive income freely, and up to $25,000/yr can offset ordinary (W-2) income if you actively participate and your MAGI is under $100k (phasing out to $0 by $150k); unused losses carry forward. On sale, claimed depreciation is recaptured at up to 25%, and gains may owe capital-gains tax (a 1031 exchange can defer both). Figures are a year-1 estimate at your 24.0% rate — not tax advice; consult a CPA.
Schools (NCES district)
- District
- Los Angeles Unified
- NCES district ID
- 0622710
- Math proficiency
- 29% ▼ -4.00%
- Reading proficiency
- 54% ▲ 10.00%
- Median HH income
- $50,403
- Composite
- 35.67/100
- National rank
- #4875
- State rank
- #223 of 517 in CA
Livability — Los Angeles
- Score
- 68/100
- State rank
- #273
- US rank
- #9237
Category grades
Schools grade is shown separately in the Schools card above.
Census & demographics
- Census place
- Los Angeles, CA
- County
- Los Angeles County · 9,444,647 people
- City population
- 3,838,149
- Metro
- Los Angeles-Long Beach-Anaheim, CA
- Population (ZIP)
- 43,857
- Household income
- $59,057
- Rent vs Own
- Severe rent burden
- 2670.0
Population outlook (Los Angeles County) Hauer SSP2
- Today (2025)
- 10,940,515 people
- By 2030
- 11,256,481 · +2.9%
- By 2040
- 11,729,929 · +7.2%
- By 2050
- 11,948,407 · +9.2%
- By 2075
- 11,818,114 · +8.0%
- By 2100
- 10,842,928 · -0.9%
Race, ethnicity, and origin ACS 2023
- Neighborhood character
- Predominantly Hispanic (96%)
- Race & ethnicity
- Hispanic / Latino 96% Two or more races 17% Native American 2% White 2%
- Hispanic origin (detail)
- Mexican 80%
- Common ancestry
- Italian 1%
- Foreign-born
- 41% · Canada, Jamaica
- Languages at home
- 16% English-only · Spanish 83%
Political lean MEDSL · Los Angeles
- 2024 margin
- Solid D (+32.9) · D 64.8% · R 31.9% · Other 3.3%
- 2008→2024 swing
- -7.4pp toward R · 2008: 40.4pp · 2024: 32.9pp
- All cycles
- 2024: D+32.9 2020: D+44.2 2016: D+48.0 2012: D+40.0 2008: D+40.4
Not yet ingested
- Civics
- —
Market trends
- HPI YoY
- ▼ -702.74%
- Current HPI
- 430.9762
- Rent YoY
- ▲ 0.21%
- Metro
- Los Angeles-Long Beach-Anaheim, CA
- State GDP YoY
- ▲ 3.21%
- F500 in state
- 116
Industry mix (Fortune 500 HQ in CA)
| Industry | F500 HQs | Revenue |
|---|---|---|
| Technology | 27 | $1,492B |
|
||
| Financial Services | 3 | $174B |
|
||
| Retail | 3 | $44B |
|
||
| Insurance | 3 | $26B |
|
||
| Media / Entertainment | 2 | $115B |
|
||
| Pharmaceuticals / Biotech | 2 | $62B |
|
||
Price history
+2595.2% since first listed5 events — show timeline
- 2025-08-20 Price Changed $849,000 TheMLS
- 2025-04-01 Price Changed $899,000 TheMLS
- 2025-03-04 Listed $995,000 TheMLS
- 2002-04-26 Sold (Public Records) $200,000 Public Records
- 1974-10-18 Sold (Public Records) $31,500 Public Records
Property tax history
+1.8%/yrLatest (2025): $5,799 · +1.4% YoY. Source: county tax records.
Cash-flow waterfall
monthlySold comps — $/sqft
last 12 mo · ≤1 miLoading sold comps…