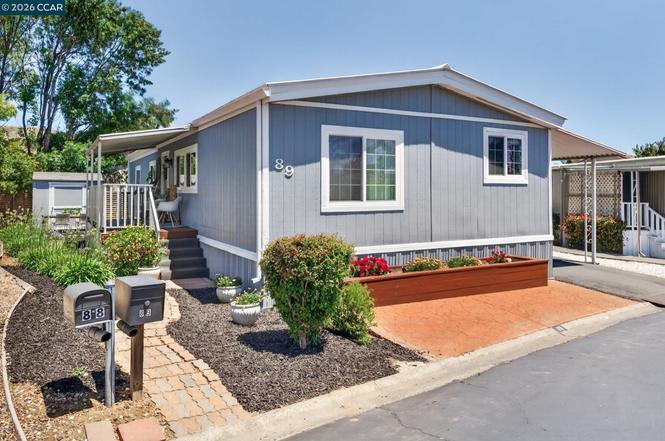
89 Goya Dr · Fairfield, CA
Flood risk 1/10 · Minimal
- FEMA flood zone
- X (unshaded)
- Chance of flooding over 30 yrs
- 0.0%
- Est. flood insurance / yr
- $507 – $1,088
Fire risk 7/10 · Major
- Est. fire insurance / yr
- $659 – $1,223
Heat risk 5/10 · Moderate
- Hot days now (above 99°F)
- 7 days/yr
- Hot days in 30 yrs
- 14 days/yr
Wind risk 1/10 · Minimal
- Chance of severe wind over 30 yrs
- —
Air-quality risk 10/10 · Severe
- Unhealthy air days now
- 21 days/yr
- Unhealthy air days in 30 yrs
- 22 days/yr
Risk factors via First Street. Map © Google.
Why this score? — see what drove the B grade
The composite is a weighted blend of 9 inputs, each scored 0–100. Each bar is that input's sub-score; the figure is the points it added to the 100-point composite (weight × sub-score).
- Cash flow +28.2/30.0
- ARV discount +15.0/15.0
- DSCR +10.0/10.0
- 1% rule +7.8/10.0
- Condition / age +3.8/5.0
- Schools +3.5/10.0
- Livability +3.4/5.0
- Rent growth +2.4/5.0
- Appreciation +0.0/10.0
$195,000
🖨 Deal sheet 📄 Offer letter ✓ Due diligence
Listing remarks
Welcome Home to 89 Goya Drive, located in the highly desirable Casa Nova 55+ community in the heart of Fairfield. Ideally situated just minutes from Interstate 80, this exceptional location offers convenient access to Sacramento, the Bay Area, Napa Valley wine country, shopping, dining, medical services & everyday conveniences. Beautifully maintained 1,344 sq. ft. , move-in ready & in pristine condition, featuring vaulted ceilings, brand-new carpeting throughout, newer appliances, stunning new chandelier, newer roof, dual-pane windows, central heating & air-conditioning. Natural light fills every room, creating a warm & inviting atmosphere. The spacious floor plan of
Key facts
- Impressive pantry
- Welcoming clubhouse
- Community pool
Tags
Property features AI
Finance
- HOA & community: Park name: DOVER MHP; Community clubhouse; On-site fitness center; Community pool; Senior community (check park rules for pet policies)
Exterior
- Parking: Carport with space for 2 or more vehicles
- Utilities: 220V electrical in kitchen; Public sewer
- Home design: Manufactured in park (mobile home); Double-wide model (Stoneridge); Aluminum skirting
- Construction: Wood siding construction
- Exterior features: Porch with steps; Low-maintenance yard; On-site storage area; Close to clubhouse; Level, landscaped setting
Interior
- Kitchen: Dishwasher; Gas range / cooktop; Built-in oven; Microwave; Disposal; Refrigerator; Solid surface counters; Pantry; 220V outlet in kitchen
- Bedrooms: 2 bedrooms (primary bedroom suite on street level)
- Flooring: Carpet; Laminate; Vinyl
- Bathrooms: 2 full bathrooms; Primary bathroom with stall shower, updated finishes, and window; Other bath(s) with shower over tub, updated finishes, and window
- Heating & cooling: Central heating; Central air; Ceiling fans
- Interior features: Solid surface counters; Pantry; Dining area; Storage areas; Accessible full bathroom; Accessible kitchen; Double-pane windows
- Laundry & utility: Laundry room with washer and dryer; 220V outlet; Laundry cabinets
Neighborhood map
What this means for you Summary
Snapshot
- This is a 2-bed/2.0-bath manufactured listed at $195k. Condition is rated good.
Deal economics
- At list price, monthly cash flow is $619 ($7k/yr) — positive.
- The deal already cash-flows at list — no discount required.
- Meets the 1% rule at list price ($2k rent vs $195k).
- Cap rate 10.1% vs local median 3.0% in Fairfield — top-decile yield for the area; either an underpriced asset or a hidden risk that comps aren't pricing in. Stress-test before assuming the spread holds.
Location & tenants
- Location reads 67/100 on livability (#314 in CA) — a middle-class / working-renter tenant base. Strengths: employment A+, housing A+, health & safety A+; Watch: schools C-, crime D-, commute F.
- Fairfield-Suisun Unified (urban): math 23% / reading 53% proficiency, ranked #238 of 517 in CA (top 46%) — families likely to look elsewhere, expect single-tenant / working-renter base with shorter leases.
- Market conditions: Rents soft (-0.3%/yr); 146 active listings in the ZIP; 23 comparable units currently listed for rent nearby; rentals lingering (median 44d on market — plan ~5-8 weeks vacancy on turnover, expect pricing pressure); 57% of comp listings sitting > 30 days — soft ceiling on asking rent; high-income renter base; 1,472 units permitted in Solano County in 2024 (131 in 5+ unit buildings).
Forward outlook
- Local home prices are declining (-3.0%/yr); year-one equity from $1k of loan paydown is wiped out by about $6k of value loss. Plan a longer hold.
- Solano County population projected at +15% by 2050 — modest demand growth; plan on rents tracking national, not racing it.
Negotiation context
- Only 7 days on market — expect competitive offers; lowballing is unlikely to land.
Risks & watch-outs
- Climate carrying-cost: major wildfire risk; extreme-heat days projected 7→14/yr by 2055 (HVAC capex compounding) — expect insurance premiums to compound above CPI over the hold.
Questions for the listing agent
- Is there a deadline driving the sale (1031 exchange, divorce, estate, relocation)? That informs how much negotiation room exists.
- Crime grade is D in this area — have there been break-ins, vandalism, or insurance claims at this property in the last 3 years? What carrier currently insures it and at what premium?
- What's the average days-on-market for RENTAL listings here right now (not sales)? A rising rental-DOM trend means longer vacancies and softer asking-rent achievability than the comps imply.
- What's the recent tenant-quality profile in this submarket — average credit score on applications, eviction rate, late-payment / NSF rate, and stable-employment percentage? A property-management company in the area should have these aggregated.
- How much new for-sale + rental construction is in the pipeline within 1–3 miles? Heavy new supply typically softens prices + rents 12–24 months out; constrained supply supports both.
Investment metrics
- 1% rule
- 1.28% ✓
- Cap rate
- 10.10%
- Cash-on-cash
- 13.61%
- DSCR
- 1.61
- GRM
- 6.5
CMA / ARV
- ARV (on-the-fly)
- $260,736
- Comps found
- 2
Show comp detail 2 sales within ~0.75 mi
| Address | Dist | Beds/Ba | Sqft | Sold | Price | $/sf | Match |
|---|---|---|---|---|---|---|---|
| 114 Goya Dr | 0.21mi | 2/2.0 | 1,440 (+7%) | 1mo | $280,000 | $194 | 78 |
| 42 Goya Dr | 0.14mi | 2/2.0 | 1,200 (-11%) | 8mo | $225,000 | $188 | 69 |
Match score weights: distance 35% · size 25% · config 20% · recency 20%. Top-matched comps best support the ARV.
Projected returns pro-forma
-3.0% appreciation · 0.0% rent growth · sell at horizon
- IRR
- 0.3%
- Equity multiple
- 1.01×
- Total profit
- $572
- Equity at exit
- $29,075
- IRR
- 6.6%
- Equity multiple
- 1.43×
- Total profit
- $23,226
- Equity at exit
- $16,860
Cash invested: $54,600 (down + closing). Projections, not guarantees.
Landlord ↔ Tenant lean methodology
- Overall (STATE)
- 18 Strongly Tenant-Friendly
- State California
- 18 Strongly Tenant-Friendly · D+13
- County
- — inherits STATE
- City
- — inherits STATE
ZIP-level market 94534
- Rents YoY
- -0.3%
- Active inventory
- 146
- Price-to-rent
- 6.5×
Monthly cashflow live
- Estimated rent
- $2,489 high interval (Pro) →
- Mortgage (P&I)
- −$1,023
- Tax est. 1.5%
- −$244 /mo · $2,925/yr
- Insurance
- −$81
- HOA
- −$0
- Vacancy / Maint / Mgmt
- −$523
- Net cashflow
- $619
Break-even live
UW: 25.0% down · 7.5% · 30yr · 1.5% tax · 5.0% vac · 8.0% maint · 8.0% mgmt
Financing live
Cash to close
- Down payment
- $48,750
- Closing costs
- $5,850
- Reserves months
- —
- Total cash needed
- —
Loan-product check · same deal, 3 products live
Conventional
25% down · 7.5% · 30yr
- Down + closing
- —
- Monthly P&I
- —
- Monthly cashflow
- —
- DSCR
- —
- Eligible?
- —
Personal DTI + credit; lowest rate.
DSCR
20% down · 8.5% · 30yr
- Down + closing
- —
- Monthly P&I
- —
- Monthly cashflow
- —
- DSCR
- —
- Eligible?
- —
No personal income docs; deal must DSCR.
Hard money
10% down · 12.0% · 12mo
- Down + closing
- —
- Monthly P&I
- —
- Monthly cashflow
- —
- DSCR
- —
- Eligible?
- —
Short-term bridge; refi at stabilization.
Rent comps 23 comps
| Address | Beds | Baths | Sqft | Rent | $/sqft | DOM | Units | Dist |
|---|---|---|---|---|---|---|---|---|
| 2550 Hilborn Rd Fairfield, CA | 1.0–2.0 | 1.0–2.0 | 870 | $2,563 | $2.95 | 13d | 16 | 0.34mi |
| 287 Camellia St Fairfield, CA | 3.0 | 2.0 | 1750 | $2,950 | $1.69 | 13d | 1 | 0.52mi |
| 1111 Alaska Ave Fairfield, CA | 1.0–2.0 | 1.0 | 787 | $2,249 | $2.86 | 13d | 10 | 0.57mi |
| 100 Hawthorn Dr Fairfield, CA | 1.0–2.0 | 1.0 | 726 | $2,249 | $3.10 | 13d | 11 | 0.58mi |
| 2308 Pennsylvania Ave Fairfield, CA | 2.0 | 1.0 | 1852 | $2,395 | $1.29 | 43d | 1 | 0.63mi |
| 2542 Vista Grande Fairfield, CA | 3.0 | 2.5 | 1712 | $2,850 | $1.66 | 43d | 1 | 0.66mi |
| 3001 N Texas St Fairfield, CA | 1.0–2.0 | 1.0–2.0 | 931 | $2,374 | $2.55 | 13d | 8 | 0.68mi |
| 2134 Union Ave Fairfield, CA | 2.0 | 1.0 | 950 | $2,395 | $2.52 | 43d | 1 | 0.86mi |
| 101 Tabor Ave Unit A Fairfield, CA | 3.0 | 1.0 | 900 | $2,100 | $2.33 | 43d | 1 | 0.98mi |
| 2543 Hastings Way Fairfield, CA | 3.0 | 2.0 | 1603 | $3,019 | $1.88 | 43d | 1 | 1.04mi |
| 2578 Pembrook Way Fairfield, CA | 3.0 | 2.0 | 1130 | $2,650 | $2.35 | 43d | 1 | 1.04mi |
| 195 E Pacific Ave Unit 19 Fairfield, CA | 2.0 | 2.0 | 1000 | $1,949 | $1.95 | 13d | 1 | 1.05mi |
| 2124 Santa Ana Dr Fairfield, CA | 2.0 | 1.0 | 1000 | $2,020 | $2.02 | 43d | 1 | 1.13mi |
| 451 Tabor Ave Fairfield, CA | 2.0 | 2.5 | 1269 | $2,500 | $1.97 | 43d | 1 | 1.14mi |
| 362 Tabor Ave Fairfield, CA | 2.0 | 2.5 | 1269 | $2,500 | $1.97 | 23d | 1 | 1.16mi |
| 2217 Santa Fe Ct Fairfield, CA | 3.0 | 2.0 | 1398 | $2,700 | $1.93 | 43d | 1 | 1.21mi |
| 2800 Dover Ave Unit G6 Fairfield, CA | 2.0 | 1.0 | 950 | $2,095 | $2.21 | 23d | 1 | 1.22mi |
| 53 El Basset Ct Fairfield, CA | 2.0 | 1.5 | 997 | $2,100 | $2.11 | 13d | 1 | 1.31mi |
| 1206 Dana Dr Unit 02 Fairfield, CA | 2.0 | 1.5 | 1100 | $1,925 | $1.75 | 43d | 1 | 1.33mi |
| 175 Rogue Ct Fairfield, CA | 2.0 | 2.5 | 1240 | $2,500 | $2.02 | 43d | 1 | 1.35mi |
| 1240 Dana Dr Fairfield, CA | 2.0 | 2.0 | 950 | $1,800 | $1.89 | 43d | 1 | 1.39mi |
| 145 Del Rey Ct Fairfield, CA | 3.0 | 1.5 | 1164 | $2,500 | $2.15 | 13d | 1 | 1.43mi |
| 763 Montecito Ct Fairfield, CA | 3.0 | 3.0 | 1687 | $3,100 | $1.84 | 43d | 1 | 1.48mi |
Listing history 6 events
-
2026-06-18days on market $195,000 Active 7 DOM
-
2026-06-17days on market $195,000 Active 6 DOM
-
2026-06-16days on market $195,000 Active 5 DOM
-
2026-06-15days on market $195,000 Active 4 DOM
-
2026-06-14remarks 683-char remark
-
2026-06-14$195,000 Active 2 DOM
ⓘ Source: listings_history table (triggers on properties + properties_extension) + one-shot
backfill from property_details.listing_events for pre-trigger history.
Climate risk First Street
- Flood 1/10 Low FEMA zone X (unshaded) · 0% chance over 30 yrs
- Wildfire 7/10 Severe
- Heat 5/10 Major 7 d/yr ≥99°F today · 14 d/yr by 30 yrs out
- Wind 1/10 Low
- Air quality 10/10 Extreme 21 unhealthy d/yr today · 22 by 30 yrs out
Nearby sold comps map
Loading sold comps map…
Walkable amenities ~0.75 mi
Loading nearby amenities…
Taxation est. · year 1
- Rental income
- $29,873
- − Mortgage interest
- −$10,923
- − Property taxes
- −$2,925
- − Insurance
- −$975
- − Repairs & maintenance
- −$2,390
- − Management
- −$2,390
- − Depreciation
- −$5,673
- Taxable income
- $4,598
- Est. tax owed @ 24.0%
- −$1,103
- After-tax cash flow
- $6,325/yr
For passive investors: Depreciation is non-cash, so a rental often shows a tax loss while cash-flowing — sheltering income. Rental losses are passive: they offset passive income freely, and up to $25,000/yr can offset ordinary (W-2) income if you actively participate and your MAGI is under $100k (phasing out to $0 by $150k); unused losses carry forward. On sale, claimed depreciation is recaptured at up to 25%, and gains may owe capital-gains tax (a 1031 exchange can defer both). Figures are a year-1 estimate at your 24.0% rate — not tax advice; consult a CPA.
Condition & rehab AI · 13 photos
This move-in ready manufactured home in Casa Nova 55+ community is in good condition with fresh paint and new flooring, making it an attractive option for both resale and rental.
Value-add opportunities
- Resale paint exterior — Fresh paint can enhance curb appeal and home value
- Both update flooring — New flooring can improve both resale and rental value
- Both update kitchen appliances — Modern appliances can attract more buyers and renters
Renovation cost estimate screening
Value-add ROI direction
- Resale paint exterior — Fresh paint can enhance curb appeal and home value ↑
- Both update flooring — New flooring can improve both resale and rental value ↑
- Both update kitchen appliances — Modern appliances can attract more buyers and renters ↑
ⓘ Cost ranges are severity-bucket heuristics (US national rule-of-thumb). Get contractor quotes + a written scope before underwriting a rehab budget.
Schools (NCES district)
- District
- Fairfield-Suisun Unified
- NCES district ID
- 0613360
- Math proficiency
- 23% ▼ -10.00%
- Reading proficiency
- 53% ▲ 8.00%
- Median HH income
- $69,654
- Composite
- 34.59/100
- National rank
- #5157
- State rank
- #238 of 517 in CA
Livability — Fairfield
- Score
- 67/100
- State rank
- #314
- US rank
- #10551
Category grades
Schools grade is shown separately in the Schools card above.
Census & demographics
- Census place
- Fairfield, CA
- County
- Solano County · 433,239 people
- City population
- 120,008
- Metro
- Vallejo, CA
- Population (ZIP)
- 41,203
- Household income
- $140,198
- Rent vs Own
- Severe rent burden
- 803.0
Population outlook (Solano County) Hauer SSP2
- Today (2025)
- 478,685 people
- By 2030
- 497,974 · +4.0%
- By 2040
- 528,515 · +10.4%
- By 2050
- 549,115 · +14.7%
- By 2075
- 587,229 · +22.7%
- By 2100
- 571,378 · +19.4%
Race, ethnicity, and origin ACS 2023
- Neighborhood character
- Highly diverse neighborhood (Simpson 0.76)
- Race & ethnicity
- White 38% Asian 24% Hispanic / Latino 17% Two or more races 14% Black 12% Pacific Islander 2%
- Hispanic origin (detail)
- Mexican 13%
- Common ancestry
- Italian 6% Lithuanian 2% Russian 1%
- Foreign-born
- 20% · Canada, China, South Korea
- Languages at home
- 75% English-only · Spanish 9% Tagalog/Filipino 6% Chinese 3%
Political lean MEDSL · Solano
- 2024 margin
- Strong D (+23.0) · D 60.0% · R 37.1% · Other 2.9%
- 2008→2024 swing
- -5.6pp toward R · 2008: 28.6pp · 2024: 23.0pp
- All cycles
- 2024: D+23.0 2020: D+30.3 2016: D+30.5 2012: D+28.1 2008: D+28.6
Not yet ingested
- Civics
- —
Market trends
- HPI YoY
- ▼ -360.51%
- Current HPI
- 236.509
- Rent YoY
- ▼ -0.35%
- Metro
- Vallejo, CA
- State GDP YoY
- ▲ 3.21%
- F500 in state
- 116
Industry mix (Fortune 500 HQ in CA)
| Industry | F500 HQs | Revenue |
|---|---|---|
| Technology | 27 | $1,492B |
|
||
| Financial Services | 3 | $174B |
|
||
| Retail | 3 | $44B |
|
||
| Insurance | 3 | $26B |
|
||
| Media / Entertainment | 2 | $115B |
|
||
| Pharmaceuticals / Biotech | 2 | $62B |
|
||
Price history
1 event — show timeline
- 2026-06-11 Listed $195,000 bridgeMLS, Bay East AOR, or Contra Costa AOR
Cash-flow waterfall
monthlySold comps — $/sqft
last 12 mo · ≤1 miLoading sold comps…