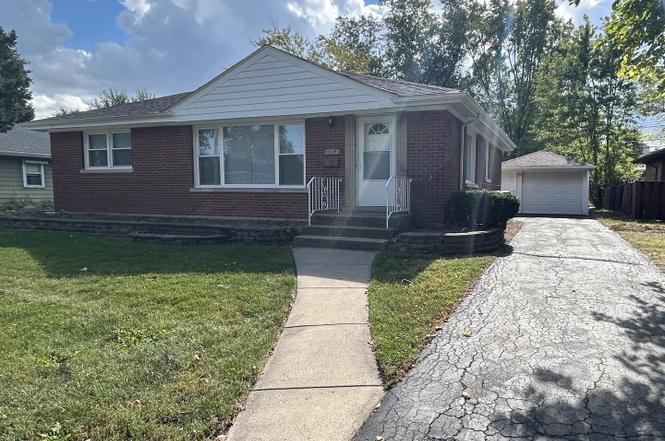
609 E 160th Pl · South Holland, IL
Flood risk 1/10 · Minimal
- FEMA flood zone
- X (unshaded)
- Chance of flooding over 30 yrs
- 0.0%
- Est. flood insurance / yr
- $473 – $860
Fire risk 1/10 · Minimal
- Est. fire insurance / yr
- $804 – $1,492
Heat risk 3/10 · Minor
- Hot days now (above 102°F)
- 7 days/yr
- Hot days in 30 yrs
- 15 days/yr
Wind risk 2/10 · Minimal
- Chance of severe wind over 30 yrs
- —
Air-quality risk 4/10 · Minor
- Unhealthy air days now
- 4 days/yr
- Unhealthy air days in 30 yrs
- 5 days/yr
Risk factors via First Street. Map © Google.
Why this score? — see what drove the D grade
The composite is a weighted blend of 9 inputs, each scored 0–100. Each bar is that input's sub-score; the figure is the points it added to the 100-point composite (weight × sub-score).
- Cash flow +20.5/30.0
- 1% rule +7.6/10.0
- DSCR +6.5/10.0
- Livability +3.9/5.0
- Rent growth +2.5/5.0
- Condition / age +2.5/5.0
- Schools +0.7/10.0
- ARV discount +0.0/15.0
- Appreciation +0.0/10.0
$234,000
🖨 Deal sheet (PDF) 📄 Offer letter ✓ Due diligence
Listing remarks MLS
BRICK RANCH HOME THAT FEATURES 3 BEDROOMS, 1.5 BATHS, FULL BASEMENT, LARGE BACK YARD WHICH IS NICE FOR ENTERTAINING. AND A 1 CAR DETACHED GARAGE. SOLD AS IS. BUYER TO TAKE ON CITY REPAIRS & PUT UP ESCROW IF REQUIRED. NO DISCLOSURES, NO SURVEY OR TERMITE PROVIDED. PRESENT DETAILED PRE-QUAL OR PROOF OF FUNDS WITH OFFER. EM CERTIFIED FUNDS ONLY
Key facts
- Brick ranch home
- Finished basement
- Large back yard
Tags
Property features AI
Finance
- HOA & community: No master association fee required
Exterior
- Parking: Detached garage (1 garage space, 1 total parking space)
- Utilities: Public water; Public sewer
- Home design: Detached single-family home; One-story layout; Fee simple ownership; Rehab completed in 2025; Built before 1978 (71–80 years old); Brick exterior
- Construction: Brick construction
- Exterior features: Lot dimensions approximately 67 x 119; Lot smaller than 0.25 acre
Interior
- Kitchen: Kitchen on main level (14 x 10) with ceramic tile flooring
- Bedrooms: 3 bedrooms (one additional bedroom possible); Basement bedroom (20 x 10); Main-level bedrooms (10 x 10; 11 x 9); Master bedroom on main level (13 x 12) with full bath
- Flooring: Hardwood flooring in living room and master bedroom; Vinyl flooring in basement bedroom and family room; Ceramic tile in kitchen
- Bathrooms: 1 full bathroom; 1 half bathroom
- Heating & cooling: Natural gas forced-air heating
- Interior features: 7 total rooms; Unfinished full basement
- Laundry & utility: Laundry room
Neighborhood map
What this means for you Summary
Snapshot
- This is a 3-bed/1.0-bath single-family listed at $234k.
Deal economics
- At list price, monthly cash flow is $308 ($4k/yr) — positive.
- The deal already cash-flows at list — no discount required.
- Meets the 1% rule at list price ($3k rent vs $234k).
- Recommended offer: $213k (9.0% below list) — sets the bar for market timing.
Location & tenants
- Location reads 77/100 on livability (#167 in IL, #3,071 nationally) — a middle-class / working-renter tenant base. Strengths: commute A+, housing A+, cost of living A; Watch: crime C-, amenities C-.
- Thornton Twp Hsd 205 (suburban): math 7% / reading 8% proficiency, ranked #594 of 620 in IL (top 96%) — low school quality limits family demand, transient renter base, plan for 1-2y turnover.
- Zoned schools: Taft School (364 students, 0% FRL); Coolidge Middle School (math 3% / reading 7%, grade F, #636 of 665 statewide, top 98%, 507 students, 0% FRL); Thornwood High School (math 8% / reading 9%, grade F, #584 of 693 statewide, top 85%, 1,996 students, 0% FRL).
- Market conditions: 135 active listings in the ZIP; 8 comparable units currently listed for rent nearby; rentals leasing fast (median 13d on market — plan ~1-2 weeks tenant-placement turnaround); 6,272 units permitted in Cook County in 2024 (4,658 in 5+ unit buildings).
Forward outlook
- Local home prices are declining (-3.0%/yr); year-one equity from $2k of loan paydown is wiped out by about $7k of value loss. Plan a longer hold.
Negotiation context
- It's been on market 115 days — a 9% lower offer ($213k) is reasonable based on typical stale-listing flexibility.
- 3 sale attempts since 10y ago with the ask held roughly flat each time — persistent listings suggest the price (not the market) is what's stuck; bring a comps-based counter.
- Current owner paid $56k; list at $234k implies a 315% gain — meaningful room to come down on a strong offer.
Risks & watch-outs
- Watch-outs: property tax is 3.6% of price; built in 1955 — expect roof / HVAC / electrical / plumbing capex.
Questions for the listing agent
- It's been on market 115 days. Have you received any prior offers? Is the seller open to a 9% concession, seller financing, or rate buy-down credit?
- Built in 1955 — when were the roof, HVAC, electrical panel, plumbing, and water heater last replaced?
- Property tax is high relative to price — has the assessment been appealed recently, and will the sale trigger a re-assessment?
- Why hasn't it sold? Are there any deal-killer items the seller is aware of (foundation, flood, title, zoning, code violations)?
- Is there a deadline driving the sale (1031 exchange, divorce, estate, relocation)? That informs how much negotiation room exists.
- Schools are D-rated, which usually means shorter tenancies and higher turnover. Who's the typical renter profile here, and what's been the actual vacancy rate?
- The area grade is low — what's the realistic commute time and amenity access for the typical tenant pool here? Any planned neighborhood developments (good or bad) we should know about?
- What's the average days-on-market for RENTAL listings here right now (not sales)? A rising rental-DOM trend means longer vacancies and softer asking-rent achievability than the comps imply.
- What's the recent tenant-quality profile in this submarket — average credit score on applications, eviction rate, late-payment / NSF rate, and stable-employment percentage? A property-management company in the area should have these aggregated.
- How much new for-sale + rental construction is in the pipeline within 1–3 miles? Heavy new supply typically softens prices + rents 12–24 months out; constrained supply supports both.
Investment metrics
- 1% rule
- 1.26% ✓
- Cap rate
- 7.87%
- Cash-on-cash
- 5.64%
- DSCR
- 1.25
- GRM
- 6.6
CMA / ARV
- ARV (on-the-fly)
- $195,712
- Comps found
- 12
Show comp detail 12 sales within ~0.75 mi
| Address | Dist | Beds/Ba | Sqft | Sold | Price | $/sf | Match |
|---|---|---|---|---|---|---|---|
| 735 E 163rd St | 0.33mi | 3/1.0 | 1,064 (-4%) | 0mo | $195,000 | $183 | 77 |
| 823 E 163rd St | 0.39mi | 3/1.0 | 1,184 (+6%) | 1mo | $197,500 | $167 | 70 |
| 15509 Rose Dr | 0.67mi | 2/1.0 (-1) | 1,100 (-1%) | 1mo | $135,000 | $123 | 61 |
| 112 E 160th Pl | 0.67mi | 3/2.0 | 1,141 (+3%) | 2mo | $210,000 | $184 | 59 |
| 944 E 163rd Pl | 0.54mi | 3/2.0 | 1,205 (+8%) | 2mo | $201,000 | $167 | 55 |
| 16417 Claire Ln | 0.51mi | 3/2.5 | 1,209 (+9%) | 2mo | $254,995 | $211 | 54 |
| 16001 Avalon Ave | 0.74mi | 4/2.0 (+1) | 1,136 (+2%) | 1mo | $187,500 | $165 | 52 |
| 15542 S Park Ave | 0.68mi | 4/2.0 (+1) | 1,066 (-4%) | 1mo | $193,900 | $182 | 51 |
| 1006 E 163rd St | 0.53mi | 3/2.0 | 1,263 (+14%) | 1mo | $262,500 | $208 | 48 |
| 15505 Drexel Ave | 0.73mi | 4/2.0 (+1) | 1,200 (+8%) | 2mo | $205,000 | $171 | 42 |
| 15503 Park Ln | 0.69mi | 3/2.0 | 968 (-13%) | 0mo | $170,000 | $176 | 42 |
| 64 E 158th Pl | 0.74mi | 3/2.5 | 1,250 (+12%) | 3mo | $185,000 | $148 | 36 |
Match score weights: distance 35% · size 25% · config 20% · recency 20%. Top-matched comps best support the ARV.
Projected returns pro-forma
-3.0% appreciation · 3.0% rent growth · sell at horizon
- IRR
- -7.4%
- Equity multiple
- 0.72×
- Total profit
- $-18,027
- Equity at exit
- $34,890
- IRR
- 2.3%
- Equity multiple
- 1.16×
- Total profit
- $10,734
- Equity at exit
- $20,232
Cash invested: $65,520 (down + closing). Projections, not guarantees.
Landlord ↔ Tenant lean methodology
- Overall (STATE)
- 43 Moderately Tenant-Leaning
- State Illinois
- 43 Moderately Tenant-Leaning · D+7
- County
- — inherits STATE
- City
- — inherits STATE
ZIP-level market 60473
- Active inventory
- 135
- Price-to-rent
- 6.6×
Monthly cashflow live
- Estimated rent
- $2,953 high interval (Pro) →
- Mortgage (P&I)
- −$1,227
- Tax from tax record
- −$700 /mo · $8,402/yr
- Insurance
- −$98
- HOA
- −$0
- Vacancy / Maint / Mgmt
- −$620
- Net cashflow
- $308
Break-even live
Sensitivity live
| Price | -10% $440 | -5% $374 | +0% $308 | +5% $241 | +10% $175 |
|---|---|---|---|---|---|
| Rent | -10% $74 | -5% $191 | +0% $308 | +5% $424 | +10% $541 |
| Rate | -1.0pp $426 | -0.5pp $367 | base $308 | +0.5pp $247 | +1.0pp $185 |
UW: 25.0% down · 7.5% · 30yr · 1.5% tax · 5.0% vac · 8.0% maint · 8.0% mgmt
Financing live
Cash to close
- Down payment
- $58,500
- Closing costs
- $7,020
- Reserves months
- —
- Total cash needed
- —
Loan-product check · same deal, 3 products live
Conventional
25% down · 7.5% · 30yr
- Down + closing
- —
- Monthly P&I
- —
- Monthly cashflow
- —
- DSCR
- —
- Eligible?
- —
Personal DTI + credit; lowest rate.
DSCR
20% down · 8.5% · 30yr
- Down + closing
- —
- Monthly P&I
- —
- Monthly cashflow
- —
- DSCR
- —
- Eligible?
- —
No personal income docs; deal must DSCR.
Hard money
10% down · 12.0% · 12mo
- Down + closing
- —
- Monthly P&I
- —
- Monthly cashflow
- —
- DSCR
- —
- Eligible?
- —
Short-term bridge; refi at stabilization.
Rent comps 8 comps
| Address | Beds | Baths | Sqft | Rent | $/sqft | DOM | Units | Dist |
|---|---|---|---|---|---|---|---|---|
| 16246 Dobson Ave South Holland, IL | 3.0 | 2.0 | 1250 | $3,170 | $2.54 | 0d | 1 | 0.54mi |
| 15509 Park Ln South Holland, IL | 4.0 | 1.5 | 1200 | $3,400 | $2.83 | 10d | 1 | 0.66mi |
| 15509 Park Ln South Holland, IL | 4.0 | 1.5 | 1200 | $3,400 | $2.83 | 26d | 1 | 0.66mi |
| 16001 Avalon Ave South Holland, IL | 3.0 | 2.0 | 1136 | $3,330 | $2.93 | 8d | 1 | 0.73mi |
| 15238 Doctor Martin Luther King Junior Dr Unit 2W Dolton, IL | 2.0 | 1.0 | 800 | $1,500 | $1.88 | 12d | 1 | 1.00mi |
| 15231 Hastings Dr Dolton, IL | 4.0 | 1.5 | 1487 | $2,146 | $1.44 | 10d | 1 | 1.20mi |
| 14916 Langley Ave Dolton, IL | 3.0 | 1.5 | 1418 | $2,500 | $1.76 | 26d | 1 | 1.36mi |
| 14817 Champlain Ave Dolton, IL | 2.0 | 1.0 | 980 | $2,430 | $2.48 | 24d | 1 | 1.49mi |
Listing history 25 events
-
2026-06-21days on market $234,000 Active 115 DOM
-
2026-06-18days on market $234,000 Active 112 DOM
-
2026-06-17days on market $234,000 Active 111 DOM
-
2026-06-16days on market $234,000 Active 110 DOM
-
2026-06-15days on market $234,000 Active 109 DOM
-
2026-06-13days on market $234,000 Active 107 DOM
-
2026-06-13days on market $234,000 Active 106 DOM
-
2026-06-09days on market $234,000 Active 103 DOM
-
2026-06-08days on market $234,000 Active 102 DOM
-
2026-06-07days on market $234,000 Active 101 DOM
-
2026-06-04days on market $234,000 Active 98 DOM
-
2026-06-03days on market $234,000 Active 97 DOM
-
2026-06-02days on market $234,000 Active 96 DOM
-
2026-06-01days on market $234,000 Active 95 DOM
-
2026-05-31days on market $234,000 Active 94 DOM
-
2026-05-11price $234,000
-
2026-02-26$239,000 Active
-
2026-01-15historical
-
2025-10-17Active
-
2016-09-09soldstatus $56,351 Closed Sale 349-char remark
Show marketing remark (349 chars)
BRICK RANCH HOME THAT FEATURES 3 BEDROOMS, 1.5 BATHS, FULL BASEMENT, LARGE BACK YARD WHICH IS NICE FOR ENTERTAINING. AND A 1 CAR DETACHED GARAGE. SOLD AS IS. BUYER TO TAKE ON CITY REPAIRS & PUT UP ESCROW IF REQUIRED. NO DISCLOSURES, NO SURVEY OR TERMITE PROVIDED. PRESENT DETAILED PRE-QUAL OR PROOF OF FUNDS WITH OFFER. EM CERTIFIED FUNDS ONLY
-
2016-07-19status Pending 349-char remark
Show marketing remark (349 chars)
BRICK RANCH HOME THAT FEATURES 3 BEDROOMS, 1.5 BATHS, FULL BASEMENT, LARGE BACK YARD WHICH IS NICE FOR ENTERTAINING. AND A 1 CAR DETACHED GARAGE. SOLD AS IS. BUYER TO TAKE ON CITY REPAIRS & PUT UP ESCROW IF REQUIRED. NO DISCLOSURES, NO SURVEY OR TERMITE PROVIDED. PRESENT DETAILED PRE-QUAL OR PROOF OF FUNDS WITH OFFER. EM CERTIFIED FUNDS ONLY
-
2016-06-30$41,600 New 349-char remark
Show marketing remark (349 chars)
BRICK RANCH HOME THAT FEATURES 3 BEDROOMS, 1.5 BATHS, FULL BASEMENT, LARGE BACK YARD WHICH IS NICE FOR ENTERTAINING. AND A 1 CAR DETACHED GARAGE. SOLD AS IS. BUYER TO TAKE ON CITY REPAIRS & PUT UP ESCROW IF REQUIRED. NO DISCLOSURES, NO SURVEY OR TERMITE PROVIDED. PRESENT DETAILED PRE-QUAL OR PROOF OF FUNDS WITH OFFER. EM CERTIFIED FUNDS ONLY
-
1999-05-19soldstatus $118,000
-
1993-11-15soldstatus $89,500
-
1989-10-01soldstatus $68,000
ⓘ Source: listings_history table (triggers on properties + properties_extension) + one-shot
backfill from property_details.listing_events for pre-trigger history.
Tax reassessment forecast IL · Partial reset (capped growth)
- Current annual tax
- $8,402 · $700/mo
- Projected year-2 tax
- $8,402 · $700/mo
- Expected delta
- $0/yr ($0/mo · 0.0%)
ⓘ Screening estimate from a state-policy table — verify with the county assessor before closing.
Climate risk First Street
- Flood 1/10 Low FEMA zone X (unshaded) · 0% chance over 30 yrs
- Wildfire 1/10 Low
- Heat 3/10 Moderate 7 d/yr ≥102°F today · 15 d/yr by 30 yrs out
- Wind 2/10 Low
- Air quality 4/10 Moderate 4 unhealthy d/yr today · 5 by 30 yrs out
Nearby sold comps map
Loading sold comps map…
Walkable amenities ~0.75 mi
Loading nearby amenities…
Taxation est. · year 1
- Rental income
- $35,430
- − Mortgage interest
- −$13,108
- − Property taxes
- −$8,402
- − Insurance
- −$1,170
- − Repairs & maintenance
- −$2,834
- − Management
- −$2,834
- − Depreciation
- −$6,807
- Taxable income
- $274
- Est. tax owed @ 24.0%
- −$66
- After-tax cash flow
- $3,626/yr
For passive investors: Depreciation is non-cash, so a rental often shows a tax loss while cash-flowing — sheltering income. Rental losses are passive: they offset passive income freely, and up to $25,000/yr can offset ordinary (W-2) income if you actively participate and your MAGI is under $100k (phasing out to $0 by $150k); unused losses carry forward. On sale, claimed depreciation is recaptured at up to 25%, and gains may owe capital-gains tax (a 1031 exchange can defer both). Figures are a year-1 estimate at your 24.0% rate — not tax advice; consult a CPA.
Schools (NCES district)
- District
- Thornton Twp Hsd 205
- NCES district ID
- 1738970
- Math proficiency
- 7% ▬ 0.00%
- Reading proficiency
- 8% ▼ -2.00%
- Median HH income
- $43,392
- Composite
- 6.92/100
- National rank
- #9976
- State rank
- #594 of 620 in IL
Livability — South Holland
- Score
- 77/100
- State rank
- #167
- US rank
- #3071
Category grades
Schools grade is shown separately in the Schools card above.
Census & demographics
- Census place
- South Holland, IL
- City population
- 21,407
- Population (ZIP)
- 21,407
Population outlook (Cook County) Hauer SSP2
- Today (2025)
- 5,347,519 people
- By 2030
- 5,357,703 · +0.2%
- By 2040
- 5,324,924 · -0.4%
- By 2050
- 5,230,762 · -2.2%
- By 2075
- 4,785,735 · -10.5%
- By 2100
- 4,188,836 · -21.7%
Race, ethnicity, and origin ACS 2023
- Neighborhood character
- Predominantly Black (75%)
- Race & ethnicity
- Black 75% White 10% Hispanic / Latino 10% Two or more races 3% Asian 1%
- Hispanic origin (detail)
- Mexican 9% Puerto Rican 1%
- Common ancestry
- Iranian 3% Romanian 2%
- Foreign-born
- 6% · Canada, China
- Languages at home
- 87% English-only · Spanish 8% Other Asian/Pacific 1% Russian/Polish/Slavic 1%
Political lean MEDSL · Cook
- 2024 margin
- Solid D (+42.0) · D 70.4% · R 28.4% · Other 1.2%
- 2008→2024 swing
- -11.4pp toward R · 2008: 53.4pp · 2024: 42.0pp
- All cycles
- 2024: D+42.0 2020: D+50.3 2016: D+53.0 2012: D+49.4 2008: D+53.4
Not yet ingested
- Civics
- —
Market trends
- HPI YoY
- ▼ -114.36%
- Current HPI
- 201.2479
- Rent YoY
- —
- Metro
- —
- State GDP YoY
- ▲ 1.59%
- F500 in state
- 60
Industry mix (Fortune 500 HQ in IL)
| Industry | F500 HQs | Revenue |
|---|---|---|
| Insurance | 4 | $201B |
|
||
| Consumer Goods | 4 | $87B |
|
||
| Industrial Machinery | 3 | $64B |
|
||
| Healthcare | 2 | $55B |
|
||
| Retail / Pharmacy | 1 | $148B |
|
||
| Agriculture / Food | 1 | $86B |
|
||
Price history
+244.1% since first listed10 events — show timeline
- 2026-05-11 Price Changed $234,000 MRED as Distributed by MLS Grid
- 2026-02-26 Listed $239,000 MRED as Distributed by MLS Grid
- 2026-01-15 Listing Removed — MRED as Distributed by MLS Grid
- 2025-10-17 Listed — MRED as Distributed by MLS Grid
- 2016-09-09 Sold (MLS) $56,351 MRED as Distributed by MLS Grid
- 2016-07-19 Pending — MRED as Distributed by MLS Grid
- 2016-06-30 Listed $41,600 MRED as Distributed by MLS Grid
- 1999-05-19 Sold (Public Records) $118,000 Public Records
- 1993-11-15 Sold (Public Records) $89,500 Public Records
- 1989-10-01 Sold (Public Records) $68,000 Public Records
Property tax history
+7.3%/yrLatest (2023): $8,402 · +40.7% YoY. Source: county tax records.
Cash-flow waterfall
monthlySold comps — $/sqft
last 12 mo · ≤1 miLoading sold comps…