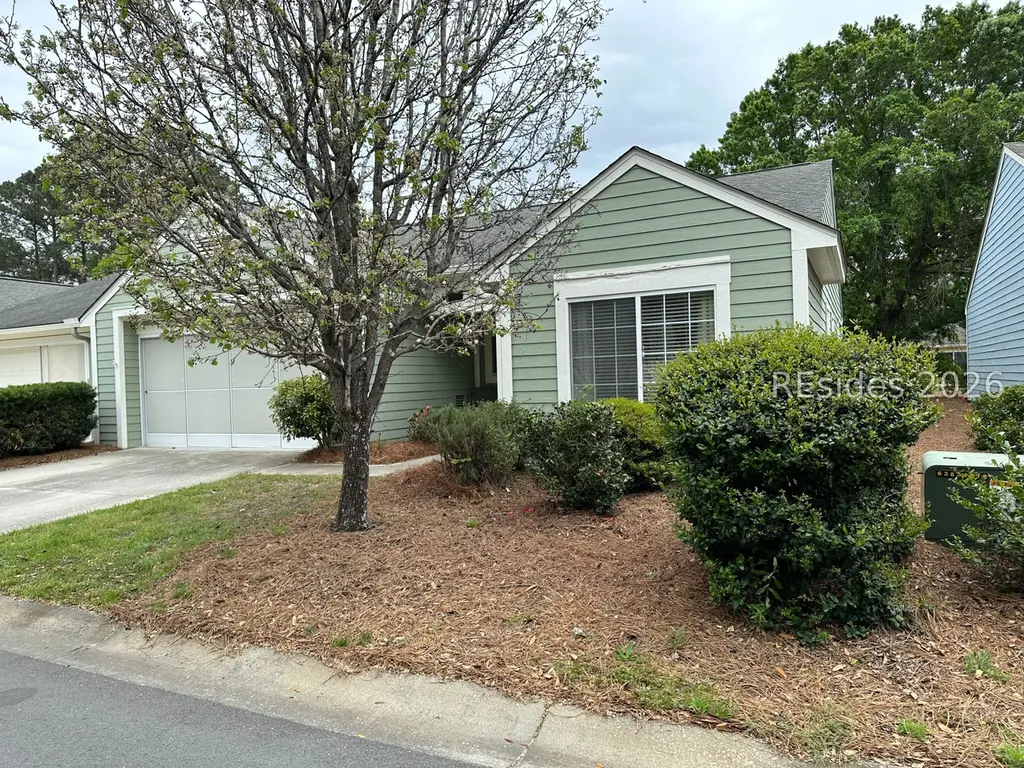
4 Pepper Pl · Hardeeville, SC
Flood risk 1/10 · Minimal
- FEMA flood zone
- X (unshaded)
- Chance of flooding over 30 yrs
- 0.0%
- Est. flood insurance / yr
- $507 – $1,088
Fire risk 1/10 · Minimal
- Est. fire insurance / yr
- $783 – $1,453
Heat risk 9/10 · Severe
- Hot days now (above 107°F)
- 7 days/yr
- Hot days in 30 yrs
- 17 days/yr
Wind risk 8/10 · Major
- Chance of severe wind over 30 yrs
- 99.0%
Air-quality risk 3/10 · Minor
- Unhealthy air days now
- 4 days/yr
- Unhealthy air days in 30 yrs
- 4 days/yr
Risk factors via First Street. Map © Google.
Why this score? — see what drove the C grade
The composite is a weighted blend of 9 inputs, each scored 0–100. Each bar is that input's sub-score; the figure is the points it added to the 100-point composite (weight × sub-score).
- Cash flow +18.8/30.0
- ARV discount +14.1/15.0
- DSCR +5.9/10.0
- Rent growth +4.8/5.0
- Schools +4.1/10.0
- 1% rule +3.8/10.0
- Livability +3.2/5.0
- Condition / age +2.5/5.0
- Appreciation +0.0/10.0
$254,900
🖨 Deal sheet 📄 Offer letter ✓ Due diligence
Listing remarks MLS
Seller iѕ offеring tο рay 1st quаrtеr villa fees with a accерtable Offer by May 31, 2026. Nestled on a quite cul-de-sac, this sunny two bedroom, two bath villa offers both comfort and convenience in an ideal location. Just moments to the Sun City Town Square Amenity Center, you will enjoy the use of an indoor or outdoor pool, state of the art gym, billiards, table tennis, bocce, tennis, theater, various clubs and so much more. You'll enjoy easy access out a convenient side gate to a variety of banks, restaurants, pharmacies, medical offices and a grocery store. A short stroll leads you to beautiful Lake Somerset and its dock- a favorite spot for residents to relax or enjoy catch and release fishing. Whether your looking for an active lifestyle or the peaceful surroundings of the back screened lanai facing a lagoon and mature landscaping or cooking in your updated kitchen with lowered granite countertops and new stove, this home has the perfect balance. A new roof was added in 2024. Smooth ceilings, and crown molding round out the ambiance of this desirable home.
Key facts
- Billiards
- State of the art gym
- Cul-de-sac
Tags
Neighborhood map
What this means for you Summary
Snapshot
- This is a 1-bed/2.0-bath townhouse listed at $255k.
Deal economics
- At list price, monthly cash flow is $255 ($3k/yr) — positive.
- The deal already cash-flows at list — no discount required.
- To meet the 1% rule (rent ≥ 1% of price), the offer needs to be $225k (11.6% below list).
- Recommended offer: $225k (11.6% below list) — sets the bar for 1% rule.
- Cap rate 7.5% vs local median 3.6% in Hardeeville — top-decile yield for the area; either an underpriced asset or a hidden risk that comps aren't pricing in. Stress-test before assuming the spread holds.
Location & tenants
- Location reads 65/100 on livability (#136 in SC) — a middle-class / working-renter tenant base. Strengths: health & safety A+, crime B+, housing B+; Watch: schools F, amenities F, commute F.
- Beaufort 01 (town): math 42% / reading 51% proficiency, ranked #17 of 80 in SC (top 21%) — families likely to look elsewhere, expect single-tenant / working-renter base with shorter leases.
- Market conditions: Rents rising fast (+9.3%/yr); 650 active listings in the ZIP; 4 comparable units currently listed for rent nearby; rentals lingering (median 44d on market — plan ~5-8 weeks vacancy on turnover, expect pricing pressure); 50% of comp listings sitting > 30 days — soft ceiling on asking rent; solid renter incomes; 1,824 units permitted in Beaufort County in 2024 (618 in 5+ unit buildings).
Forward outlook
- Local home prices are declining (-3.0%/yr); year-one equity from $2k of loan paydown is wiped out by about $8k of value loss. Plan a longer hold.
- Beaufort County population projected at +30% by 2050 — long-run rental-demand tailwind backs the buy-and-hold thesis.
- At projected returns (-3.0% appreciation + 8.0% rent growth), your $71k cash investment doubles in ~10 years — after that, you're playing with house money.
Negotiation context
- It's been on market 86 days — a 6% lower offer ($240k) is reasonable based on typical stale-listing flexibility.
- 5 sale attempts since 14y ago with the ask held roughly flat each time — persistent listings suggest the price (not the market) is what's stuck; bring a comps-based counter.
- Current owner paid $210k; 21% above their basis — modest negotiation headroom, anchor on the comps not their cost.
Risks & watch-outs
- Climate carrying-cost: severe wind risk, 99% chance of damaging wind over 30y; extreme-heat days projected 7→17/yr by 2055 (HVAC capex compounding) — expect insurance premiums to compound above CPI over the hold.
Questions for the listing agent
- It's been on market 86 days. Have you received any prior offers? Is the seller open to a 12% concession, seller financing, or rate buy-down credit?
- Why hasn't it sold? Are there any deal-killer items the seller is aware of (foundation, flood, title, zoning, code violations)?
- Is there a deadline driving the sale (1031 exchange, divorce, estate, relocation)? That informs how much negotiation room exists.
- Schools are F-rated, which usually means shorter tenancies and higher turnover. Who's the typical renter profile here, and what's been the actual vacancy rate?
- What's the average days-on-market for RENTAL listings here right now (not sales)? A rising rental-DOM trend means longer vacancies and softer asking-rent achievability than the comps imply.
- What's the recent tenant-quality profile in this submarket — average credit score on applications, eviction rate, late-payment / NSF rate, and stable-employment percentage? A property-management company in the area should have these aggregated.
- How much new for-sale + rental construction is in the pipeline within 1–3 miles? Heavy new supply typically softens prices + rents 12–24 months out; constrained supply supports both.
Investment metrics
- 1% rule
- 0.88% ✗
- Cap rate
- 7.49%
- Cash-on-cash
- 4.28%
- DSCR
- 1.19
- GRM
- 9.4
CMA / ARV
- ARV (median comp)
- $298,839
- List price
- $254,900
- Delta
- -14.70%
- Verdict
- UNDERPRICED
- Comps
- 20 within 1.0 mi
Show comp detail 12 sales within ~0.75 mi
| Address | Dist | Beds/Ba | Sqft | Sold | Price | $/sf | Match |
|---|---|---|---|---|---|---|---|
| 60 Padgett Dr | 0.05mi | 2/2.0 (+1) | 1,089 (+1%) | 7mo | $240,000 | $220 | 86 |
| 16 Huquenin Ln | 0.46mi | 2/2.0 (+1) | 1,089 (+1%) | 10mo | $200,000 | $184 | 64 |
| 30 Zubler St | 0.45mi | 2/2.0 (+1) | 1,053 (-3%) | 7mo | $249,000 | $236 | 64 |
| 8 Purry Cir | 0.41mi | 2/2.0 (+1) | 1,133 (+5%) | 9mo | $275,000 | $243 | 60 |
| 4 Huquenin Ct | 0.44mi | 2/2.0 (+1) | 1,151 (+6%) | 10mo | $260,000 | $226 | 56 |
| 7 Padgett Ct | 0.14mi | 2/2.0 (+1) | 1,240 (+15%) | 12mo | $230,000 | $185 | 54 |
| 36 Padgett Dr | 0.07mi | 2/2.0 (+1) | 1,240 (+15%) | 17mo | $300,000 | $242 | 53 |
| 21 Padgett Ct | 0.18mi | 2/2.0 (+1) | 1,240 (+15%) | 14mo | $299,000 | $241 | 51 |
| 42 Purry Cir | 0.52mi | 2/2.0 (+1) | 1,169 (+8%) | 11mo | $230,000 | $197 | 48 |
| 36 Purry Cir | 0.50mi | 2/2.0 (+1) | 1,210 (+12%) | 9mo | $210,000 | $174 | 44 |
| 53 Zubler St | 0.34mi | 2/2.0 (+1) | 1,210 (+12%) | 19mo | $319,000 | $264 | 43 |
| 42 Zubler St | 0.40mi | 2/2.0 (+1) | 1,210 (+12%) | 20mo | $315,000 | $260 | 40 |
Match score weights: distance 35% · size 25% · config 20% · recency 20%. Top-matched comps best support the ARV.
Projected returns pro-forma
-3.0% appreciation · 8.0% rent growth · sell at horizon
- IRR
- -4.8%
- Equity multiple
- 0.81×
- Total profit
- $-13,289
- Equity at exit
- $38,006
- IRR
- 9.5%
- Equity multiple
- 1.88×
- Total profit
- $63,085
- Equity at exit
- $22,039
Cash invested: $71,372 (down + closing). Projections, not guarantees.
Landlord ↔ Tenant lean methodology
- Overall (STATE)
- 90 Strongly Landlord-Friendly
- State South Carolina
- 90 Strongly Landlord-Friendly · R+6
- County
- — inherits STATE
- City
- — inherits STATE
ZIP-level market 29909
- Home prices YoY
- -12.5%
- Rents YoY
- 9.3%
- Active inventory
- 650
- Price-to-rent
- 9.4×
Monthly cashflow live
- Estimated rent
- $2,255 medium interval (Pro) →
- Mortgage (P&I)
- −$1,337
- Tax from tax record
- −$84 /mo · $1,004/yr
- Insurance
- −$106
- HOA
- −$0
- Vacancy / Maint / Mgmt
- −$473
- Net cashflow
- $255
Break-even live
UW: 25.0% down · 7.5% · 30yr · 1.5% tax · 5.0% vac · 8.0% maint · 8.0% mgmt
Financing live
Cash to close
- Down payment
- $63,725
- Closing costs
- $7,647
- Reserves months
- —
- Total cash needed
- —
Loan-product check · same deal, 3 products live
Conventional
25% down · 7.5% · 30yr
- Down + closing
- —
- Monthly P&I
- —
- Monthly cashflow
- —
- DSCR
- —
- Eligible?
- —
Personal DTI + credit; lowest rate.
DSCR
20% down · 8.5% · 30yr
- Down + closing
- —
- Monthly P&I
- —
- Monthly cashflow
- —
- DSCR
- —
- Eligible?
- —
No personal income docs; deal must DSCR.
Hard money
10% down · 12.0% · 12mo
- Down + closing
- —
- Monthly P&I
- —
- Monthly cashflow
- —
- DSCR
- —
- Eligible?
- —
Short-term bridge; refi at stabilization.
Rent comps 4 comps
| Address | Beds | Baths | Sqft | Rent | $/sqft | DOM | Units | Dist |
|---|---|---|---|---|---|---|---|---|
| 60 Padgett Dr Bluffton, SC | 2.0 | 2.0 | 1089 | $2,300 | $2.11 | 44d | 1 | 0.06mi |
| 61 Zubler St Bluffton, SC | 2.0 | 2.0 | 1053 | $1,970 | $1.87 | 21d | 1 | 0.31mi |
| 55 Purry Cir Bluffton, SC | 2.0 | 2.0 | 1445 | $2,500 | $1.73 | 44d | 1 | 0.52mi |
| 329 Mystic Point Dr Okatie, SC | 2.0 | 2.0 | 1084 | $2,500 | $2.31 | 13d | 1 | 0.81mi |
Listing history 30 events
-
2026-06-18days on market $254,900 Active 86 DOM
-
2026-06-17days on market $254,900 Active 85 DOM
-
2026-06-16days on market $254,900 Active 84 DOM
-
2026-06-15days on market $254,900 Active 83 DOM
-
2026-06-14days on market $254,900 Active 81 DOM
-
2026-06-13days on market $254,900 Active 80 DOM
-
2026-06-10days on market $254,900 Active 78 DOM
-
2026-06-09days on market $254,900 Active 77 DOM
-
2026-06-08days on market $254,900 Active 76 DOM
-
2026-06-07days on market $254,900 Active 75 DOM
-
2026-06-05days on market $254,900 Active 72 DOM
-
2026-06-03days on market $254,900 Active 71 DOM
-
2026-06-02days on market $254,900 Active 70 DOM
-
2026-06-01days on market $254,900 Active 69 DOM
-
2026-05-31days on market $254,900 Active 68 DOM
-
2026-03-24$254,900 Active 1087-char remark
Show marketing remark (1087 chars)
Seller iѕ offеring tο рay 1st quаrtеr villa fees with a accерtable Offer by May 31, 2026. Nestled on a quite cul-de-sac, this sunny two bedroom, two bath villa offers both comfort and convenience in an ideal location. Just moments to the Sun City Town Square Amenity Center, you will enjoy the use of an indoor or outdoor pool, state of the art gym, billiards, table tennis, bocce, tennis, theater, various clubs and so much more. You'll enjoy easy access out a convenient side gate to a variety of banks, restaurants, pharmacies, medical offices and a grocery store. A short stroll leads you to beautiful Lake Somerset and its dock- a favorite spot for residents to relax or enjoy catch and release fishing. Whether your looking for an active lifestyle or the peaceful surroundings of the back screened lanai facing a lagoon and mature landscaping or cooking in your updated kitchen with lowered granite countertops and new stove, this home has the perfect balance. A new roof was added in 2024. Smooth ceilings, and crown molding round out the ambiance of this desirable home.
-
2020-10-21soldstatus $210,000
-
2020-10-15soldstatus $210,000 231-char remark
Show marketing remark (231 chars)
Nicely done Charleston villa in Sun City. Convenient to all amenities!! HVAC is near new, gutter guards, new paint as well as countertops. Relaxing view from the screened lanai with mature landscaping. Extra storage in the garage.
-
2020-08-28$209,000 231-char remark
Show marketing remark (231 chars)
Nicely done Charleston villa in Sun City. Convenient to all amenities!! HVAC is near new, gutter guards, new paint as well as countertops. Relaxing view from the screened lanai with mature landscaping. Extra storage in the garage.
-
2015-12-03soldstatus $161,500
-
2015-12-01soldstatus $161,500
-
2015-12-01soldstatus $161,500
-
2015-06-25$164,900
-
2015-06-15$164,900
-
2013-07-02soldstatus $118,000
-
2013-06-28soldstatus $118,000
-
2012-09-14$123,500
-
2006-03-22soldstatus $172,000
-
1997-07-28soldstatus $110,000
-
1996-10-21soldstatus $115,041
ⓘ Source: listings_history table (triggers on properties + properties_extension) + one-shot
backfill from property_details.listing_events for pre-trigger history.
Tax reassessment forecast SC · Resets to sale price
- Current annual tax
- $1,004 · $84/mo
- Projected year-2 tax
- $1,453 · $121/mo
- Expected delta
- +$449/yr (+$37/mo · 44.7%)
ⓘ Screening estimate from a state-policy table — verify with the county assessor before closing.
Climate risk First Street
- Flood 1/10 Low FEMA zone X (unshaded) · 0% chance over 30 yrs
- Wildfire 1/10 Low
- Heat 9/10 Extreme 7 d/yr ≥107°F today · 17 d/yr by 30 yrs out
- Wind 8/10 Severe 99% chance of damaging wind over 30 yrs
- Air quality 3/10 Moderate 4 unhealthy d/yr today · 4 by 30 yrs out
Nearby sold comps map
Loading sold comps map…
Walkable amenities ~0.75 mi
Loading nearby amenities…
Taxation est. · year 1
- Rental income
- $27,055
- − Mortgage interest
- −$14,278
- − Property taxes
- −$1,004
- − Insurance
- −$1,274
- − Repairs & maintenance
- −$2,164
- − Management
- −$2,164
- − Depreciation
- −$7,415
- Taxable loss
- −$1,246
- Est. tax savings @ 24.0%
- +$299
- After-tax cash flow
- $3,353/yr
For passive investors: Depreciation is non-cash, so a rental often shows a tax loss while cash-flowing — sheltering income. Rental losses are passive: they offset passive income freely, and up to $25,000/yr can offset ordinary (W-2) income if you actively participate and your MAGI is under $100k (phasing out to $0 by $150k); unused losses carry forward. On sale, claimed depreciation is recaptured at up to 25%, and gains may owe capital-gains tax (a 1031 exchange can defer both). Figures are a year-1 estimate at your 24.0% rate — not tax advice; consult a CPA.
Schools (NCES district)
- District
- Beaufort 01
- NCES district ID
- 4501110
- Math proficiency
- 42% ▼ -8.00%
- Reading proficiency
- 51% ▲ 2.00%
- Median HH income
- $57,430
- Composite
- 40.56/100
- National rank
- #3699
- State rank
- #17 of 80 in SC
Livability — Hardeeville
- Score
- 65/100
- State rank
- #136
- US rank
- #13105
Category grades
Schools grade is shown separately in the Schools card above.
Census & demographics
- County
- Beaufort County · 163,770 people
- City population
- 11,373
- Metro
- Hilton Head Island-Bluffton, SC
- Population (ZIP)
- 24,003
- Household income
- $91,294
- Rent vs Own
- Severe rent burden
- 268.0
Population outlook (Beaufort County) Hauer SSP2
- Today (2025)
- 211,915 people
- By 2030
- 227,272 · +7.2%
- By 2040
- 253,861 · +19.8%
- By 2050
- 275,126 · +29.8%
- By 2075
- 311,022 · +46.8%
- By 2100
- 321,286 · +51.6%
Race, ethnicity, and origin ACS 2023
- Neighborhood character
- Predominantly White (89%)
- Race & ethnicity
- White 89% Black 4% Hispanic / Latino 4% Two or more races 3% Asian 1%
- Common ancestry
- Romanian 5% Lithuanian 3% Slovak 2%
- Foreign-born
- 6% · Canada, Vietnam
- Languages at home
- 94% English-only · Spanish 2% Other Indo-European 1%
Political lean MEDSL · Beaufort
- 2024 margin
- R (+14.5) · D 42.1% · R 56.6% · Other 1.2%
- 2008→2024 swing
- -3.7pp toward R · 2008: -10.8pp · 2024: -14.5pp
- All cycles
- 2024: R+14.5 2020: R+10.0 2016: R+14.3 2012: R+17.5 2008: R+10.8
Not yet ingested
- Civics
- —
Market trends
- HPI YoY
- ▼ -27.99%
- Current HPI
- 196.0491
- Rent YoY
- ▲ 9.31%
- Metro
- Hilton Head Island-Bluffton, SC
- State GDP YoY
- ▲ 4.51%
- F500 in state
- 2
Industry mix (Fortune 500 HQ in SC)
| Industry | F500 HQs | Revenue |
|---|---|---|
| Packaging | 1 | $7B |
|
||
Price history
+121.6% since first listed15 events — show timeline
- 2026-03-24 Listed $254,900 RSMLS
- 2020-10-21 Sold (Public Records) $210,000 Public Records
- 2020-10-15 Sold (MLS) $210,000 RSMLS
- 2020-08-28 Listed $209,000 RSMLS
- 2015-12-03 Sold (Public Records) $161,500 Public Records
- 2015-12-01 Sold (MLS) $161,500 RSMLS
- 2015-12-01 Sold (MLS) $161,500 LRMLS
- 2015-06-25 Listed $164,900 LRMLS
- 2015-06-15 Listed $164,900 RSMLS
- 2013-07-02 Sold (Public Records) $118,000 Public Records
- 2013-06-28 Sold (MLS) $118,000 RSMLS
- 2012-09-14 Listed $123,500 RSMLS
- 2006-03-22 Sold (Public Records) $172,000 Public Records
- 1997-07-28 Sold (Public Records) $110,000 Public Records
- 1996-10-21 Sold (Public Records) $115,041 Public Records
Property tax history
-3.9%/yrLatest (2025): $1,004 · -0.1% YoY. Source: county tax records.
Cash-flow waterfall
monthlySold comps — $/sqft
last 12 mo · ≤1 miLoading sold comps…