753 Sunny Dr · Goodrich, TX
Flood risk No data
- FEMA flood zone
- —
- Chance of flooding over 30 yrs
- —
- Est. flood insurance / yr
- —
Fire risk No data
- Est. fire insurance / yr
- —
Heat risk No data
- Hot days now (above threshold)
- —
- Hot days in 30 yrs
- —
Wind risk No data
- Chance of severe wind over 30 yrs
- —
Air-quality risk No data
- Unhealthy air days now
- —
- Unhealthy air days in 30 yrs
- —
Risk factors via First Street. Map © Google.
Why this score? — see what drove the D- grade
The composite is a weighted blend of 9 inputs, each scored 0–100. Each bar is that input's sub-score; the figure is the points it added to the 100-point composite (weight × sub-score).
- Cash flow +12.9/30.0
- ARV discount +6.7/15.0
- Condition / age +4.0/5.0
- DSCR +3.8/10.0
- 1% rule +3.7/10.0
- Schools +3.2/10.0
- Livability +3.0/5.0
- Rent growth +2.5/5.0
- Appreciation +0.0/10.0
$174,500
🖨 Deal sheet 📄 Offer letter ✓ Due diligence
Listing remarks
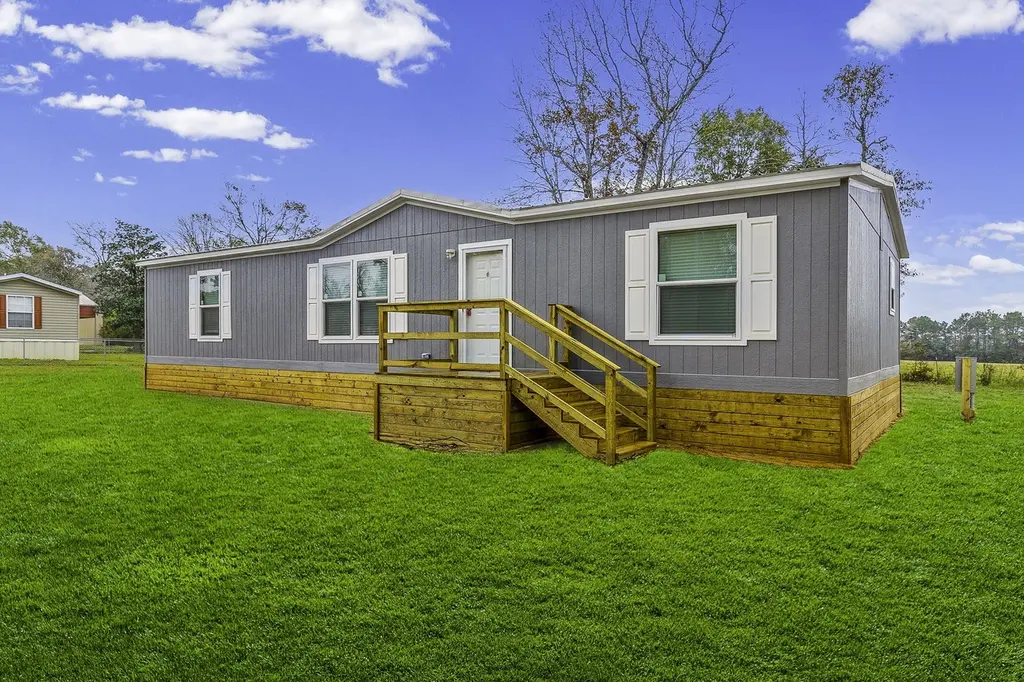
Brand new, never lived in 3BR/2BA manufactured home on 0.35 acres! This 1,500 sq ft home features an open floor plan, bright kitchen with new appliances, spacious primary suite with full bath, and two additional bedrooms. Located in a quiet, family-friendly neighborhood with plenty of outdoor space for play, pets, or gardening. Move-in ready and fully turnkey! Whether you're a first-time buyer, downsizing, or looking for the perfect family home, this property is a must-see
Key facts
- 0.35 acre lot
- Built 2025
- Listed 10 days
Property features AI
Finance
- Other:
- Financial info:
- HOA & community: Forest Springs POA with an annual fee of $50
Exterior
- Parking:
- Security:
- Utilities: Public water; Aerobic septic system
- Home design: Residential property; One-story (single level); 2025 construction
- Construction: Cement siding exterior; Metal roof; Block foundation
- Exterior features: Covered patio; Porch; Patio; Deck; Cleared lot
Interior
- Kitchen: Dishwasher; Electric cooktop; Electric oven; Microwave
- Bedrooms: Three bedrooms total; Primary bedroom on the first floor (approx. 12x15); Two additional bedrooms on the first floor (each approx. 11x11)
- Flooring: Laminate
- Bathrooms: Two full bathrooms
- Heating & cooling: Central heating (electric); Central air (electric)
- Interior features: Washer hookup and electric dryer hookup available; Dishwasher; Electric cooktop and electric oven; Microwave; Laminate flooring; Seller disclosure available
- Laundry & utility: Washer hookup; Electric dryer hookup
Neighborhood map
What this means for you Summary
Snapshot
- This is a 3-bed/2.0-bath manufactured listed at $174k. Condition is rated good.
Deal economics
- At list price, monthly cash flow is $-14 ($-171/yr) — negative.
- To cash-flow at today's rent, offer at most $172k (1.2% below list).
- To meet the 1% rule (rent ≥ 1% of price), the offer needs to be $151k (13.3% below list).
- Recommended offer: $151k (13.3% below list) — sets the bar for 1% rule.
- Cap rate 6.2% vs local median 3.8% in Goodrich — top-decile yield for the area; either an underpriced asset or a hidden risk that comps aren't pricing in. Stress-test before assuming the spread holds.
Location & tenants
- Location reads 60/100 on livability (#1,053 in TX) — a middle-class / working-renter tenant base. Strengths: cost of living A+, housing A+; Watch: employment C-, crime F, amenities F.
- Livingston ISD (rural): math 38% / reading 39% proficiency, ranked #459 of 826 in TX (top 56%) — families likely to look elsewhere, expect single-tenant / working-renter base with shorter leases.
- Zoned schools: Livingston J H (math 30% / reading 32%, grade F, #1,015 of 1,662 statewide, top 62%, 893 students, 62% FRL); Livingston H S (math 35% / reading 46%, grade F, #798 of 1,632 statewide, top 49%, 1,128 students, 51% FRL) — zoned schools at 57% FRL track the district average.
- Market conditions: 1186 active listings in the ZIP; 769 units permitted in Polk County in 2024 (0 in 5+ unit buildings).
Forward outlook
- Local home prices are declining (-3.0%/yr); year-one equity from $1k of loan paydown is wiped out by about $5k of value loss. Plan a longer hold.
- Polk County population projected at +16% by 2050 — long-run rental-demand tailwind backs the buy-and-hold thesis.
Negotiation context
- Only 10 days on market — expect competitive offers; lowballing is unlikely to land.
- 4 sale attempts with the ask held roughly flat each time — persistent listings suggest the price (not the market) is what's stuck; bring a comps-based counter.
Questions for the listing agent
- What do current leases actually rent for vs. the listed asking? Can we see a recent rent roll and the last 12 months of T-12 income?
- What does the HOA fee cover, when was the last increase, and are there any pending special assessments or reserve-fund shortfalls?
- Is there a deadline driving the sale (1031 exchange, divorce, estate, relocation)? That informs how much negotiation room exists.
- Schools are D-rated, which usually means shorter tenancies and higher turnover. Who's the typical renter profile here, and what's been the actual vacancy rate?
- Crime grade is F in this area — have there been break-ins, vandalism, or insurance claims at this property in the last 3 years? What carrier currently insures it and at what premium?
- The area grade is low — what's the realistic commute time and amenity access for the typical tenant pool here? Any planned neighborhood developments (good or bad) we should know about?
- What's the average days-on-market for RENTAL listings here right now (not sales)? A rising rental-DOM trend means longer vacancies and softer asking-rent achievability than the comps imply.
- What's the recent tenant-quality profile in this submarket — average credit score on applications, eviction rate, late-payment / NSF rate, and stable-employment percentage? A property-management company in the area should have these aggregated.
- How much new for-sale + rental construction is in the pipeline within 1–3 miles? Heavy new supply typically softens prices + rents 12–24 months out; constrained supply supports both.
Investment metrics
- 1% rule
- 0.87% ✗
- Cap rate
- 6.19%
- Cash-on-cash
- -0.35%
- DSCR
- 0.98
- GRM
- 9.6
CMA / ARV
- ARV (median comp)
- $171,307
- List price
- $174,500
- Delta
- 5.02%
- Verdict
- FAIR
- Comps
- 5 within 1.0 mi
Show comp detail 4 sales within ~0.75 mi
| Address | Dist | Beds/Ba | Sqft | Sold | Price | $/sf | Match |
|---|---|---|---|---|---|---|---|
| 932 Sunny Dr | 0.18mi | 4/2.0 (+1) | 1,568 (+4%) | 2mo | $179,000 | $114 | 78 |
| 245 Rustic Way | 0.37mi | 4/2.0 (+1) | 1,475 (-2%) | 2mo | $169,999 | $115 | 73 |
| 225 Rustic Way | 0.37mi | 4/2.0 (+1) | 1,475 (-2%) | 11mo | $174,999 | $119 | 66 |
| 650 Wood Hvn | 0.73mi | 4/2.0 (+1) | 1,475 (-2%) | 2mo | $189,000 | $128 | 56 |
Match score weights: distance 35% · size 25% · config 20% · recency 20%. Top-matched comps best support the ARV.
Projected returns pro-forma
-3.0% appreciation · 3.0% rent growth · sell at horizon
- IRR
- -16.9%
- Equity multiple
- 0.40×
- Total profit
- $-29,160
- Equity at exit
- $26,019
- IRR
- -8.7%
- Equity multiple
- 0.46×
- Total profit
- $-26,459
- Equity at exit
- $15,088
Cash invested: $48,860 (down + closing). Projections, not guarantees.
Landlord ↔ Tenant lean methodology
- Overall (STATE)
- 87 Strongly Landlord-Friendly
- State Texas
- 87 Strongly Landlord-Friendly · R+5
- County
- — inherits STATE
- City
- — inherits STATE
ZIP-level market 77351
- Home prices YoY
- -14.8%
- Active inventory
- 1186
- Price-to-rent
- 9.6×
Monthly cashflow live
- Estimated rent
- $1,514 medium interval (Pro) →
- Mortgage (P&I)
- −$915
- Tax est. 1.5%
- −$218 /mo · $2,618/yr
- Insurance
- −$73
- HOA
- −$4
- Vacancy / Maint / Mgmt
- −$318
- Net cashflow
- $-14
Break-even live
UW: 25.0% down · 7.5% · 30yr · 1.5% tax · 5.0% vac · 8.0% maint · 8.0% mgmt
Financing live
Cash to close
- Down payment
- $43,625
- Closing costs
- $5,235
- Reserves months
- —
- Total cash needed
- —
Loan-product check · same deal, 3 products live
Conventional
25% down · 7.5% · 30yr
- Down + closing
- —
- Monthly P&I
- —
- Monthly cashflow
- —
- DSCR
- —
- Eligible?
- —
Personal DTI + credit; lowest rate.
DSCR
20% down · 8.5% · 30yr
- Down + closing
- —
- Monthly P&I
- —
- Monthly cashflow
- —
- DSCR
- —
- Eligible?
- —
No personal income docs; deal must DSCR.
Hard money
10% down · 12.0% · 12mo
- Down + closing
- —
- Monthly P&I
- —
- Monthly cashflow
- —
- DSCR
- —
- Eligible?
- —
Short-term bridge; refi at stabilization.
HOA detail
- Monthly dues
- $4 · $48/yr
Listing history 20 events
-
2026-06-18days on market $174,500 Active 10 DOM
-
2026-06-17days on market $174,500 Active 9 DOM
-
2026-06-16days on market $174,500 Active 8 DOM
-
2026-06-15days on market $174,500 Active 7 DOM
-
2026-06-13days on market $174,500 Active 5 DOM
-
2026-06-08pricedays on market $174,500 Active 1 DOM
-
2026-06-07days on market $179,900 Active 54 DOM
-
2026-06-04days on market $179,900 Active 51 DOM
-
2026-06-03days on market $179,900 Active 50 DOM
-
2026-06-02days on market $179,900 Active 49 DOM
-
2026-06-01days on market $179,900 Active 48 DOM
-
2026-05-31days on market $179,900 Active 47 DOM
-
2026-04-14$179,900 Active 477-char remark
-
2026-03-17status Pending
-
2026-02-25status Pending
-
2026-02-25historical
-
2026-01-16status Active
-
2026-01-15status Pending
-
2026-01-07status Pending
-
2025-12-10$179,900 Active
ⓘ Source: listings_history table (triggers on properties + properties_extension) + one-shot
backfill from property_details.listing_events for pre-trigger history.
Nearby sold comps map
Loading sold comps map…
Walkable amenities ~0.75 mi
Loading nearby amenities…
Taxation est. · year 1
- Rental income
- $18,162
- − Mortgage interest
- −$9,775
- − Property taxes
- −$2,618
- − Insurance
- −$872
- − Repairs & maintenance
- −$1,453
- − Management
- −$1,453
- − HOA
- −$48
- − Depreciation
- −$5,076
- Taxable loss
- −$3,133
- Est. tax savings @ 24.0%
- +$752
- After-tax cash flow
- $581/yr
For passive investors: Depreciation is non-cash, so a rental often shows a tax loss while cash-flowing — sheltering income. Rental losses are passive: they offset passive income freely, and up to $25,000/yr can offset ordinary (W-2) income if you actively participate and your MAGI is under $100k (phasing out to $0 by $150k); unused losses carry forward. On sale, claimed depreciation is recaptured at up to 25%, and gains may owe capital-gains tax (a 1031 exchange can defer both). Figures are a year-1 estimate at your 24.0% rate — not tax advice; consult a CPA.
Condition & rehab AI · 12 photos
This brand new, never lived in 3BR/2BA manufactured home is move-in ready and fully turnkey. It features an open floor plan, bright kitchen with new appliances, and spacious bedrooms. The home is located in a quiet, family-friendly neighborhood with plenty of outdoor space for play, pets, or gardening.
Value-add opportunities
- Both Painting the exterior and interior walls — Fresh paint can enhance curb appeal and interior aesthetics.
- Both Landscaping improvements — Enhanced landscaping can increase curb appeal and property value.
- Both Adding a small outdoor patio or seating area — This can increase the living space and appeal for both resale and rental purposes.
Renovation cost estimate screening
Value-add ROI direction
- Both Painting the exterior and interior walls — Fresh paint can enhance curb appeal and interior aesthetics. ↑
- Both Landscaping improvements — Enhanced landscaping can increase curb appeal and property value. ↑
- Both Adding a small outdoor patio or seating area — This can increase the living space and appeal for both resale and rental purposes. ↑
ⓘ Cost ranges are severity-bucket heuristics (US national rule-of-thumb). Get contractor quotes + a written scope before underwriting a rehab budget.
Schools (NCES district)
- District
- Livingston ISD
- NCES district ID
- 4827780
- Math proficiency
- 38% ▼ -1.00%
- Reading proficiency
- 39% ▲ 3.00%
- Median HH income
- $39,531
- Composite
- 32.25/100
- National rank
- #5767
- State rank
- #459 of 826 in TX
Livability — Goodrich
- Score
- 60/100
- State rank
- #1053
- US rank
- #18692
Category grades
Schools grade is shown separately in the Schools card above.
Census & demographics
- County
- Polk County · 37,143 people
- Metro
- nan
- Population (ZIP)
- 37,143
- Household income
- $66,834
- Rent vs Own
- Severe rent burden
- 608.0
Population outlook (Polk County) Hauer SSP2
- Today (2025)
- 51,049 people
- By 2030
- 53,243 · +4.3%
- By 2040
- 56,528 · +10.7%
- By 2050
- 59,243 · +16.1%
- By 2075
- 63,528 · +24.4%
- By 2100
- 60,376 · +18.3%
Race, ethnicity, and origin ACS 2023
- Neighborhood character
- Predominantly White (72%)
- Race & ethnicity
- White 72% Hispanic / Latino 14% Two or more races 9% Black 8% Native American 2%
- Hispanic origin (detail)
- Mexican 11%
- Common ancestry
- Lithuanian 2% Italian 2% Portuguese 2%
- Foreign-born
- 5% · Canada
- Languages at home
- 88% English-only · Spanish 10%
Political lean MEDSL · Polk
- 2024 margin
- Solid R (+58.9) · D 20.2% · R 79.1%
- 2008→2024 swing
- -21.7pp toward R · 2008: -37.2pp · 2024: -58.9pp
- All cycles
- 2024: R+58.9 2020: R+54.5 2016: R+56.5 2012: R+48.2 2008: R+37.2
Not yet ingested
- Civics
- —
Market trends
- HPI YoY
- ▼ -31.11%
- Current HPI
- 178.5316
- Rent YoY
- —
- Metro
- nan
- State GDP YoY
- ▲ 3.95%
- F500 in state
- 110
Industry mix (Fortune 500 HQ in TX)
| Industry | F500 HQs | Revenue |
|---|---|---|
| Energy | 16 | $1,198B |
|
||
| Technology | 5 | $198B |
|
||
| Engineering / Construction | 4 | $72B |
|
||
| Energy Services | 3 | $60B |
|
||
| Utilities | 3 | $41B |
|
||
| Healthcare | 2 | $330B |
|
||
Price history
-3.0% since first listed10 events — show timeline
- 2026-06-08 Listing Removed — HARMLS
- 2026-06-08 Listed $174,500 HARMLS
- 2026-04-14 Listed $179,900 HARMLS
- 2026-03-17 Pending — HARMLS
- 2026-02-25 Pending — HARMLS
- 2026-02-25 Listing Removed — HARMLS
- 2026-01-16 Relisted — HARMLS
- 2026-01-15 Pending — HARMLS
- 2026-01-07 Pending — HARMLS
- 2025-12-10 Listed $179,900 HARMLS
Cash-flow waterfall
monthlySold comps — $/sqft
last 12 mo · ≤1 miLoading sold comps…