 Multi-family
2025 Van Buren · Eureka Springs, AR
Flood risk No data
- FEMA flood zone
- —
- Chance of flooding over 30 yrs
- —
- Est. flood insurance / yr
- —
Fire risk No data
- Est. fire insurance / yr
- —
Heat risk No data
- Hot days now (above threshold)
- —
- Hot days in 30 yrs
- —
Wind risk No data
- Chance of severe wind over 30 yrs
- —
Air-quality risk No data
- Unhealthy air days now
- —
- Unhealthy air days in 30 yrs
- —
Risk factors via First Street. Map © Google.
Why this score? — see what drove the B grade
The composite is a weighted blend of 9 inputs, each scored 0–100. Each bar is that input's sub-score; the figure is the points it added to the 100-point composite (weight × sub-score).
- Cash flow +30.0/30.0
- 1% rule +10.0/10.0
- DSCR +10.0/10.0
- ARV discount +7.5/15.0
- Appreciation +4.1/10.0
- Condition / age +3.8/5.0
- Schools +3.5/10.0
- Livability +3.4/5.0
- Rent growth +2.5/5.0
$3,095,000
🖨 Deal sheet (PDF) 📄 Offer letter ✓ Due diligence
Multi-family units
County records classify this as Multi-Family (2-4 Unit). Listing-text estimate: 1 unit. estimate disagrees with records
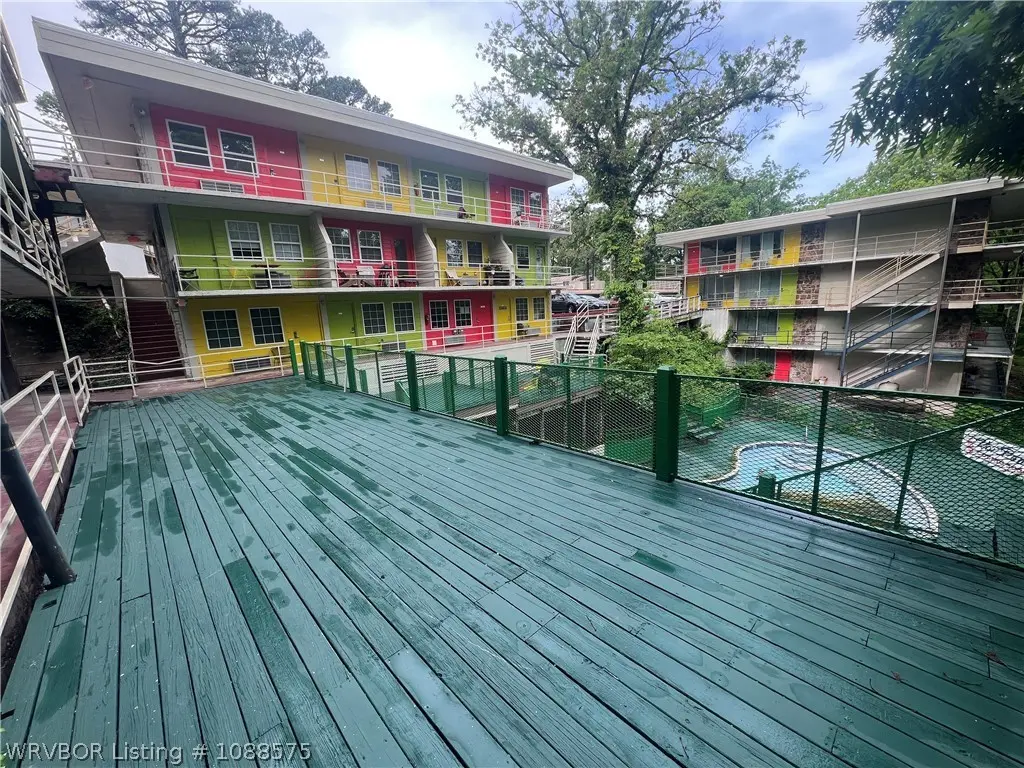
Listing remarks
The Ravine Apartments represents a rare multifamily opportunity in the heart of Eureka Springs, Arkansas — a fully converted, capital-improved residential portfolio comprising 53 units across four buildings at 2025A, 2025B, 2025C, and 2027 East Van Buren Street. Originally operating as a motel, the property has undergone a complete conversion to long- term residential use under the current ownership, with all buildings receiving new roofs, full electrical upgrades, plumbing, and individual PTAC HVAC units. The portfolio delivers a diverse unit mix of studios, one-bedrooms, and two- bedrooms, each equipped with full kitchens including a stove and refrigerator — a meaningful upg
Key facts
- Plumbing
- Diverse unit mix
- New roofs
Tags
Property features AI
Exterior
- Parking: 10 covered parking spaces; Detached carport; Concrete parking areas; Parking lot
- Security: Security system; Fire sprinkler system; Smoke detectors
- Home design: Residential multi-family property; Three or more levels (3 total stories)
- Construction: Block and concrete construction; Block foundation
- Exterior features: City lot; Publicly maintained road access; No fencing; Roof listed as 'Other / See Remarks'
Interior
- Flooring: Concrete
- Heating & cooling: Ductless heating; Electric cooling
- Interior features: Electric water heater; Concrete flooring
- Laundry & utility: No laundry in-unit (none listed)
Neighborhood map
What this means for you Summary
Snapshot
- This is a multifamily listed at $3.10M. Condition is rated good.
Deal economics
- At list price, monthly cash flow is $33k ($397k/yr) — positive.
- The deal already cash-flows at list — no discount required.
- Meets the 1% rule at list price ($69k rent vs $3.10M).
- Recommended offer: $3.00M (3.0% below list) — sets the bar for market timing.
- Cap rate 19.1% vs local median 1.7% in Eureka Springs — top-decile yield for the area; either an underpriced asset or a hidden risk that comps aren't pricing in. Stress-test before assuming the spread holds.
Location & tenants
- Location reads 68/100 on livability (#78 in AR) — a middle-class / working-renter tenant base. Strengths: cost of living A+; Watch: crime C-, health & safety C-, amenities D.
- Eureka Springs School District (rural): math 37% / reading 46% proficiency, ranked #61 of 238 in AR (top 26%) — families likely to look elsewhere, expect single-tenant / working-renter base with shorter leases.
- Market conditions: 200 active listings in the ZIP; 30 units permitted in Carroll County in 2024 (0 in 5+ unit buildings).
Forward outlook
- Local home prices are declining (-1.8%/yr); year-one equity from $21k of loan paydown is wiped out by about $55k of value loss. Plan a longer hold.
- Carroll County population projected at +4% by 2050 — modest demand growth; plan on rents tracking national, not racing it.
- At projected returns (-1.8% appreciation + 3.0% rent growth), your $867k cash investment doubles in ~3 years — after that, you're playing with house money.
Negotiation context
- It's been on market 49 days — a 3% lower offer ($3.00M) is reasonable based on typical stale-listing flexibility.
Questions for the listing agent
- It's been on market 49 days. Have you received any prior offers? Is the seller open to a 3% concession, seller financing, or rate buy-down credit?
- Is there a deadline driving the sale (1031 exchange, divorce, estate, relocation)? That informs how much negotiation room exists.
- Schools are B-rated — typically a magnet for longer-tenancy family renters. What's the average tenant stay here, and is there a school-zone premium baked into asking?
- What's the average days-on-market for RENTAL listings here right now (not sales)? A rising rental-DOM trend means longer vacancies and softer asking-rent achievability than the comps imply.
- What's the recent tenant-quality profile in this submarket — average credit score on applications, eviction rate, late-payment / NSF rate, and stable-employment percentage? A property-management company in the area should have these aggregated.
- How much new apartment / multifamily construction is in the pipeline within 1–3 miles? Heavy new supply (>2% of stock underway) typically softens rents 12–24 months out; light construction supports rent growth.
Investment metrics
- 1% rule
- 2.23% ✓
- Cap rate
- 19.10%
- Cash-on-cash
- 45.75%
- DSCR
- 3.04
- GRM
- 3.7
CMA / ARV
No comps found within radius.
Projected returns pro-forma
-1.79% appreciation · 3.0% rent growth · sell at horizon
- IRR
- 44.6%
- Equity multiple
- 3.04×
- Total profit
- $1,763,856
- Equity at exit
- $631,546
- IRR
- 49.3%
- Equity multiple
- 6.07×
- Total profit
- $4,394,145
- Equity at exit
- $569,037
Cash invested: $866,600 (down + closing). Projections, not guarantees.
Landlord ↔ Tenant lean methodology
- Overall (STATE)
- 92 Strongly Landlord-Friendly
- State Arkansas
- 92 Strongly Landlord-Friendly · R+14
- County
- — inherits STATE
- City
- — inherits STATE
ZIP-level market 72632
- Home prices YoY
- -0.6%
- Active inventory
- 200
- Price-to-rent
- 198.4×
Monthly cashflow live
- Estimated rent
- $68,900 medium interval (Pro) →
- Mortgage (P&I)
- −$16,231
- Tax est. 1.5%
- −$3,869 /mo · $46,425/yr
- Insurance
- −$1,290
- HOA
- −$0
- Vacancy / Maint / Mgmt
- −$14,469
- Net cashflow
- $33,042
Break-even live
Sensitivity live
| Price | -10% $35,181 | -5% $34,112 | +0% $33,042 | +5% $31,973 | +10% $30,903 |
|---|---|---|---|---|---|
| Rent | -10% $27,599 | -5% $30,321 | +0% $33,042 | +5% $35,764 | +10% $38,485 |
| Rate | -1.0pp $34,601 | -0.5pp $33,829 | base $33,042 | +0.5pp $32,240 | +1.0pp $31,424 |
53-unit breakdown (identical units grouped — click to expand)
| Units | Beds | Baths | Est. rent |
|---|---|---|---|
| 53× units | 1 | 1 | $68,900 |
| #1 | 1 | 1 | $1,300 |
| #2 | 1 | 1 | $1,300 |
| #3 | 1 | 1 | $1,300 |
| #4 | 1 | 1 | $1,300 |
| #5 | 1 | 1 | $1,300 |
| #6 | 1 | 1 | $1,300 |
| #7 | 1 | 1 | $1,300 |
| #8 | 1 | 1 | $1,300 |
| #9 | 1 | 1 | $1,300 |
| #10 | 1 | 1 | $1,300 |
| #11 | 1 | 1 | $1,300 |
| #12 | 1 | 1 | $1,300 |
| #13 | 1 | 1 | $1,300 |
| #14 | 1 | 1 | $1,300 |
| #15 | 1 | 1 | $1,300 |
| #16 | 1 | 1 | $1,300 |
| #17 | 1 | 1 | $1,300 |
| #18 | 1 | 1 | $1,300 |
| #19 | 1 | 1 | $1,300 |
| #20 | 1 | 1 | $1,300 |
| #21 | 1 | 1 | $1,300 |
| #22 | 1 | 1 | $1,300 |
| #23 | 1 | 1 | $1,300 |
| #24 | 1 | 1 | $1,300 |
| #25 | 1 | 1 | $1,300 |
| #26 | 1 | 1 | $1,300 |
| #27 | 1 | 1 | $1,300 |
| #28 | 1 | 1 | $1,300 |
| #29 | 1 | 1 | $1,300 |
| #30 | 1 | 1 | $1,300 |
| #31 | 1 | 1 | $1,300 |
| #32 | 1 | 1 | $1,300 |
| #33 | 1 | 1 | $1,300 |
| #34 | 1 | 1 | $1,300 |
| #35 | 1 | 1 | $1,300 |
| #36 | 1 | 1 | $1,300 |
| #37 | 1 | 1 | $1,300 |
| #38 | 1 | 1 | $1,300 |
| #39 | 1 | 1 | $1,300 |
| #40 | 1 | 1 | $1,300 |
| #41 | 1 | 1 | $1,300 |
| #42 | 1 | 1 | $1,300 |
| #43 | 1 | 1 | $1,300 |
| #44 | 1 | 1 | $1,300 |
| #45 | 1 | 1 | $1,300 |
| #46 | 1 | 1 | $1,300 |
| #47 | 1 | 1 | $1,300 |
| #48 | 1 | 1 | $1,300 |
| #49 | 1 | 1 | $1,300 |
| #50 | 1 | 1 | $1,300 |
| #51 | 1 | 1 | $1,300 |
| #52 | 1 | 1 | $1,300 |
| #53 | 1 | 1 | $1,300 |
| Total (53 units) | $68,900 | ||
UW: 25.0% down · 7.5% · 30yr · 1.5% tax · 5.0% vac · 8.0% maint · 8.0% mgmt
Financing live
Cash to close
- Down payment
- $773,750
- Closing costs
- $92,850
- Reserves months
- —
- Total cash needed
- —
Loan-product check · same deal, 3 products live
Conventional
25% down · 7.5% · 30yr
- Down + closing
- —
- Monthly P&I
- —
- Monthly cashflow
- —
- DSCR
- —
- Eligible?
- —
Personal DTI + credit; lowest rate.
DSCR
20% down · 8.5% · 30yr
- Down + closing
- —
- Monthly P&I
- —
- Monthly cashflow
- —
- DSCR
- —
- Eligible?
- —
No personal income docs; deal must DSCR.
Hard money
10% down · 12.0% · 12mo
- Down + closing
- —
- Monthly P&I
- —
- Monthly cashflow
- —
- DSCR
- —
- Eligible?
- —
Short-term bridge; refi at stabilization.
Listing history 16 events
-
2026-06-18days on market $3,095,000 Active 49 DOM
-
2026-06-17days on market $3,095,000 Active 48 DOM
-
2026-06-16days on market $3,095,000 Active 47 DOM
-
2026-06-15days on market $3,095,000 Active 46 DOM
-
2026-06-14days on market $3,095,000 Active 44 DOM
-
2026-06-13days on market $3,095,000 Active 43 DOM
-
2026-06-10days on market $3,095,000 Active 41 DOM
-
2026-06-09days on market $3,095,000 Active 40 DOM
-
2026-06-08days on market $3,095,000 Active 39 DOM
-
2026-06-07days on market $3,095,000 Active 38 DOM
-
2026-06-05days on market $3,095,000 Active 35 DOM
-
2026-06-03days on market $3,095,000 Active 34 DOM
-
2026-06-02days on market $3,095,000 Active 33 DOM
-
2026-06-01days on market $3,095,000 Active 32 DOM
-
2026-05-31days on market $3,095,000 Active 31 DOM
-
2026-04-30$3,095,000 Active 1494-char remark
ⓘ Source: listings_history table (triggers on properties + properties_extension) + one-shot
backfill from property_details.listing_events for pre-trigger history.
Nearby sold comps map
Loading sold comps map…
Walkable amenities ~0.75 mi
Loading nearby amenities…
Taxation est. · year 1
- Rental income
- $826,800
- − Mortgage interest
- −$173,368
- − Property taxes
- −$46,425
- − Insurance
- −$15,475
- − Repairs & maintenance
- −$66,144
- − Management
- −$66,144
- − Depreciation
- −$90,036
- Taxable income
- $369,208
- Est. tax owed @ 24.0%
- −$88,610
- After-tax cash flow
- $307,896/yr
For passive investors: Depreciation is non-cash, so a rental often shows a tax loss while cash-flowing — sheltering income. Rental losses are passive: they offset passive income freely, and up to $25,000/yr can offset ordinary (W-2) income if you actively participate and your MAGI is under $100k (phasing out to $0 by $150k); unused losses carry forward. On sale, claimed depreciation is recaptured at up to 25%, and gains may owe capital-gains tax (a 1031 exchange can defer both). Figures are a year-1 estimate at your 24.0% rate — not tax advice; consult a CPA.
Condition & rehab AI · 14 photos
The property is in good condition with minor repairs needed for painting and landscaping. Painting the exterior and pruning the landscaping will significantly increase its value.
Repairs flagged
- Minor Painting — The exterior walls and siding appear to have some fading paint.
- Minor Landscaping — The landscaping appears to have some overgrown areas.
Value-add opportunities
- Both Painting the exterior walls and siding — Painting the exterior walls and siding will improve the curb appeal and increase the property's value.
- Both Pruning the overgrown landscaping — Pruning the overgrown landscaping will improve the curb appeal and increase the property's value.
Renovation cost estimate screening
| Repair item | Severity | Est. cost |
|---|---|---|
| Painting · The exterior walls and siding appear to have some fading paint. | Minor | $500–3,000 |
| Landscaping · The landscaping appears to have some overgrown areas. | Minor | $500–3,000 |
| Total estimated repair cost · 2 items | $1,000–6,000 |
Value-add ROI direction
- Both Painting the exterior walls and siding — Painting the exterior walls and siding will improve the curb appeal and increase the property's value. ↑
- Both Pruning the overgrown landscaping — Pruning the overgrown landscaping will improve the curb appeal and increase the property's value. ↑
ⓘ Cost ranges are severity-bucket heuristics (US national rule-of-thumb). Get contractor quotes + a written scope before underwriting a rehab budget.
Schools (NCES district)
- District
- Eureka Springs School District
- NCES district ID
- 0505970
- Math proficiency
- 37% ▼ -23.00%
- Reading proficiency
- 46% ▼ -9.00%
- Median HH income
- $37,912
- Composite
- 34.55/100
- National rank
- #5171
- State rank
- #61 of 238 in AR
Livability — Eureka Springs
- Score
- 68/100
- State rank
- #78
- US rank
- #9085
Category grades
Schools grade is shown separately in the Schools card above.
Census & demographics
- Census place
- Eureka Springs, AR
- City population
- 4,550
- Population (ZIP)
- 4,550
Population outlook (Carroll County) Hauer SSP2
- Today (2025)
- 28,014 people
- By 2030
- 28,006 · +-0.0%
- By 2040
- 28,242 · +0.8%
- By 2050
- 29,169 · +4.1%
- By 2075
- 33,935 · +21.1%
- By 2100
- 39,497 · +41.0%
Race, ethnicity, and origin ACS 2023
- Neighborhood character
- Predominantly White (86%)
- Race & ethnicity
- White 86% Two or more races 9% Hispanic / Latino 3% Native American 2%
- Common ancestry
- Italian 3% Slovak 3% Serbian 2%
- Foreign-born
- 2% · Canada
- Languages at home
- 98% English-only · Spanish 1% German/W. Germanic 1%
Political lean MEDSL · Carroll
- 2024 margin
- Solid R (+31.7) · D 33.0% · R 64.7% · Other 2.2%
- 2008→2024 swing
- -13.6pp toward R · 2008: -18.1pp · 2024: -31.7pp
- All cycles
- 2024: R+31.7 2020: R+28.8 2016: R+32.3 2012: R+23.9 2008: R+18.1
Not yet ingested
- Civics
- —
Market trends
- HPI YoY
- ▼ -1.79%
- Current HPI
- 284.3048
- Rent YoY
- —
- Metro
- —
- State GDP YoY
- ▲ 3.80%
- F500 in state
- 10
Industry mix (Fortune 500 HQ in AR)
| Industry | F500 HQs | Revenue |
|---|---|---|
| Retail | 1 | $681B |
|
||
| Food / Agriculture | 1 | $53B |
|
||
| Retail / Energy | 1 | $22B |
|
||
| Transportation / Logistics | 1 | $12B |
|
||
| Energy | 1 | $4B |
|
||
Price history
1 event — show timeline
- 2026-04-30 Listed $3,095,000 WRVBOR
Cash-flow waterfall
monthlySold comps — $/sqft
last 12 mo · ≤1 miLoading sold comps…