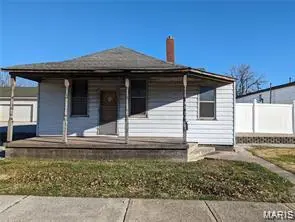
2006 Illinois Ave · Granite City, IL
Flood risk 6/10 · Moderate
- FEMA flood zone
- X
- Chance of flooding over 30 yrs
- 0.72%
- Est. flood insurance / yr
- $473 – $860
Fire risk 1/10 · Minimal
- Est. fire insurance / yr
- $804 – $1,492
Heat risk 6/10 · Moderate
- Hot days now (above 108°F)
- 7 days/yr
- Hot days in 30 yrs
- 21 days/yr
Wind risk 2/10 · Minimal
- Chance of severe wind over 30 yrs
- 1.0%
Air-quality risk 4/10 · Minor
- Unhealthy air days now
- 5 days/yr
- Unhealthy air days in 30 yrs
- 6 days/yr
Risk factors via First Street. Map © Google.
Why this score? — see what drove the B grade
The composite is a weighted blend of 9 inputs, each scored 0–100. Each bar is that input's sub-score; the figure is the points it added to the 100-point composite (weight × sub-score).
- Cash flow +30.0/30.0
- ARV discount +15.0/15.0
- 1% rule +10.0/10.0
- DSCR +10.0/10.0
- Livability +3.2/5.0
- Rent growth +2.9/5.0
- Condition / age +2.5/5.0
- Schools +0.9/10.0
- Appreciation +0.0/10.0
$41,500
🖨 Deal sheet 📄 Offer letter ✓ Due diligence
Listing remarks MLS
INVESTMENT SPECIAL = SELLER FINANCING THIS IS DREAM COME TRUE
Key facts
- 6,250 sq ft lot
- Built 1938
- Listed 89 days
Neighborhood map
What this means for you Summary
Snapshot
- This is a 3-bed/1.0-bath single-family listed at $42k.
Deal economics
- At list price, monthly cash flow is $752 ($9k/yr) — positive.
- The deal already cash-flows at list — no discount required.
- Meets the 1% rule at list price ($1k rent vs $42k).
- Recommended offer: $39k (6.0% below list) — sets the bar for market timing.
- Cap rate 28.0% vs local median 7.0% in Granite City — top-decile yield for the area; either an underpriced asset or a hidden risk that comps aren't pricing in. Stress-test before assuming the spread holds.
Location & tenants
- Location reads 65/100 on livability (#623 in IL) — a middle-class / working-renter tenant base. Strengths: cost of living A+, housing A+; Watch: schools F, crime F, amenities F.
- Granite City CUSD 9 (suburban): math 9% / reading 11% proficiency, ranked #570 of 620 in IL (top 92%) — low school quality limits family demand, transient renter base, plan for 1-2y turnover.
- Market conditions: Rents rising (+1.7%/yr); 194 active listings in the ZIP; 5 comparable units currently listed for rent nearby; rentals at typical pace (median 15d on market — plan ~3-4 weeks tenant-placement turnaround); 336 units permitted in Madison County in 2024 (0 in 5+ unit buildings).
Forward outlook
- Local home prices are declining (-3.0%/yr); year-one equity from $287 of loan paydown is wiped out by about $1k of value loss. Plan a longer hold.
- Madison County population projected at -18% by 2050 — secular population decline; favor cash flow + early exit over multi-decade hold.
- At projected returns (-3.0% appreciation + 1.7% rent growth), your $12k cash investment doubles in ~2 years — after that, you're playing with house money.
Negotiation context
- It's been on market 90 days — a 6% lower offer ($39k) is reasonable based on typical stale-listing flexibility.
- 2 sale attempts since 3y ago with the ask held roughly flat each time — persistent listings suggest the price (not the market) is what's stuck; bring a comps-based counter.
- Current owner paid $32k; 28% above their basis — modest negotiation headroom, anchor on the comps not their cost.
Risks & watch-outs
- Watch-outs: built in 1938 — expect roof / HVAC / electrical / plumbing capex.
- Climate carrying-cost: major flood risk; extreme-heat days projected 7→21/yr by 2055 (HVAC capex compounding) — expect insurance premiums to compound above CPI over the hold.
Questions for the listing agent
- It's been on market 90 days. Have you received any prior offers? Is the seller open to a 6% concession, seller financing, or rate buy-down credit?
- Built in 1938 — when were the roof, HVAC, electrical panel, plumbing, and water heater last replaced?
- Why hasn't it sold? Are there any deal-killer items the seller is aware of (foundation, flood, title, zoning, code violations)?
- Is there a deadline driving the sale (1031 exchange, divorce, estate, relocation)? That informs how much negotiation room exists.
- Schools are F-rated, which usually means shorter tenancies and higher turnover. Who's the typical renter profile here, and what's been the actual vacancy rate?
- Crime grade is F in this area — have there been break-ins, vandalism, or insurance claims at this property in the last 3 years? What carrier currently insures it and at what premium?
- What's the average days-on-market for RENTAL listings here right now (not sales)? A rising rental-DOM trend means longer vacancies and softer asking-rent achievability than the comps imply.
- What's the recent tenant-quality profile in this submarket — average credit score on applications, eviction rate, late-payment / NSF rate, and stable-employment percentage? A property-management company in the area should have these aggregated.
- How much new for-sale + rental construction is in the pipeline within 1–3 miles? Heavy new supply typically softens prices + rents 12–24 months out; constrained supply supports both.
Investment metrics
- 1% rule
- 3.08% ✓
- Cap rate
- 28.03%
- Cash-on-cash
- 77.63%
- DSCR
- 4.45
- GRM
- 2.7
CMA / ARV
- ARV (median comp)
- $53,850
- List price
- $41,500
- Delta
- -22.93%
- Verdict
- UNDERPRICED
- Comps
- 20 within 1.0 mi
Show comp detail 12 sales within ~0.75 mi
| Address | Dist | Beds/Ba | Sqft | Sold | Price | $/sf | Match |
|---|---|---|---|---|---|---|---|
| 2128 Dewey Ave | 0.17mi | 3/1.0 | 1,064 (+1%) | 7mo | $10,000 | $9 | 85 |
| 2235 Dewey Ave | 0.30mi | 3/1.0 | 1,064 (+1%) | 6mo | $25,000 | $23 | 79 |
| 2208 Adams St | 0.40mi | 3/1.0 | 1,096 (+4%) | 5mo | $60,000 | $55 | 70 |
| 2014 Bryan Ave | 0.12mi | 3/1.0 | 940 (-11%) | 9mo | $55,000 | $59 | 69 |
| 2323 Edison Ave | 0.70mi | 3/1.0 | 1,050 (-0%) | 0mo | $99,900 | $95 | 66 |
| 1647 Maple St | 0.66mi | 2/1.0 (-1) | 1,024 (-3%) | 1mo | $10,000 | $10 | 59 |
| 1648 Spruce St | 0.68mi | 2/1.0 (-1) | 1,040 (-1%) | 3mo | $89,000 | $86 | 59 |
| 1027 21st St | 0.31mi | 2/1.0 (-1) | 1,190 (+13%) | 2mo | $17,000 | $14 | 57 |
| 2442 Dewey Ave | 0.47mi | 2/1.0 (-1) | 1,111 (+5%) | 9mo | $65,000 | $59 | 56 |
| 906 24th St | 0.61mi | 3/1.0 | 1,152 (+9%) | 4mo | $82,000 | $71 | 52 |
| 2606 W 20th St | 0.32mi | 2/2.0 (-1) | 1,188 (+13%) | 4mo | $92,000 | $77 | 52 |
| 2246 Edison Ave | 0.64mi | 2/1.0 (-1) | 912 (-14%) | 7mo | $95,000 | $104 | 37 |
Match score weights: distance 35% · size 25% · config 20% · recency 20%. Top-matched comps best support the ARV.
Projected returns pro-forma
-3.0% appreciation · 1.67% rent growth · sell at horizon
- IRR
- 76.2%
- Equity multiple
- 4.40×
- Total profit
- $39,463
- Equity at exit
- $6,188
- IRR
- 79.5%
- Equity multiple
- 8.68×
- Total profit
- $89,270
- Equity at exit
- $3,588
Cash invested: $11,620 (down + closing). Projections, not guarantees.
Landlord ↔ Tenant lean methodology
- Overall (STATE)
- 43 Moderately Tenant-Leaning
- State Illinois
- 43 Moderately Tenant-Leaning · D+7
- County
- — inherits STATE
- City
- — inherits STATE
ZIP-level market 62040
- Home prices YoY
- -21.8%
- Rents YoY
- 1.7%
- Active inventory
- 194
- Price-to-rent
- 2.7×
Monthly cashflow live
- Estimated rent
- $1,279 medium interval (Pro) →
- Mortgage (P&I)
- −$218
- Tax from tax record
- −$24 /mo · $285/yr
- Insurance
- −$17
- HOA
- −$0
- Vacancy / Maint / Mgmt
- −$269
- Net cashflow
- $752
Break-even live
UW: 25.0% down · 7.5% · 30yr · 1.5% tax · 5.0% vac · 8.0% maint · 8.0% mgmt
Financing live
Cash to close
- Down payment
- $10,375
- Closing costs
- $1,245
- Reserves months
- —
- Total cash needed
- —
Loan-product check · same deal, 3 products live
Conventional
25% down · 7.5% · 30yr
- Down + closing
- —
- Monthly P&I
- —
- Monthly cashflow
- —
- DSCR
- —
- Eligible?
- —
Personal DTI + credit; lowest rate.
DSCR
20% down · 8.5% · 30yr
- Down + closing
- —
- Monthly P&I
- —
- Monthly cashflow
- —
- DSCR
- —
- Eligible?
- —
No personal income docs; deal must DSCR.
Hard money
10% down · 12.0% · 12mo
- Down + closing
- —
- Monthly P&I
- —
- Monthly cashflow
- —
- DSCR
- —
- Eligible?
- —
Short-term bridge; refi at stabilization.
Rent comps 5 comps
| Address | Beds | Baths | Sqft | Rent | $/sqft | DOM | Units | Dist |
|---|---|---|---|---|---|---|---|---|
| 2317 Grand Ave Granite City, IL | 2.0 | 1.0 | 1124 | $750 | $0.67 | 7d | 1 | 0.77mi |
| 2450 Cleveland Blvd Apt A Granite City, IL | 2.0 | 1.0 | 846 | $825 | $0.98 | 17d | 1 | 0.79mi |
| 2556 Center St Granite City, IL | 3.0 | 1.0 | 874 | $1,500 | $1.72 | 14d | 1 | 0.89mi |
| 2715 Center St Unit B Granite City, IL | 2.0 | 1.0 | 930 | $1,275 | $1.37 | 43d | 1 | 1.16mi |
| 2415 Jerden Ave Granite City, IL | 3.0 | 1.0 | 970 | $1,400 | $1.44 | 4d | 1 | 1.30mi |
Listing history 20 events
-
2026-06-18days on market $41,500 Active 90 DOM
-
2026-06-17days on market $41,500 Active 89 DOM
-
2026-06-16days on market $41,500 Active 88 DOM
-
2026-06-15days on market $41,500 Active 87 DOM
-
2026-06-13days on market $41,500 Active 85 DOM
-
2026-06-13days on market $41,500 Active 84 DOM
-
2026-06-09days on market $41,500 Active 81 DOM
-
2026-06-08days on market $41,500 Active 80 DOM
-
2026-06-07days on market $41,500 Active 79 DOM
-
2026-06-05days on market $41,500 Active 76 DOM
-
2026-06-03days on market $41,500 Active 75 DOM
-
2026-06-02days on market $41,500 Active 74 DOM
-
2026-06-01days on market $41,500 Active 73 DOM
-
2026-05-31days on market $41,500 Active 72 DOM
-
2026-03-21$41,500 Active 62-char remark
Show marketing remark (62 chars)
INVESTMENT SPECIAL = SELLER FINANCING THIS IS DREAM COME TRUE
-
2026-03-19historical $41,500 62-char remark
Show marketing remark (62 chars)
INVESTMENT SPECIAL = SELLER FINANCING THIS IS DREAM COME TRUE
-
2025-06-30soldstatus $32,333
-
2024-04-25historical
-
2023-12-15$35,000 Active
-
2006-11-03soldstatus $12,000
ⓘ Source: listings_history table (triggers on properties + properties_extension) + one-shot
backfill from property_details.listing_events for pre-trigger history.
Tax reassessment forecast IL · Partial reset (capped growth)
- Current annual tax
- $285 · $24/mo
- Projected year-2 tax
- $614 · $51/mo
- Expected delta
- +$329/yr (+$27/mo · 115.3%)
ⓘ Screening estimate from a state-policy table — verify with the county assessor before closing.
Climate risk First Street
- Flood 6/10 Major FEMA zone X · 72% chance over 30 yrs
- Wildfire 1/10 Low
- Heat 6/10 Major 7 d/yr ≥108°F today · 21 d/yr by 30 yrs out
- Wind 2/10 Low 100% chance of damaging wind over 30 yrs
- Air quality 4/10 Moderate 5 unhealthy d/yr today · 6 by 30 yrs out
Nearby sold comps map
Loading sold comps map…
Walkable amenities ~0.75 mi
Loading nearby amenities…
Taxation est. · year 1
- Rental income
- $15,347
- − Mortgage interest
- −$2,325
- − Property taxes
- −$285
- − Insurance
- −$208
- − Repairs & maintenance
- −$1,228
- − Management
- −$1,228
- − Depreciation
- −$1,207
- Taxable income
- $8,867
- Est. tax owed @ 24.0%
- −$2,128
- After-tax cash flow
- $6,892/yr
For passive investors: Depreciation is non-cash, so a rental often shows a tax loss while cash-flowing — sheltering income. Rental losses are passive: they offset passive income freely, and up to $25,000/yr can offset ordinary (W-2) income if you actively participate and your MAGI is under $100k (phasing out to $0 by $150k); unused losses carry forward. On sale, claimed depreciation is recaptured at up to 25%, and gains may owe capital-gains tax (a 1031 exchange can defer both). Figures are a year-1 estimate at your 24.0% rate — not tax advice; consult a CPA.
Schools (NCES district)
- District
- Granite City CUSD 9
- NCES district ID
- 1717280
- Math proficiency
- 9% ▼ -4.00%
- Reading proficiency
- 11% ▼ -7.00%
- Median HH income
- $45,082
- Composite
- 9.15/100
- National rank
- #9864
- State rank
- #570 of 620 in IL
Livability — Granite City
- Score
- 65/100
- State rank
- #623
- US rank
- #12751
Category grades
Schools grade is shown separately in the Schools card above.
Census & demographics
- Census place
- Granite City, IL
- County
- Madison County · 189,064 people
- City population
- 40,404
- Metro
- St. Louis, MO-IL
- Population (ZIP)
- 40,404
- Household income
- $60,031
- Rent vs Own
- Severe rent burden
- 923.0
Population outlook (Madison County) Hauer SSP2
- Today (2025)
- 258,371 people
- By 2030
- 251,523 · -2.7%
- By 2040
- 233,640 · -9.6%
- By 2050
- 213,042 · -17.5%
- By 2075
- 165,255 · -36.0%
- By 2100
- 123,953 · -52.0%
Race, ethnicity, and origin ACS 2023
- Neighborhood character
- Predominantly White (76%)
- Race & ethnicity
- White 76% Hispanic / Latino 9% Black 9% Two or more races 7% Asian 1%
- Hispanic origin (detail)
- Mexican 7%
- Common ancestry
- Romanian 2% Lithuanian 2% Serbian 2%
- Foreign-born
- 3% · Canada, Vietnam
- Languages at home
- 93% English-only · Spanish 5%
Political lean MEDSL · Madison
- 2024 margin
- R (+13.3) · D 42.5% · R 55.8% · Other 1.8%
- 2008→2024 swing
- -22.5pp toward R · 2008: 9.2pp · 2024: -13.3pp
- All cycles
- 2024: R+13.3 2020: R+13.2 2016: R+15.6 2012: R+1.4 2008: D+9.2
Not yet ingested
- Civics
- —
Market trends
- HPI YoY
- ▼ -56.88%
- Current HPI
- 204.4612
- Rent YoY
- ▲ 1.67%
- Metro
- St. Louis, MO-IL
- State GDP YoY
- ▲ 1.59%
- F500 in state
- 60
Industry mix (Fortune 500 HQ in IL)
| Industry | F500 HQs | Revenue |
|---|---|---|
| Insurance | 4 | $201B |
|
||
| Consumer Goods | 4 | $87B |
|
||
| Industrial Machinery | 3 | $64B |
|
||
| Healthcare | 2 | $55B |
|
||
| Retail / Pharmacy | 1 | $148B |
|
||
| Agriculture / Food | 1 | $86B |
|
||
Price history
+245.8% since first listed6 events — show timeline
- 2026-03-21 Listed $41,500 MARIS as Distributed by MLS Grid
- 2026-03-19 Coming Soon $41,500 MARIS as Distributed by MLS Grid
- 2025-06-30 Sold (Public Records) $32,333 Public Records
- 2024-04-25 Delisted — MARIS as Distributed by MLS Grid
- 2023-12-15 Listed $35,000 MARIS as Distributed by MLS Grid
- 2006-11-03 Sold (Public Records) $12,000 Public Records
Property tax history
-0.8%/yrLatest (2024): $285 · +1.5% YoY. Source: county tax records.
Cash-flow waterfall
monthlySold comps — $/sqft
last 12 mo · ≤1 miLoading sold comps…