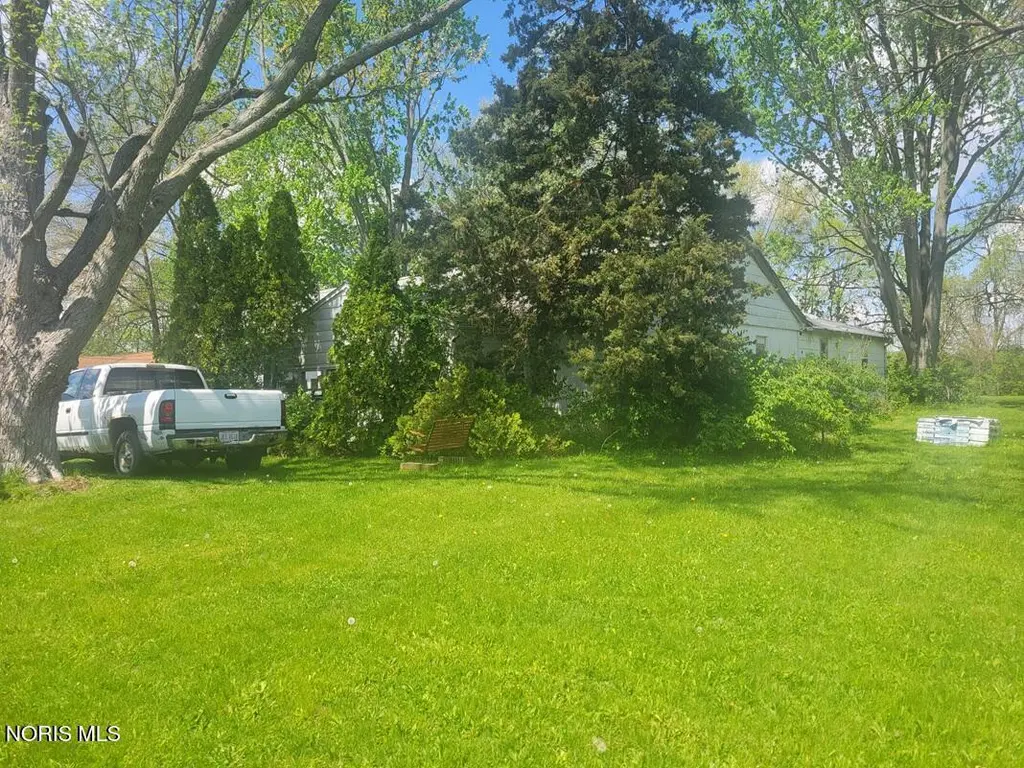
2984 Freyer Rd · Lima, OH
Flood risk 1/10 · Minimal
- FEMA flood zone
- X (unshaded)
- Chance of flooding over 30 yrs
- 0.0%
- Est. flood insurance / yr
- $507 – $1,088
Fire risk 1/10 · Minimal
- Est. fire insurance / yr
- $713 – $1,323
Heat risk 3/10 · Minor
- Hot days now (above 100°F)
- 7 days/yr
- Hot days in 30 yrs
- 18 days/yr
Wind risk 2/10 · Minimal
- Chance of severe wind over 30 yrs
- —
Air-quality risk 2/10 · Minimal
- Unhealthy air days now
- 1 days/yr
- Unhealthy air days in 30 yrs
- 2 days/yr
Risk factors via First Street. Map © Google.
Why this score? — see what drove the A- grade
The composite is a weighted blend of 9 inputs, each scored 0–100. Each bar is that input's sub-score; the figure is the points it added to the 100-point composite (weight × sub-score).
- Cash flow +30.0/30.0
- 1% rule +10.0/10.0
- DSCR +10.0/10.0
- Appreciation +10.0/10.0
- ARV discount +7.5/15.0
- Schools +5.0/10.0
- Livability +3.2/5.0
- Rent growth +2.5/5.0
- Condition / age +2.5/5.0
$110,000
🖨 Deal sheet 📄 Offer letter ✓ Due diligence
Listing remarks MLS
Investment Opportunity - 2984 Freyer Road Unlock the potential at 2984 Freyer Road! This 3-bedroom, 1.5-bath home is ready for your vision and updates. Whether you're looking for a renovation project, rental investment, or a place to customize into your dream home, this property offers plenty of possibilities. Situated on three lots, this unique offering provides added value with potential for future development or new housing opportunities (buyer to verify zoning and approvals). With public water and sewer available, the groundwork is in place for expansion or redevelopment. Properties with this much flexibility are hard to find. Bring your ideas and make the most of this rare chance to invest in space, location, and future potential. Don't miss this chance to turn potential into profit!
Key facts
- Three lots
- 0.92 acre lot
- 2 garage spots
Tags
Property features AI
Exterior
- Parking: Attached garage with 2 parking spaces (total 2)
- Utilities: Electricity connected; Natural gas connected; Public water; Public sewer
- Home design: Single-family house; One story; Not attached; no common walls
- Construction: Wood siding exterior; Block foundation
- Exterior features: Shingle roof; Level lot; City street frontage with asphalt road
Interior
- Kitchen: Refrigerator; Range hood
- Bedrooms: Bedroom 2 on the main level (10 x 11); Bedroom 3 on the main level (10 x 11); Additional main-level bedroom (12 x 12)
- Flooring: Carpet
- Bathrooms: 1 full bathroom; 1 half bathroom
- Heating & cooling: Electric heating; Wall unit(s) for cooling
- Interior features: Eat-in kitchen; 5 total rooms
- Laundry & utility: Washer; Dryer located on the main level
Neighborhood map
What this means for you Summary
Snapshot
- This is a 3-bed/1.5-bath single-family listed at $110k.
Deal economics
- At list price, monthly cash flow is $612 ($7k/yr) — positive.
- The deal already cash-flows at list — no discount required.
- Meets the 1% rule at list price ($2k rent vs $110k).
- Recommended offer: $107k (3.0% below list) — sets the bar for market timing.
- Cap rate 13.0% vs local median 7.7% in Lima — top-decile yield for the area; either an underpriced asset or a hidden risk that comps aren't pricing in. Stress-test before assuming the spread holds.
Location & tenants
- Location reads 64/100 on livability (#787 in OH) — a middle-class / working-renter tenant base. Strengths: cost of living A+, housing A+, health & safety A-; Watch: crime F, amenities F, commute F.
- Elida Local (rural): math 59% / reading 59% proficiency, ranked #311 of 656 in OH (top 47%) — acceptable for families but not a draw, mixed tenant base, ~2y average lease.
- Zoned schools: Elida Elementary (math 73% / reading 61%, grade B+, #456 of 1,584 statewide, top 31%, 1,018 students, 56% FRL); Elida Middle School (math 56% / reading 57%, grade B, #313 of 654 statewide, top 48%, 537 students, 59% FRL); Elida High School (math 47% / reading 62%, grade C-, #303 of 781 statewide, top 42%, 628 students, 42% FRL).
- Market conditions: 53 active listings in the ZIP; 88 units permitted in Allen County in 2024 (0 in 5+ unit buildings).
Forward outlook
- In year one you build about $12k of equity ($761 loan paydown + $11k appreciation (10.0% local appreciation)).
- Allen County population projected at -14% by 2050 — secular population decline; favor cash flow + early exit over multi-decade hold.
- At projected returns (10.0% appreciation + 3.0% rent growth), your $31k cash investment doubles in ~2 years — after that, you're playing with house money.
- By year 4, paydown + projected appreciation supports a ~$42k cash-out refi (75% LTV) — recoverable capital for the next deal without selling this one.
Negotiation context
- It's been on market 50 days — a 3% lower offer ($107k) is reasonable based on typical stale-listing flexibility.
- 2 sale attempts with the ask held roughly flat each time — persistent listings suggest the price (not the market) is what's stuck; bring a comps-based counter.
Risks & watch-outs
- Watch-outs: built in 1953 — expect roof / HVAC / electrical / plumbing capex.
Questions for the listing agent
- It's been on market 50 days. Have you received any prior offers? Is the seller open to a 3% concession, seller financing, or rate buy-down credit?
- Built in 1953 — when were the roof, HVAC, electrical panel, plumbing, and water heater last replaced?
- Is there a deadline driving the sale (1031 exchange, divorce, estate, relocation)? That informs how much negotiation room exists.
- Crime grade is F in this area — have there been break-ins, vandalism, or insurance claims at this property in the last 3 years? What carrier currently insures it and at what premium?
- What's the average days-on-market for RENTAL listings here right now (not sales)? A rising rental-DOM trend means longer vacancies and softer asking-rent achievability than the comps imply.
- What's the recent tenant-quality profile in this submarket — average credit score on applications, eviction rate, late-payment / NSF rate, and stable-employment percentage? A property-management company in the area should have these aggregated.
- How much new for-sale + rental construction is in the pipeline within 1–3 miles? Heavy new supply typically softens prices + rents 12–24 months out; constrained supply supports both.
Investment metrics
- 1% rule
- 1.50% ✓
- Cap rate
- 12.97%
- Cash-on-cash
- 23.84%
- DSCR
- 2.06
- GRM
- 5.6
CMA / ARV
- ARV (median comp)
- $294,137
- List price
- $110,000
- Delta
- -62.60%
- Verdict
- UNDERPRICED
- Comps
- 20 within 1.0 mi
Show comp detail 12 sales within ~0.75 mi
| Address | Dist | Beds/Ba | Sqft | Sold | Price | $/sf | Match |
|---|---|---|---|---|---|---|---|
| 1515 Cessna Ave | 0.15mi | 3/2.0 | 1,504 (-6%) | 4mo | $295,000 | $196 | 78 |
| 3750 Malibu Dr | 0.22mi | 3/2.0 | 1,590 (-1%) | 17mo | $285,000 | $179 | 72 |
| 3701 Cherokee Dr | 0.26mi | 3/2.0 | 1,628 (+2%) | 16mo | $256,200 | $157 | 70 |
| 1558 Chancellor Dr | 0.38mi | 3/2.5 | 1,674 (+4%) | 3mo | $369,000 | $220 | 68 |
| 3680 Sky Hawk Dr | 0.31mi | 3/2.0 | 1,768 (+10%) | 0mo | $373,500 | $211 | 66 |
| 1532 George Bingham Dr | 0.12mi | 3/2.0 | 1,727 (+8%) | 17mo | $262,500 | $152 | 66 |
| 1392 Chancellor Dr | 0.40mi | 3/2.0 | 1,494 (-7%) | 4mo | $270,000 | $181 | 65 |
| 3721 Sky Hawk Dr | 0.26mi | 3/2.0 | 1,804 (+12%) | 8mo | $392,850 | $218 | 59 |
| 3432 Musser Dr | 0.53mi | 3/2.0 | 1,548 (-3%) | 14mo | $224,900 | $145 | 56 |
| 3642 Malibu Dr | 0.32mi | 3/2.0 | 1,772 (+10%) | 19mo | $265,000 | $150 | 50 |
| 4616 Allentown Road Rd | 0.68mi | 3/1.0 | 1,582 (-1%) | 18mo | $160,000 | $101 | 49 |
| 1086 N N. Stevick Road Rd | 0.43mi | 3/1.5 | 1,428 (-11%) | 22mo | $170,900 | $120 | 43 |
Match score weights: distance 35% · size 25% · config 20% · recency 20%. Top-matched comps best support the ARV.
Projected returns pro-forma
10.0% appreciation · 3.0% rent growth · sell at horizon
- IRR
- 42.2%
- Equity multiple
- 4.21×
- Total profit
- $98,857
- Equity at exit
- $99,097
- IRR
- 36.4%
- Equity multiple
- 9.46×
- Total profit
- $260,434
- Equity at exit
- $213,706
Cash invested: $30,800 (down + closing). Projections, not guarantees.
Landlord ↔ Tenant lean methodology
- Overall (STATE)
- 73 Landlord-Friendly
- State Ohio
- 73 Landlord-Friendly · R+6
- County
- — inherits STATE
- City
- — inherits STATE
ZIP-level market 45807
- Home prices YoY
- 8.5%
- Active inventory
- 53
- Price-to-rent
- 5.6×
Monthly cashflow live
- Estimated rent
- $1,645 medium interval (Pro) →
- Mortgage (P&I)
- −$577
- Tax from tax record
- −$65 /mo · $784/yr
- Insurance
- −$46
- HOA
- −$0
- Vacancy / Maint / Mgmt
- −$346
- Net cashflow
- $612
Break-even live
UW: 25.0% down · 7.5% · 30yr · 1.5% tax · 5.0% vac · 8.0% maint · 8.0% mgmt
Financing live
Cash to close
- Down payment
- $27,500
- Closing costs
- $3,300
- Reserves months
- —
- Total cash needed
- —
Loan-product check · same deal, 3 products live
Conventional
25% down · 7.5% · 30yr
- Down + closing
- —
- Monthly P&I
- —
- Monthly cashflow
- —
- DSCR
- —
- Eligible?
- —
Personal DTI + credit; lowest rate.
DSCR
20% down · 8.5% · 30yr
- Down + closing
- —
- Monthly P&I
- —
- Monthly cashflow
- —
- DSCR
- —
- Eligible?
- —
No personal income docs; deal must DSCR.
Hard money
10% down · 12.0% · 12mo
- Down + closing
- —
- Monthly P&I
- —
- Monthly cashflow
- —
- DSCR
- —
- Eligible?
- —
Short-term bridge; refi at stabilization.
Listing history 17 events
-
2026-06-19days on market $110,000 Active 50 DOM
-
2026-06-18days on market $110,000 Active 49 DOM
-
2026-06-17days on market $110,000 Active 48 DOM
-
2026-06-16days on market $110,000 Active 47 DOM
-
2026-06-15days on market $110,000 Active 46 DOM
-
2026-06-14days on market $110,000 Active 44 DOM
-
2026-06-12days on market $110,000 Active 43 DOM
-
2026-06-08days on market $110,000 Active 39 DOM
-
2026-06-07days on market $110,000 Active 38 DOM
-
2026-06-05days on market $110,000 Active 36 DOM
-
2026-06-04days on market $110,000 Active 34 DOM
-
2026-06-02days on market $110,000 Active 33 DOM
-
2026-06-01days on market $110,000 Active 32 DOM
-
2026-05-31days on market $110,000 Active 31 DOM
-
2026-05-31days on market $110,000 Active 30 DOM
-
2026-04-29$110,000 Active 799-char remark
-
2026-04-23$110,000 Active 805-char remark
Show marketing remark (805 chars)
Investment Opportunity - 2984 Freyer Road Unlock the potential at 2984 Freyer Road! This 3-bedroom, 1.5-bath home is ready for your vision and updates. Whether you're looking for a renovation project, rental investment, or a place to customize into your dream home, this property offers plenty of possibilities. Situated on three lots, this unique offering provides added value with potential for future development or new housing opportunities (buyer to verify zoning and approvals). With public water and sewer available, the groundwork is in place for expansion or redevelopment. Properties with this much flexibility are hard to find. Bring your ideas and make the most of this rare chance to invest in space, location, and future potential. Don't miss this chance to turn potential into profit!
ⓘ Source: listings_history table (triggers on properties + properties_extension) + one-shot
backfill from property_details.listing_events for pre-trigger history.
Tax reassessment forecast OH · Partial reset (capped growth)
- Current annual tax
- $784 · $65/mo
- Projected year-2 tax
- $1,250 · $104/mo
- Expected delta
- +$466/yr (+$39/mo · 59.5%)
ⓘ Screening estimate from a state-policy table — verify with the county assessor before closing.
Climate risk First Street
- Flood 1/10 Low FEMA zone X (unshaded) · 0% chance over 30 yrs
- Wildfire 1/10 Low
- Heat 3/10 Moderate 7 d/yr ≥100°F today · 18 d/yr by 30 yrs out
- Wind 2/10 Low
- Air quality 2/10 Low 1 unhealthy d/yr today · 2 by 30 yrs out
Nearby sold comps map
Loading sold comps map…
Walkable amenities ~0.75 mi
Loading nearby amenities…
Taxation est. · year 1
- Rental income
- $19,744
- − Mortgage interest
- −$6,162
- − Property taxes
- −$784
- − Insurance
- −$550
- − Repairs & maintenance
- −$1,580
- − Management
- −$1,580
- − Depreciation
- −$3,200
- Taxable income
- $5,890
- Est. tax owed @ 24.0%
- −$1,414
- After-tax cash flow
- $5,928/yr
For passive investors: Depreciation is non-cash, so a rental often shows a tax loss while cash-flowing — sheltering income. Rental losses are passive: they offset passive income freely, and up to $25,000/yr can offset ordinary (W-2) income if you actively participate and your MAGI is under $100k (phasing out to $0 by $150k); unused losses carry forward. On sale, claimed depreciation is recaptured at up to 25%, and gains may owe capital-gains tax (a 1031 exchange can defer both). Figures are a year-1 estimate at your 24.0% rate — not tax advice; consult a CPA.
Schools (NCES district)
- District
- Elida Local
- NCES district ID
- 3904577
- Math proficiency
- 59% ▼ -11.00%
- Reading proficiency
- 59% ▼ -7.00%
- Median HH income
- $46,632
- Composite
- 49.93/100
- National rank
- #1934
- State rank
- #311 of 656 in OH
Livability — Lima
- Score
- 64/100
- State rank
- #787
- US rank
- #14288
Category grades
Schools grade is shown separately in the Schools card above.
Census & demographics
- County
- Allen · 98,169 people
- City population
- 21,739
- Metro
- Lima, OH
- Population (ZIP)
- 11,631
- Household income
- $74,387
- Rent vs Own
- Severe rent burden
- 6.3
Population outlook (Allen County) Hauer SSP2
- Today (2025)
- 100,321 people
- By 2030
- 97,693 · -2.6%
- By 2040
- 91,802 · -8.5%
- By 2050
- 86,152 · -14.1%
- By 2075
- 73,659 · -26.6%
- By 2100
- 58,716 · -41.5%
Race, ethnicity, and origin ACS 2023
- Neighborhood character
- Predominantly White (90%)
- Race & ethnicity
- White 90% Black 5% Two or more races 4% Hispanic / Latino 2%
- Common ancestry
- Lithuanian 2% Iranian 1% Romanian 1%
- Foreign-born
- 2% · Canada, South Korea
- Languages at home
- 98% English-only · Spanish 1%
Political lean MEDSL · Allen
- 2024 margin
- Solid R (+44.1) · D 27.5% · R 71.6%
- 2008→2024 swing
- -23.4pp toward R · 2008: -20.7pp · 2024: -44.1pp
- All cycles
- 2024: R+44.1 2020: R+39.5 2016: R+38.2 2012: R+25.7 2008: R+20.7
Not yet ingested
- Civics
- —
Market trends
- HPI YoY
- ▲ 36.64%
- Current HPI
- 468.59
- Rent YoY
- —
- Metro
- —
- State GDP YoY
- ▲ 1.98%
- F500 in state
- 48
Industry mix (Fortune 500 HQ in OH)
| Industry | F500 HQs | Revenue |
|---|---|---|
| Insurance | 3 | $145B |
|
||
| Industrial Machinery | 3 | $49B |
|
||
| Financial Services | 3 | $24B |
|
||
| Consumer Goods | 2 | $93B |
|
||
| Aerospace / Defense | 2 | $47B |
|
||
| Utilities | 2 | $33B |
|
||
Price history
+0.0% since first listed2 events — show timeline
- 2026-04-29 Listed $110,000 NORIS
- 2026-04-23 Listed $110,000 WCARE
Property tax history
+0.5%/yrLatest (2025): $784 · -3.7% YoY. Source: county tax records.
Cash-flow waterfall
monthlySold comps — $/sqft
last 12 mo · ≤1 miLoading sold comps…