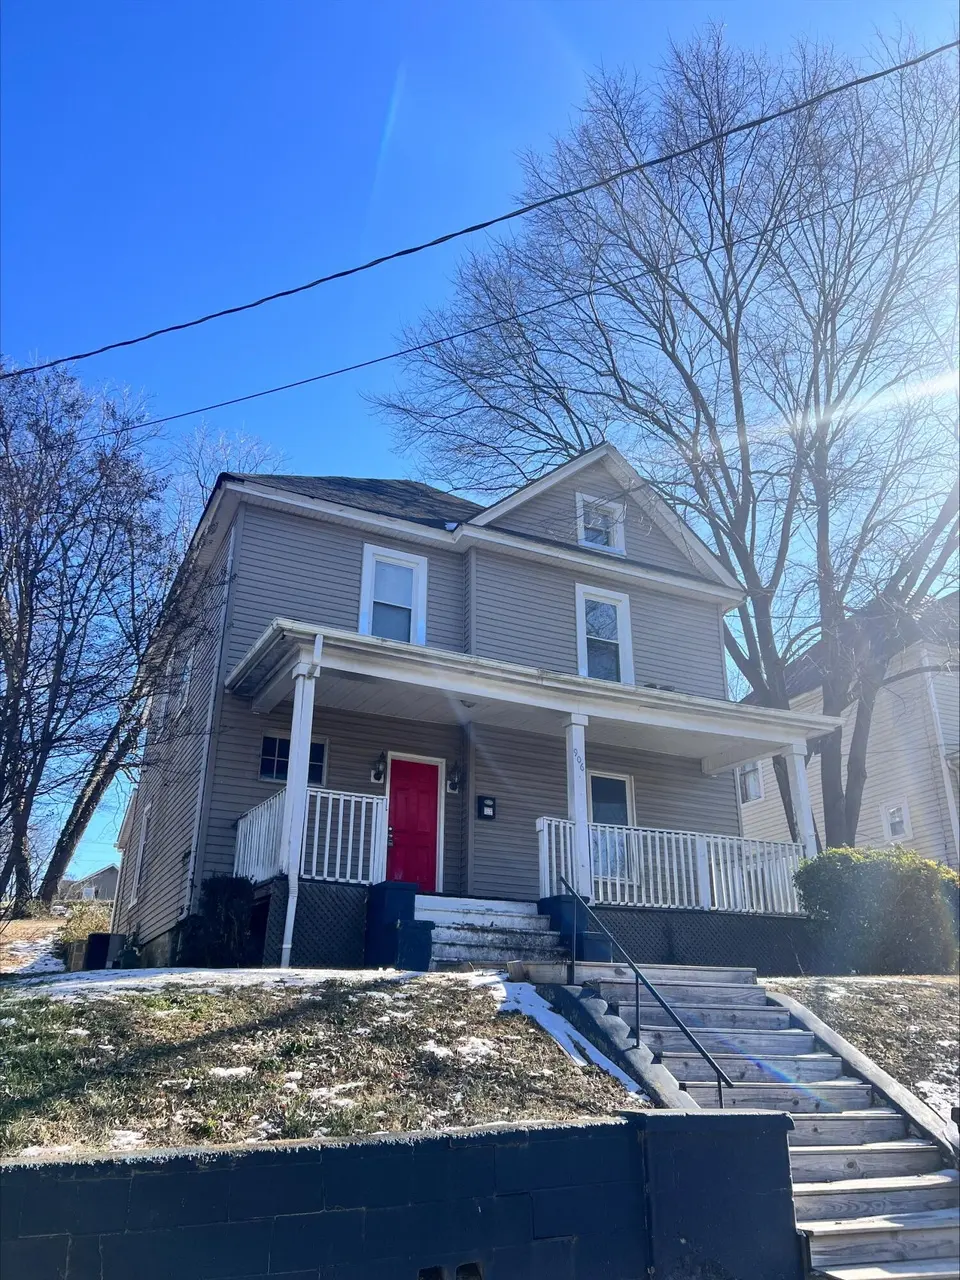
906 5th St SE · Roanoke, VA
Flood risk 1/10 · Minimal
- FEMA flood zone
- X (unshaded)
- Chance of flooding over 30 yrs
- 0.0%
- Est. flood insurance / yr
- $473 – $860
Fire risk 2/10 · Minimal
- Est. fire insurance / yr
- $666 – $1,236
Heat risk 5/10 · Moderate
- Hot days now (above 101°F)
- 7 days/yr
- Hot days in 30 yrs
- 19 days/yr
Wind risk 2/10 · Minimal
- Chance of severe wind over 30 yrs
- 1.0%
Air-quality risk 2/10 · Minimal
- Unhealthy air days now
- 1 days/yr
- Unhealthy air days in 30 yrs
- 1 days/yr
Risk factors via First Street. Map © Google.
Why this score? — see what drove the B+ grade
The composite is a weighted blend of 9 inputs, each scored 0–100. Each bar is that input's sub-score; the figure is the points it added to the 100-point composite (weight × sub-score).
- Cash flow +30.0/30.0
- ARV discount +15.0/15.0
- DSCR +10.0/10.0
- 1% rule +9.3/10.0
- Schools +4.1/10.0
- Livability +3.7/5.0
- Rent growth +2.5/5.0
- Condition / age +2.5/5.0
- Appreciation +0.0/10.0
$141,735
🖨 Deal sheet 📄 Offer letter ✓ Due diligence
Listing remarks
Vacant, text LA for lockbox code.
Key facts
- 9,000 sq ft lot
- Built 1900
- Listed 351 days
Neighborhood map
What this means for you Summary
Snapshot
- This is a 4-bed/2.0-bath single-family listed at $142k.
Deal economics
- At list price, monthly cash flow is $582 ($7k/yr) — positive.
- The deal already cash-flows at list — no discount required.
- Meets the 1% rule at list price ($2k rent vs $142k).
- Recommended offer: $125k (12.0% below list) — sets the bar for market timing.
- Cap rate 11.2% vs local median 4.2% in Roanoke — top-decile yield for the area; either an underpriced asset or a hidden risk that comps aren't pricing in. Stress-test before assuming the spread holds.
Location & tenants
- Location reads 73/100 on livability (#163 in VA) — a middle-class / working-renter tenant base. Strengths: cost of living A+, health & safety A+, housing A; Watch: amenities C-, employment D, crime F.
- Roanoke City Public School District (urban): math 40% / reading 58% proficiency, ranked #102 of 131 in VA (top 78%) — families likely to look elsewhere, expect single-tenant / working-renter base with shorter leases; 67% free/reduced lunch — lower-income household profile, screen leases tightly.
- Market conditions: 77 active listings in the ZIP; 7 comparable units currently listed for rent nearby; rentals lingering (median 44d on market — plan ~5-8 weeks vacancy on turnover, expect pricing pressure); 71% of comp listings sitting > 30 days — soft ceiling on asking rent; 113 units permitted in Roanoke city in 2024 (0 in 5+ unit buildings).
- At $2,020/mo this rent would consume 47% of the median local household income ($51k/yr) (locally 345% of renters already pay >50% of income on rent) — very limited rent-growth headroom before tenants either downsize or default.
Forward outlook
- Local home prices are declining (-3.0%/yr); year-one equity from $980 of loan paydown is wiped out by about $4k of value loss. Plan a longer hold.
- Roanoke County population projected at +11% by 2050 — modest demand growth; plan on rents tracking national, not racing it.
- At projected returns (-3.0% appreciation + 3.0% rent growth), your $40k cash investment doubles in ~7 years — after that, you're playing with house money.
Negotiation context
- It's been on market 351 days — a 12% lower offer ($125k) is reasonable based on typical stale-listing flexibility.
- Current owner paid $95k; 49% above their basis — modest negotiation headroom, anchor on the comps not their cost.
Risks & watch-outs
- Watch-outs: built in 1900 — expect roof / HVAC / electrical / plumbing capex.
- Climate carrying-cost: extreme-heat days projected 7→19/yr by 2055 (HVAC capex compounding) — expect insurance premiums to compound above CPI over the hold.
Questions for the listing agent
- It's been on market 351 days. Have you received any prior offers? Is the seller open to a 12% concession, seller financing, or rate buy-down credit?
- Built in 1900 — when were the roof, HVAC, electrical panel, plumbing, and water heater last replaced?
- Why hasn't it sold? Are there any deal-killer items the seller is aware of (foundation, flood, title, zoning, code violations)?
- Is there a deadline driving the sale (1031 exchange, divorce, estate, relocation)? That informs how much negotiation room exists.
- Schools are A-rated — typically a magnet for longer-tenancy family renters. What's the average tenant stay here, and is there a school-zone premium baked into asking?
- Crime grade is F in this area — have there been break-ins, vandalism, or insurance claims at this property in the last 3 years? What carrier currently insures it and at what premium?
- What's the average days-on-market for RENTAL listings here right now (not sales)? A rising rental-DOM trend means longer vacancies and softer asking-rent achievability than the comps imply.
- What's the recent tenant-quality profile in this submarket — average credit score on applications, eviction rate, late-payment / NSF rate, and stable-employment percentage? A property-management company in the area should have these aggregated.
- How much new for-sale + rental construction is in the pipeline within 1–3 miles? Heavy new supply typically softens prices + rents 12–24 months out; constrained supply supports both.
Investment metrics
- 1% rule
- 1.43% ✓
- Cap rate
- 11.22%
- Cash-on-cash
- 17.60%
- DSCR
- 1.78
- GRM
- 5.8
CMA / ARV
- ARV (median comp)
- $182,282
- List price
- $141,735
- Delta
- -22.24%
- Verdict
- UNDERPRICED
- Comps
- 20 within 1.0 mi
Show comp detail 12 sales within ~0.75 mi
| Address | Dist | Beds/Ba | Sqft | Sold | Price | $/sf | Match |
|---|---|---|---|---|---|---|---|
| 624 Albemarle Ave SE | 0.14mi | 4/2.0 | 1,698 (-13%) | 3mo | $65,000 | $38 | 69 |
| 670 Murray Ave SE | 0.24mi | 3/1.5 (-1) | 2,083 (+7%) | 2mo | $210,000 | $101 | 69 |
| 1008 5th St SE | 0.11mi | 3/1.5 (-1) | 2,170 (+11%) | 5mo | $157,000 | $72 | 65 |
| 1401 Morehead Ave SE | 0.47mi | 4/1.0 | 2,048 (+5%) | 2mo | $185,000 | $90 | 64 |
| 1001 Woodrow Ave SE | 0.65mi | 3/2.0 (-1) | 1,939 (-1%) | 2mo | $234,950 | $121 | 62 |
| 1234 Hamilton Ter SE | 0.55mi | 3/2.0 (-1) | 2,000 (+3%) | 4mo | $245,000 | $123 | 62 |
| 703 Elm Ave SE | 0.24mi | 3/2.0 (-1) | 1,678 (-14%) | 2mo | $169,900 | $101 | 58 |
| 1433 Morehead Ave SE | 0.53mi | 3/1.0 (-1) | 2,000 (+3%) | 6mo | $175,000 | $88 | 57 |
| 620 Riverland Rd SE | 0.57mi | 3/1.0 (-1) | 1,856 (-5%) | 6mo | $130,000 | $70 | 52 |
| 1023 Piedmont St SE | 0.40mi | 3/1.0 (-1) | 2,153 (+10%) | 6mo | $88,000 | $41 | 50 |
| 1506 Maple Ave SW | 0.74mi | 4/1.0 | 1,715 (-12%) | 8mo | $220,000 | $128 | 35 |
| 128 10 1/2 St SE | 0.72mi | 3/1.0 (-1) | 1,657 (-15%) | 6mo | $155,000 | $94 | 28 |
Match score weights: distance 35% · size 25% · config 20% · recency 20%. Top-matched comps best support the ARV.
Projected returns pro-forma
-3.0% appreciation · 3.0% rent growth · sell at horizon
- IRR
- 9.1%
- Equity multiple
- 1.36×
- Total profit
- $14,162
- Equity at exit
- $21,133
- IRR
- 18.3%
- Equity multiple
- 2.52×
- Total profit
- $60,285
- Equity at exit
- $12,255
Cash invested: $39,686 (down + closing). Projections, not guarantees.
Landlord ↔ Tenant lean methodology
- Overall (STATE)
- 55 Moderately Landlord-Leaning
- State Virginia
- 55 Moderately Landlord-Leaning · D+2
- County
- — inherits STATE
- City
- — inherits STATE
ZIP-level market 24013
- Home prices YoY
- -18.0%
- Active inventory
- 77
- Price-to-rent
- 5.8×
Monthly cashflow live
- Estimated rent
- $2,020 high interval (Pro) →
- Mortgage (P&I)
- −$743
- Tax from tax record
- −$212 /mo · $2,540/yr
- Insurance
- −$59
- HOA
- −$0
- Vacancy / Maint / Mgmt
- −$424
- Net cashflow
- $582
Break-even live
UW: 25.0% down · 7.5% · 30yr · 1.5% tax · 5.0% vac · 8.0% maint · 8.0% mgmt
Financing live
Cash to close
- Down payment
- $35,434
- Closing costs
- $4,252
- Reserves months
- —
- Total cash needed
- —
Loan-product check · same deal, 3 products live
Conventional
25% down · 7.5% · 30yr
- Down + closing
- —
- Monthly P&I
- —
- Monthly cashflow
- —
- DSCR
- —
- Eligible?
- —
Personal DTI + credit; lowest rate.
DSCR
20% down · 8.5% · 30yr
- Down + closing
- —
- Monthly P&I
- —
- Monthly cashflow
- —
- DSCR
- —
- Eligible?
- —
No personal income docs; deal must DSCR.
Hard money
10% down · 12.0% · 12mo
- Down + closing
- —
- Monthly P&I
- —
- Monthly cashflow
- —
- DSCR
- —
- Eligible?
- —
Short-term bridge; refi at stabilization.
Rent comps 7 comps
| Address | Beds | Baths | Sqft | Rent | $/sqft | DOM | Units | Dist |
|---|---|---|---|---|---|---|---|---|
| 606 Riverland Rd SE Unit Roanoke Roanoke, VA | 3.0 | 2.0 | 2300 | $1,950 | $0.85 | 43d | 1 | 0.55mi |
| 770 Riverland Rd SE Unit A Roanoke, VA | 4.0 | 3.0 | 2400 | $3,200 | $1.33 | 43d | 1 | 0.75mi |
| 909 13th St SE Roanoke, VA | 3.0 | 1.0 | 1870 | $1,199 | $0.64 | 43d | 1 | 0.81mi |
| 1817 Dale Ave SE Roanoke, VA | 3.0 | 1.0 | 1820 | $2,100 | $1.15 | 43d | 1 | 1.08mi |
| 119 18th St SE Roanoke, VA | 4.0 | 2.0 | 2104 | $1,500 | $0.71 | 13d | 1 | 1.21mi |
| 1 23rd St SW #9 Roanoke, VA | 3.0 | 2.0 | 1961 | $2,150 | $1.10 | 21d | 1 | 1.37mi |
| 1017 Ferdinand Ave SW Roanoke, VA | 4.0 | 2.5 | 2248 | $1,795 | $0.80 | 43d | 1 | 1.40mi |
Listing history 15 events
-
2026-06-03statusdays on market $141,735 Pending 351 DOM
-
2026-06-02days on market $141,735 Active 350 DOM
-
2026-06-01days on market $141,735 Active 349 DOM
-
2026-05-31days on market $141,735 Active 348 DOM
-
2026-05-30days on market $141,735 Active 347 DOM
-
2026-02-05price $141,735
-
2026-01-05price $144,627
-
2025-11-12price $147,579
-
2025-10-08price $150,591
-
2025-09-03price $153,664
-
2025-08-08price $156,800
-
2025-06-17$160,000 Active
-
2015-03-26soldstatus $95,000
-
2007-02-27soldstatus $42,600
-
2007-02-27soldstatus $42,600
ⓘ Source: listings_history table (triggers on properties + properties_extension) + one-shot
backfill from property_details.listing_events for pre-trigger history.
Tax reassessment forecast VA · Resets to sale price
- Current annual tax
- $2,540 · $212/mo
- Projected year-2 tax
- $2,540 · $212/mo
- Expected delta
- $0/yr ($0/mo · 0.0%)
ⓘ Screening estimate from a state-policy table — verify with the county assessor before closing.
Climate risk First Street
- Flood 1/10 Low FEMA zone X (unshaded) · 0% chance over 30 yrs
- Wildfire 2/10 Low
- Heat 5/10 Major 7 d/yr ≥101°F today · 19 d/yr by 30 yrs out
- Wind 2/10 Low 100% chance of damaging wind over 30 yrs
- Air quality 2/10 Low 1 unhealthy d/yr today · 1 by 30 yrs out
Nearby sold comps map
Loading sold comps map…
Walkable amenities ~0.75 mi
Loading nearby amenities…
Taxation est. · year 1
- Rental income
- $24,245
- − Mortgage interest
- −$7,939
- − Property taxes
- −$2,540
- − Insurance
- −$709
- − Repairs & maintenance
- −$1,940
- − Management
- −$1,940
- − Depreciation
- −$4,123
- Taxable income
- $5,055
- Est. tax owed @ 24.0%
- −$1,213
- After-tax cash flow
- $5,773/yr
For passive investors: Depreciation is non-cash, so a rental often shows a tax loss while cash-flowing — sheltering income. Rental losses are passive: they offset passive income freely, and up to $25,000/yr can offset ordinary (W-2) income if you actively participate and your MAGI is under $100k (phasing out to $0 by $150k); unused losses carry forward. On sale, claimed depreciation is recaptured at up to 25%, and gains may owe capital-gains tax (a 1031 exchange can defer both). Figures are a year-1 estimate at your 24.0% rate — not tax advice; consult a CPA.
Schools (NCES district)
- District
- Roanoke City Public School District
- NCES district ID
- 5103300
- Math proficiency
- 40% ▼ -38.00%
- Reading proficiency
- 58% ▼ -12.00%
- Median HH income
- $38,592
- Composite
- 40.8/100
- National rank
- #3639
- State rank
- #102 of 131 in VA
Livability — Roanoke
- Score
- 73/100
- State rank
- #163
- US rank
- #5055
Category grades
Schools grade is shown separately in the Schools card above.
Census & demographics
- Census place
- Roanoke, VA
- County
- Roanoke City · 101,625 people
- City population
- 168,930
- Metro
- Roanoke, VA
- Population (ZIP)
- 8,026
- Household income
- $51,290
- Rent vs Own
- Severe rent burden
- 345.0
Population outlook (Roanoke County) Hauer SSP2
- Today (2025)
- 106,094 people
- By 2030
- 108,927 · +2.7%
- By 2040
- 114,104 · +7.5%
- By 2050
- 118,032 · +11.3%
- By 2075
- 123,363 · +16.3%
- By 2100
- 116,827 · +10.1%
Race, ethnicity, and origin ACS 2023
- Neighborhood character
- Diverse neighborhood (Simpson 0.59)
- Race & ethnicity
- White 57% Black 29% Two or more races 9% Hispanic / Latino 7%
- Hispanic origin (detail)
- Mexican 4% Puerto Rican 1% Cuban 2%
- Common ancestry
- Slovak 2% Greek 1% German 1%
- Foreign-born
- 3% · Canada
- Languages at home
- 93% English-only · Spanish 6% Vietnamese 1%
Political lean MEDSL · Roanoke
- 2024 margin
- Strong D (+23.6) · D 61.1% · R 37.5% · Other 1.4%
- 2008→2024 swing
- +0.2pp no change · 2008: 23.4pp · 2024: 23.6pp
- All cycles
- 2024: D+23.6 2020: D+25.8 2016: D+17.6 2012: D+21.5 2008: D+23.4
Not yet ingested
- Civics
- —
Market trends
- HPI YoY
- ▼ -49.00%
- Current HPI
- 223.42
- Rent YoY
- —
- Metro
- Roanoke, VA
- State GDP YoY
- ▲ 2.40%
- F500 in state
- 50
Industry mix (Fortune 500 HQ in VA)
| Industry | F500 HQs | Revenue |
|---|---|---|
| Aerospace / Defense | 4 | $236B |
|
||
| Technology / Defense | 3 | $32B |
|
||
| Financial Services | 2 | $176B |
|
||
| Utilities | 2 | $27B |
|
||
| Insurance | 2 | $25B |
|
||
| Technology | 2 | $15B |
|
||
Price history
+232.7% since first listed10 events — show timeline
- 2026-02-05 Price Changed $141,735 MLSRV
- 2026-01-05 Price Changed $144,627 MLSRV
- 2025-11-12 Price Changed $147,579 MLSRV
- 2025-10-08 Price Changed $150,591 MLSRV
- 2025-09-03 Price Changed $153,664 MLSRV
- 2025-08-08 Price Changed $156,800 MLSRV
- 2025-06-17 Listed $160,000 MLSRV
- 2015-03-26 Sold (Public Records) $95,000 Public Records
- 2007-02-27 Sold (Public Records) $42,600 Public Records
- 2007-02-27 Sold (Public Records) $42,600 Public Records
Property tax history
+14.3%/yrLatest (2025): $2,540 · +20.7% YoY. Source: county tax records.
Cash-flow waterfall
monthlySold comps — $/sqft
last 12 mo · ≤1 miLoading sold comps…