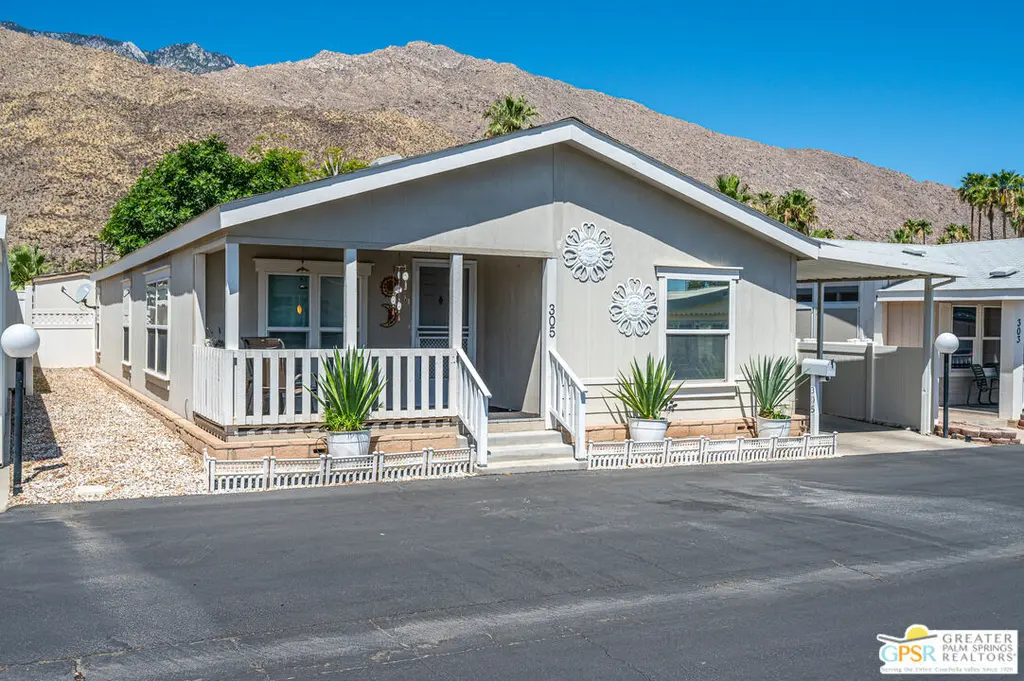
305 Kona Ln · Palm Springs, CA
Flood risk 1/10 · Minimal
- FEMA flood zone
- X (shaded)
- Chance of flooding over 30 yrs
- 0.0%
- Est. flood insurance / yr
- $507 – $1,088
Fire risk 5/10 · Moderate
- Est. fire insurance / yr
- $659 – $1,223
Heat risk 9/10 · Severe
- Hot days now (above 110°F)
- 9 days/yr
- Hot days in 30 yrs
- 27 days/yr
Wind risk 1/10 · Minimal
- Chance of severe wind over 30 yrs
- —
Air-quality risk 5/10 · Moderate
- Unhealthy air days now
- 6 days/yr
- Unhealthy air days in 30 yrs
- 8 days/yr
Risk factors via First Street. Map © Google.
Why this score? — see what drove the B grade
The composite is a weighted blend of 9 inputs, each scored 0–100. Each bar is that input's sub-score; the figure is the points it added to the 100-point composite (weight × sub-score).
- Cash flow +29.6/30.0
- ARV discount +15.0/15.0
- DSCR +10.0/10.0
- 1% rule +7.0/10.0
- Livability +3.3/5.0
- Schools +2.7/10.0
- Condition / age +2.5/5.0
- Rent growth +2.4/5.0
- Appreciation +0.0/10.0
$224,000
🖨 Deal sheet (PDF) 📄 Offer letter ✓ Due diligence
Listing remarks
Welcome to 305 Kona. Priced at $224,000, the home is ready for you to make it all yours. An incredible value in Palm Canyon Mobile Club with 1,512 sq. ft. ($148 per sq. ft. ). Newly built in 2004, the double wide house sits close to all of the park amenities, heated pool, spa, dog park and fitness center! The home boasts a large primary suite with an en-suite bathroom featuring a garden tub and separate shower, plus a walk in closet. There are two more bedrooms with large closets separating them from sharing walls with each other, a very clever a private floor plan. A second full bath with a shower/tub separates the primary and guest bedroom. The spacious layout includes a flexible third be
Key facts
- Dog park
- Fitness center
- Spa
Tags
Property features AI
Finance
- Other: Located in a 229-unit community (Palm Canyon Mobile Club)
- Financial info: Property is in a leased land arrangement (land lease); Manager approval required for lease/park; Land lease amount listed (annual)
- HOA & community: Community amenities include pool, spa, fitness center, gated access, association barbecue, and sports courts; Association pet rules apply
Exterior
- Parking: Carport; 2 total parking spaces (2 covered)
- Security: Gated community
- Utilities: Water and trash collection included in rent/land lease
- Home design: Residential mobile home; Single-story; Faces east; Located in a leased park (Palm Canyon Mobile Club)
- Construction: Mobile home construction
- Exterior features: Composition roof; Community pool; Community spa; Gated community; Association barbecue; Other community courts; Fitness center; BLM/National Forest nearby lot location
Interior
- Kitchen: Dishwasher; Range/oven; Microwave; Refrigerator
- Bedrooms: Den (extra living/office space)
- Flooring: Carpeted floors
- Bathrooms: 2 full bathrooms
- Heating & cooling: Central heat; Central cooling
- Interior features: Den/office; Ceiling fan; Has view of hills
- Laundry & utility: In-unit laundry area with washer and dryer
Neighborhood map
What this means for you Summary
Snapshot
- This is a 3-bed/2.0-bath manufactured listed at $224k.
Deal economics
- At list price, monthly cash flow is $809 ($10k/yr) — positive.
- The deal already cash-flows at list — no discount required.
- Meets the 1% rule at list price ($3k rent vs $224k).
- Recommended offer: $221k (1.5% below list) — sets the bar for market timing.
- Cap rate 10.6% vs local median 2.7% in Palm Springs — top-decile yield for the area; either an underpriced asset or a hidden risk that comps aren't pricing in. Stress-test before assuming the spread holds.
Location & tenants
- Location reads 66/100 on livability (#348 in CA) — a middle-class / working-renter tenant base. Strengths: amenities A+, commute A+; Watch: crime F, cost of living F, health & safety F.
- Palm Springs Unified (suburban): math 21% / reading 42% proficiency, ranked #328 of 517 in CA (top 63%) — families likely to look elsewhere, expect single-tenant / working-renter base with shorter leases; 73% free/reduced lunch — lower-income household profile, screen leases tightly.
- Zoned schools: Cahuilla Elementary (421 students, 93% FRL); Raymond Cree Middle (708 students, 98% FRL); Palm Springs High (math 30% / reading 51%, grade F, #508 of 1,170 statewide, top 44%, 1,584 students, 97% FRL) — zoned schools average 96% FRL vs 73% district-wide (22 pts higher); higher-poverty schools than district average — tighter screening recommended.
- Market conditions: Rents soft (-0.4%/yr); 498 active listings in the ZIP; 40 comparable units currently listed for rent nearby; rentals at typical pace (median 27d on market — plan ~3-4 weeks tenant-placement turnaround); solid renter incomes; 9,195 units permitted in Riverside County in 2024 (1,512 in 5+ unit buildings).
- This rent runs 42% of the median local income ($78k/yr) — at the standard rent-burdened threshold; future hikes will face affordability resistance.
Forward outlook
- Local home prices are declining (-3.0%/yr); year-one equity from $2k of loan paydown is wiped out by about $7k of value loss. Plan a longer hold.
- Riverside County population projected at +22% by 2050 — long-run rental-demand tailwind backs the buy-and-hold thesis.
Negotiation context
- It's been on market 25 days — a 2% lower offer ($221k) is reasonable based on typical stale-listing flexibility.
Risks & watch-outs
- Climate carrying-cost: moderate wildfire risk; extreme-heat days projected 9→27/yr by 2055 (HVAC capex compounding) — expect insurance premiums to compound above CPI over the hold.
Questions for the listing agent
- Is there a deadline driving the sale (1031 exchange, divorce, estate, relocation)? That informs how much negotiation room exists.
- Crime grade is F in this area — have there been break-ins, vandalism, or insurance claims at this property in the last 3 years? What carrier currently insures it and at what premium?
- What's the average days-on-market for RENTAL listings here right now (not sales)? A rising rental-DOM trend means longer vacancies and softer asking-rent achievability than the comps imply.
- What's the recent tenant-quality profile in this submarket — average credit score on applications, eviction rate, late-payment / NSF rate, and stable-employment percentage? A property-management company in the area should have these aggregated.
- How much new for-sale + rental construction is in the pipeline within 1–3 miles? Heavy new supply typically softens prices + rents 12–24 months out; constrained supply supports both.
Investment metrics
- 1% rule
- 1.20% ✓
- Cap rate
- 10.63%
- Cash-on-cash
- 15.48%
- DSCR
- 1.69
- GRM
- 6.9
CMA / ARV
- ARV (on-the-fly)
- $288,792
- Comps found
- 12
Show comp detail 12 sales within ~0.75 mi
| Address | Dist | Beds/Ba | Sqft | Sold | Price | $/sf | Match |
|---|---|---|---|---|---|---|---|
| 234 Lei Dr | 0.19mi | 2/2.0 (-1) | 1,456 (-4%) | 3mo | $125,000 | $86 | 78 |
| 315 Kona Ln | 0.04mi | 2/2.0 (-1) | 1,320 (-13%) | 0mo | $215,000 | $163 | 72 |
| 3 Bali Dr | 0.14mi | 2/2.0 (-1) | 1,440 (-5%) | 13mo | $420,000 | $292 | 70 |
| 267 Araby St | 0.33mi | 2/2.0 (-1) | 1,440 (-5%) | 2mo | $170,500 | $118 | 70 |
| 317 Kona Ln | 0.05mi | 3/2.0 | 1,344 (-11%) | 12mo | $325,000 | $242 | 69 |
| 15 Tiki Dr | 0.16mi | 2/2.0 (-1) | 1,440 (-5%) | 16mo | $240,000 | $167 | 66 |
| 2 Bali Dr | 0.18mi | 2/2.0 (-1) | 1,440 (-5%) | 16mo | $470,000 | $326 | 65 |
| 252 Suez St | 0.34mi | 2/2.0 (-1) | 1,440 (-5%) | 10mo | $275,000 | $191 | 63 |
| 406 Kona Ln | 0.02mi | 2/2.0 (-1) | 1,344 (-11%) | 21mo | $280,000 | $208 | 58 |
| 633 Cameo Dr | 0.68mi | 2/2.0 (-1) | 1,440 (-5%) | 1mo | $270,000 | $188 | 55 |
| 527 Jade Ln | 0.68mi | 2/2.0 (-1) | 1,440 (-5%) | 4mo | $360,000 | $250 | 52 |
| 511 Jade Ln | 0.64mi | 3/2.0 | 1,700 (+12%) | 20mo | $295,000 | $174 | 33 |
Match score weights: distance 35% · size 25% · config 20% · recency 20%. Top-matched comps best support the ARV.
Projected returns pro-forma
-3.0% appreciation · 0.0% rent growth · sell at horizon
- IRR
- 3.1%
- Equity multiple
- 1.12×
- Total profit
- $7,223
- Equity at exit
- $33,399
- IRR
- 9.8%
- Equity multiple
- 1.66×
- Total profit
- $41,675
- Equity at exit
- $19,367
Cash invested: $62,720 (down + closing). Projections, not guarantees.
Landlord ↔ Tenant lean methodology
- Overall (STATE)
- 18 Strongly Tenant-Friendly
- State California
- 18 Strongly Tenant-Friendly · D+13
- County
- — inherits STATE
- City
- — inherits STATE
ZIP-level market 92264
- Rents YoY
- -0.4%
- Active inventory
- 498
- Price-to-rent
- 6.9×
Monthly cashflow live
- Estimated rent
- $2,699 high interval (Pro) →
- Mortgage (P&I)
- −$1,175
- Tax from tax record
- −$55 /mo · $663/yr
- Insurance
- −$93
- HOA
- −$0
- Lot rent leased land?
- −$0
- Vacancy / Maint / Mgmt
- −$567
- Net cashflow
- $809
Break-even live
Sensitivity live
| Price | -10% $936 | -5% $872 | +0% $809 | +5% $746 | +10% $682 |
|---|---|---|---|---|---|
| Rent | -10% $596 | -5% $702 | +0% $809 | +5% $916 | +10% $1,022 |
| Rate | -1.0pp $922 | -0.5pp $866 | base $809 | +0.5pp $751 | +1.0pp $692 |
UW: 25.0% down · 7.5% · 30yr · 1.5% tax · 5.0% vac · 8.0% maint · 8.0% mgmt
Financing live
Cash to close
- Down payment
- $56,000
- Closing costs
- $6,720
- Reserves months
- —
- Total cash needed
- —
Loan-product check · same deal, 3 products live
Conventional
25% down · 7.5% · 30yr
- Down + closing
- —
- Monthly P&I
- —
- Monthly cashflow
- —
- DSCR
- —
- Eligible?
- —
Personal DTI + credit; lowest rate.
DSCR
20% down · 8.5% · 30yr
- Down + closing
- —
- Monthly P&I
- —
- Monthly cashflow
- —
- DSCR
- —
- Eligible?
- —
No personal income docs; deal must DSCR.
Hard money
10% down · 12.0% · 12mo
- Down + closing
- —
- Monthly P&I
- —
- Monthly cashflow
- —
- DSCR
- —
- Eligible?
- —
Short-term bridge; refi at stabilization.
Rent comps 40 comps
| Address | Beds | Baths | Sqft | Rent | $/sqft | DOM | Units | Dist |
|---|---|---|---|---|---|---|---|---|
| 791 E Twin Palms Dr Palm Springs, CA | 3.0 | 2.0 | 1793 | $9,700 | $5.41 | 46d | 1 | 0.15mi |
| 500 Paseo Soleado Unit 485 Palm Springs, CA | 2.0 | 2.5 | 1712 | $2,800 | $1.64 | 46d | 1 | 0.20mi |
| 500 Paseo Soleado Unit 497 Palm Springs, CA | 3.0 | 2.5 | 1812 | $3,000 | $1.66 | 46d | 1 | 0.20mi |
| 780 E Palm Canyon Dr #202 Palm Springs, CA | 2.0 | 2.0 | 1305 | $2,950 | $2.26 | 26d | 1 | 0.22mi |
| 965 E Twin Palms Dr Palm Springs, CA | 3.0 | 2.0 | 1600 | $15,000 | $9.38 | 46d | 1 | 0.25mi |
| 157 Calle Bravo Palm Springs, CA | 2.0 | 3.0 | 1694 | $2,950 | $1.74 | 1d | 1 | 0.26mi |
| 1947 S Joshua Tree Pl Palm Springs, CA | 3.0 | 2.5 | 1928 | $6,000 | $3.11 | 26d | 1 | 0.26mi |
| 1970 S Joshua Tree Pl Palm Springs, CA | 3.0 | 2.0 | 1957 | $8,175 | $4.18 | 46d | 1 | 0.31mi |
| 1970 S Joshua Tree Pl Palm Springs, CA | 3.0 | 2.0 | 1957 | $8,175 | $4.18 | 17d | 1 | 0.31mi |
| 1425 Via Soledad Unit 1 Palm Springs, CA | 2.0 | 2.0 | 1050 | $2,500 | $2.38 | 26d | 1 | 0.41mi |
| 1425 Via Soledad Unit 1 Palm Springs, CA | 2.0 | 2.0 | 1050 | $2,500 | $2.38 | 46d | 1 | 0.41mi |
| 1428 S Camino Real Palm Springs, CA | 2.0 | 2.0 | 1054 | $2,300 | $2.18 | 46d | 1 | 0.43mi |
| 251 E La Verne Way Unit F Palm Springs, CA | 2.0 | 2.0 | 1345 | $2,550 | $1.90 | 26d | 1 | 0.43mi |
| 451 E Via Carisma #72 Palm Springs, CA | 2.0 | 2.0 | 1170 | $2,200 | $1.88 | 26d | 1 | 0.48mi |
| 2220 S Calle Palo Fierro #23 Palm Springs, CA | 2.0 | 2.0 | 1200 | $2,995 | $2.50 | 13d | 1 | 0.48mi |
| 1150 E Palm Canyon Dr #60 Palm Springs, CA | 2.0 | 2.0 | 1240 | $2,595 | $2.09 | 26d | 1 | 0.49mi |
| 1041 S La Verne Way Palm Springs, CA | 2.0 | 2.0 | 1325 | $2,800 | $2.11 | 26d | 1 | 0.50mi |
| 1201 Surrey Ln Palm Springs, CA | 2.0 | 2.5 | 1896 | $5,500 | $2.90 | 46d | 1 | 0.51mi |
| 250 E San Jose Rd #63 Palm Springs, CA | 2.0 | 2.0 | 1152 | $2,400 | $2.08 | 26d | 1 | 0.59mi |
| 250 E San Jose Rd Palm Springs, CA | 2.0–3.0 | 2.0 | 1187 | $2,400 | $2.02 | 46d | 2 | 0.59mi |
| 1486 E Palm Tree Dr Palm Springs, CA | 2.0 | 2.0 | 1300 | $3,000 | $2.31 | 46d | 1 | 0.66mi |
| 722 E San Lorenzo Rd Palm Springs, CA | 3.0 | 1.0–2.0 | 750 | $2,425 | $3.23 | 10d | 3 | 0.73mi |
| 722 E San Lorenzo Rd Unit 02 Palm Springs, CA | 3.0 | 2.0 | 1200 | $2,425 | $2.02 | 6d | 1 | 0.73mi |
| 3000 Cahuilla Hills Dr Palm Springs, CA | 3.0 | 3.0 | 2120 | $7,000 | $3.30 | 46d | 1 | 0.85mi |
| 17 Cahuilla Hills Dr Palm Springs, CA | 2.0 | 2.0 | 1965 | $10,500 | $5.34 | 46d | 1 | 0.87mi |
| 1331 S Sunrise Way Palm Springs, CA | 3.0 | 3.0 | 2160 | $7,000 | $3.24 | 46d | 1 | 0.91mi |
| 1710 E Sonora Rd Palm Springs, CA | 2.0 | 2.0 | 1391 | $2,800 | $2.01 | 26d | 1 | 0.93mi |
| 1423 E San Lorenzo Rd Palm Springs, CA | 4.0 | 2.0 | 1824 | $4,200 | $2.30 | 26d | 1 | 0.94mi |
| 255 E Avenida Granada #324 Palm Springs, CA | 2.0 | 2.0 | 1198 | $2,100 | $1.75 | 10d | 1 | 0.95mi |
| 255 E Avenida Granada #525 Palm Springs, CA | 2.0 | 2.0 | 1198 | $2,195 | $1.83 | 20d | 1 | 0.95mi |
| 1745 Capri Cir Palm Springs, CA | 2.0 | 2.0 | 1200 | $2,495 | $2.08 | 26d | 1 | 0.96mi |
| 2600 S Palm Canyon Dr Palm Springs, CA | 2.0 | 1.5–2.0 | 1392 | $2,700 | $1.94 | 13d | 2 | 1.05mi |
| 1111 E Ramon Rd #87 Palm Springs, CA | 3.0 | 2.0 | 1313 | $4,500 | $3.43 | 19d | 1 | 1.07mi |
| 2727 S Sierra Madre #5 Palm Springs, CA | 2.0 | 2.5 | 1616 | $3,100 | $1.92 | 46d | 1 | 1.13mi |
| 1111 E Ramon Rd Palm Springs, CA | 2.0–3.0 | 2.0 | 1191 | $4,500 | $3.78 | 26d | 2 | 1.23mi |
| 1111 E Ramon Rd Palm Springs, CA | 2.0–3.0 | 2.0 | 1191 | $4,500 | $3.78 | 19d | 2 | 1.23mi |
| 520 E Murray Canyon Dr Palm Springs, CA | 1.0–3.0 | 2.0–2.5 | 1885 | $3,295 | $1.75 | 0d | 1 | 1.24mi |
| 453 Village Square E Palm Springs, CA | 2.0 | 2.0 | 1400 | $3,000 | $2.14 | 19d | 1 | 1.26mi |
| 1050 E Ramon Rd Palm Springs, CA | 2.0 | 2.0 | 1253 | $3,815 | $3.04 | 46d | 2 | 1.29mi |
| 1050 E Ramon Rd Palm Springs, CA | 2.0 | 2.0 | 1135 | $3,264 | $2.88 | 1d | 3 | 1.29mi |
Listing history 17 events
-
2026-06-22days on market $224,000 Active 25 DOM
-
2026-06-21days on market $224,000 Active 24 DOM
-
2026-06-18days on market $224,000 Active 21 DOM
-
2026-06-17days on market $224,000 Active 20 DOM
-
2026-06-16days on market $224,000 Active 19 DOM
-
2026-06-15days on market $224,000 Active 18 DOM
-
2026-06-13days on market $224,000 Active 16 DOM
-
2026-06-13days on market $224,000 Active 15 DOM
-
2026-06-09days on market $224,000 Active 12 DOM
-
2026-06-08days on market $224,000 Active 11 DOM
-
2026-06-07days on market $224,000 Active 10 DOM
-
2026-06-04days on market $224,000 Active 7 DOM
-
2026-06-03days on market $224,000 Active 6 DOM
-
2026-06-02days on market $224,000 Active 5 DOM
-
2026-06-01days on market $224,000 Active 4 DOM
-
2026-05-31days on market $224,000 Active 3 DOM
-
2026-05-27$224,000 Active
ⓘ Source: listings_history table (triggers on properties + properties_extension) + one-shot
backfill from property_details.listing_events for pre-trigger history.
Tax reassessment forecast CA · Resets to sale price
- Current annual tax
- $663 · $55/mo
- Projected year-2 tax
- $1,702 · $142/mo
- Expected delta
- +$1,040/yr (+$87/mo · 156.9%)
ⓘ Screening estimate from a state-policy table — verify with the county assessor before closing.
Climate risk First Street
- Flood 1/10 Low FEMA zone X (shaded) · 0% chance over 30 yrs
- Wildfire 5/10 Major
- Heat 9/10 Extreme 9 d/yr ≥110°F today · 27 d/yr by 30 yrs out
- Wind 1/10 Low
- Air quality 5/10 Major 6 unhealthy d/yr today · 8 by 30 yrs out
Nearby sold comps map
Loading sold comps map…
Walkable amenities ~0.75 mi
Loading nearby amenities…
Taxation est. · year 1
- Rental income
- $32,389
- − Mortgage interest
- −$12,547
- − Property taxes
- −$663
- − Insurance
- −$1,120
- − Repairs & maintenance
- −$2,591
- − Management
- −$2,591
- − Depreciation
- −$6,516
- Taxable income
- $6,360
- Est. tax owed @ 24.0%
- −$1,526
- After-tax cash flow
- $8,182/yr
For passive investors: Depreciation is non-cash, so a rental often shows a tax loss while cash-flowing — sheltering income. Rental losses are passive: they offset passive income freely, and up to $25,000/yr can offset ordinary (W-2) income if you actively participate and your MAGI is under $100k (phasing out to $0 by $150k); unused losses carry forward. On sale, claimed depreciation is recaptured at up to 25%, and gains may owe capital-gains tax (a 1031 exchange can defer both). Figures are a year-1 estimate at your 24.0% rate — not tax advice; consult a CPA.
Schools (NCES district)
- District
- Palm Springs Unified
- NCES district ID
- 0629550
- Math proficiency
- 21% ▼ -7.00%
- Reading proficiency
- 42% ▬ 0.00%
- Median HH income
- $43,638
- Composite
- 26.76/100
- National rank
- #7131
- State rank
- #328 of 517 in CA
Livability — Palm Springs
- Score
- 66/100
- State rank
- #348
- US rank
- #11850
Category grades
Schools grade is shown separately in the Schools card above.
Census & demographics
- Census place
- Palm Springs, CA
- County
- Riverside County · 2,287,001 people
- City population
- 46,786
- Metro
- Riverside-San Bernardino-Ontario, CA
- Population (ZIP)
- 19,899
- Household income
- $77,688
- Rent vs Own
- Severe rent burden
- 1215.0
Population outlook (Riverside County) Hauer SSP2
- Today (2025)
- 2,664,475 people
- By 2030
- 2,802,692 · +5.2%
- By 2040
- 3,050,904 · +14.5%
- By 2050
- 3,256,783 · +22.2%
- By 2075
- 3,655,058 · +37.2%
- By 2100
- 3,766,594 · +41.4%
Race, ethnicity, and origin ACS 2023
- Neighborhood character
- Predominantly White (68%)
- Race & ethnicity
- White 68% Hispanic / Latino 20% Two or more races 12% Asian 6% Black 2% Native American 1%
- Hispanic origin (detail)
- Mexican 16%
- Common ancestry
- Lithuanian 4% Romanian 3% Slovak 3%
- Foreign-born
- 16% · Canada, China, South Korea
- Languages at home
- 81% English-only · Spanish 13% Tagalog/Filipino 2% Other Asian/Pacific 1%
Political lean MEDSL · Riverside
- 2024 margin
- Toss-up / Even · D 48.0% · R 49.3% · Other 2.6%
- 2008→2024 swing
- -3.6pp toward R · 2008: 2.3pp · 2024: -1.3pp
- All cycles
- 2024: R+1.3 2020: D+8.0 2016: D+4.3 2012: R+0.4 2008: D+2.3
Not yet ingested
- Civics
- —
Market trends
- HPI YoY
- ▼ -489.04%
- Current HPI
- 357.0969
- Rent YoY
- ▼ -0.43%
- Metro
- Riverside-San Bernardino-Ontario, CA
- State GDP YoY
- ▲ 3.21%
- F500 in state
- 116
Industry mix (Fortune 500 HQ in CA)
| Industry | F500 HQs | Revenue |
|---|---|---|
| Technology | 27 | $1,492B |
|
||
| Financial Services | 3 | $174B |
|
||
| Retail | 3 | $44B |
|
||
| Insurance | 3 | $26B |
|
||
| Media / Entertainment | 2 | $115B |
|
||
| Pharmaceuticals / Biotech | 2 | $62B |
|
||
Price history
1 event — show timeline
- 2026-05-27 Listed $224,000 TheMLS
Property tax history
-3.2%/yrLatest (2025): $663 · +0.8% YoY. Source: county tax records.
Cash-flow waterfall
monthlySold comps — $/sqft
last 12 mo · ≤1 miLoading sold comps…