8878 Little Morongo Rd · Morongo Valley, CA
Flood risk 1/10 · Minimal
- FEMA flood zone
- D
- Chance of flooding over 30 yrs
- 0.0%
- Est. flood insurance / yr
- $544 – $1,084
Fire risk 6/10 · Moderate
- Est. fire insurance / yr
- $659 – $1,223
Heat risk 7/10 · Major
- Hot days now (above 100°F)
- 8 days/yr
- Hot days in 30 yrs
- 24 days/yr
Wind risk 1/10 · Minimal
- Chance of severe wind over 30 yrs
- —
Air-quality risk 6/10 · Moderate
- Unhealthy air days now
- 12 days/yr
- Unhealthy air days in 30 yrs
- 14 days/yr
Risk factors via First Street. Map © Google.
Why this score? — see what drove the D+ grade
The composite is a weighted blend of 9 inputs, each scored 0–100. Each bar is that input's sub-score; the figure is the points it added to the 100-point composite (weight × sub-score).
- ARV discount +15.0/15.0
- Cash flow +9.3/30.0
- Appreciation +7.8/10.0
- Livability +3.1/5.0
- DSCR +2.6/10.0
- Rent growth +2.5/5.0
- Condition / age +2.5/5.0
- 1% rule +2.3/10.0
- Schools +2.2/10.0
$229,000
🖨 Deal sheet 📄 Offer letter ✓ Due diligence
Listing remarks MLS
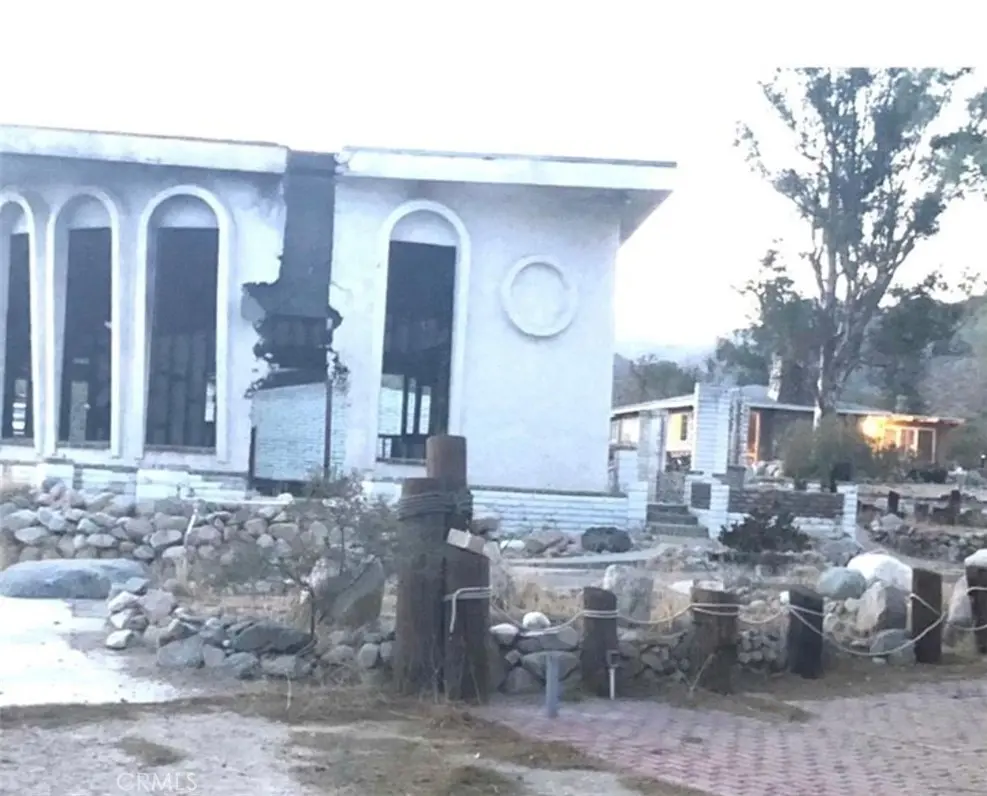
Great fixer-upper opportunity for investors. House is partially burned, Separate 2 car garages are untouched and have new roofs. One separate studio is untouched and next to it has a green house. The added living room is partially damaged. Irrigation pluming is intact but the house needs new plumbing and electrical. Stamped concrete and concrete driveway all around. Concrete wall surrounds the property.
Key facts
- Stamped concrete
- New roofs
- Irrigation plumbing
Tags
Neighborhood map
What this means for you Summary
Snapshot
- This is a 1-bed/1.0-bath single-family listed at $229k.
Deal economics
- At list price, monthly cash flow is $-168 ($-2k/yr) — negative.
- To cash-flow at today's rent, offer at most $199k (13.0% below list).
- To meet the 1% rule (rent ≥ 1% of price), the offer needs to be $168k (26.6% below list).
- Recommended offer: $168k (26.6% below list) — sets the bar for 1% rule.
- Cap rate 5.4% vs local median 4.1% in Morongo Valley — top-decile yield for the area; either an underpriced asset or a hidden risk that comps aren't pricing in. Stress-test before assuming the spread holds.
Location & tenants
- Location reads 62/100 on livability (#505 in CA) — a middle-class / working-renter tenant base. Strengths: housing A+; Watch: cost of living C-, schools D+, amenities F.
- Morongo Unified (town): math 15% / reading 38% proficiency, ranked #395 of 517 in CA (top 76%) — low school quality limits family demand, transient renter base, plan for 1-2y turnover.
- Market conditions: 75 active listings in the ZIP; 5,458 units permitted in San Bernardino County in 2024 (1,500 in 5+ unit buildings).
Forward outlook
- In year one you build about $14k of equity ($2k loan paydown + $13k appreciation (5.6% local appreciation)).
- San Bernardino County population projected at +15% by 2050 — modest demand growth; plan on rents tracking national, not racing it.
- By year 3, paydown + projected appreciation supports a ~$36k cash-out refi (75% LTV) — recoverable capital for the next deal without selling this one.
Negotiation context
- It's been on market 336 days — a 12% lower offer ($202k) is reasonable based on typical stale-listing flexibility.
- 2 sale attempts since 3y ago with the ask held roughly flat each time — persistent listings suggest the price (not the market) is what's stuck; bring a comps-based counter.
- Current owner paid $50k; list at $229k implies a 358% gain — meaningful room to come down on a strong offer.
Risks & watch-outs
- Climate carrying-cost: major wildfire risk; extreme-heat days projected 8→24/yr by 2055 (HVAC capex compounding) — expect insurance premiums to compound above CPI over the hold.
Questions for the listing agent
- What do current leases actually rent for vs. the listed asking? Can we see a recent rent roll and the last 12 months of T-12 income?
- It's been on market 336 days. Have you received any prior offers? Is the seller open to a 27% concession, seller financing, or rate buy-down credit?
- Built in 1972 — when were the roof, HVAC, electrical panel, plumbing, and water heater last replaced?
- Why hasn't it sold? Are there any deal-killer items the seller is aware of (foundation, flood, title, zoning, code violations)?
- Is there a deadline driving the sale (1031 exchange, divorce, estate, relocation)? That informs how much negotiation room exists.
- Schools are D-rated, which usually means shorter tenancies and higher turnover. Who's the typical renter profile here, and what's been the actual vacancy rate?
- The area grade is low — what's the realistic commute time and amenity access for the typical tenant pool here? Any planned neighborhood developments (good or bad) we should know about?
- What's the average days-on-market for RENTAL listings here right now (not sales)? A rising rental-DOM trend means longer vacancies and softer asking-rent achievability than the comps imply.
- What's the recent tenant-quality profile in this submarket — average credit score on applications, eviction rate, late-payment / NSF rate, and stable-employment percentage? A property-management company in the area should have these aggregated.
- How much new for-sale + rental construction is in the pipeline within 1–3 miles? Heavy new supply typically softens prices + rents 12–24 months out; constrained supply supports both.
Investment metrics
- 1% rule
- 0.73% ✗
- Cap rate
- 5.41%
- Cash-on-cash
- -3.14%
- DSCR
- 0.86
- GRM
- 11.3
CMA / ARV
- ARV (median comp)
- $372,785
- List price
- $229,000
- Delta
- -38.57%
- Verdict
- UNDERPRICED
- Comps
- 15 within 1.0 mi
Show comp detail 2 sales within ~0.75 mi
| Address | Dist | Beds/Ba | Sqft | Sold | Price | $/sf | Match |
|---|---|---|---|---|---|---|---|
| 8887 Little Morongo Rd | 0.09mi | 2/2.5 (+1) | 1,525 (-4%) | 7mo | $350,000 | $230 | 72 |
| 8574 Rose Eden Dr | 0.44mi | 2/2.0 (+1) | 1,447 (-9%) | 14mo | $440,000 | $304 | 44 |
Match score weights: distance 35% · size 25% · config 20% · recency 20%. Top-matched comps best support the ARV.
Projected returns pro-forma
5.61% appreciation · 3.0% rent growth · sell at horizon
- IRR
- 11.8%
- Equity multiple
- 1.78×
- Total profit
- $50,065
- Equity at exit
- $138,296
- IRR
- 12.7%
- Equity multiple
- 3.45×
- Total profit
- $157,124
- Equity at exit
- $246,046
Cash invested: $64,120 (down + closing). Projections, not guarantees.
Landlord ↔ Tenant lean methodology
- Overall (STATE)
- 18 Strongly Tenant-Friendly
- State California
- 18 Strongly Tenant-Friendly · D+13
- County
- — inherits STATE
- City
- — inherits STATE
ZIP-level market 92256
- Home prices YoY
- 1.1%
- Active inventory
- 75
- Price-to-rent
- 11.3×
Monthly cashflow live
- Estimated rent
- $1,682 medium interval (Pro) →
- Mortgage (P&I)
- −$1,201
- Tax from tax record
- −$200 /mo · $2,404/yr
- Insurance
- −$95
- HOA
- −$0
- Vacancy / Maint / Mgmt
- −$353
- Net cashflow
- $-168
Break-even live
UW: 25.0% down · 7.5% · 30yr · 1.5% tax · 5.0% vac · 8.0% maint · 8.0% mgmt
Financing live
Cash to close
- Down payment
- $57,250
- Closing costs
- $6,870
- Reserves months
- —
- Total cash needed
- —
Loan-product check · same deal, 3 products live
Conventional
25% down · 7.5% · 30yr
- Down + closing
- —
- Monthly P&I
- —
- Monthly cashflow
- —
- DSCR
- —
- Eligible?
- —
Personal DTI + credit; lowest rate.
DSCR
20% down · 8.5% · 30yr
- Down + closing
- —
- Monthly P&I
- —
- Monthly cashflow
- —
- DSCR
- —
- Eligible?
- —
No personal income docs; deal must DSCR.
Hard money
10% down · 12.0% · 12mo
- Down + closing
- —
- Monthly P&I
- —
- Monthly cashflow
- —
- DSCR
- —
- Eligible?
- —
Short-term bridge; refi at stabilization.
Listing history 19 events
-
2026-06-18days on market $229,000 Active 336 DOM
-
2026-06-17days on market $229,000 Active 335 DOM
-
2026-06-16days on market $229,000 Active 334 DOM
-
2026-06-15days on market $229,000 Active 333 DOM
-
2026-06-13days on market $229,000 Active 331 DOM
-
2026-06-13days on market $229,000 Active 330 DOM
-
2026-06-09days on market $229,000 Active 327 DOM
-
2026-06-08days on market $229,000 Active 326 DOM
-
2026-06-07days on market $229,000 Active 325 DOM
-
2026-06-04days on market $229,000 Active 322 DOM
-
2026-06-03days on market $229,000 Active 321 DOM
-
2026-06-02days on market $229,000 Active 320 DOM
-
2026-06-01days on market $229,000 Active 319 DOM
-
2026-05-31days on market $229,000 Active 318 DOM
-
2025-07-17$229,000 Active 406-char remark
Show marketing remark (406 chars)
Great fixer-upper opportunity for investors. House is partially burned, Separate 2 car garages are untouched and have new roofs. One separate studio is untouched and next to it has a green house. The added living room is partially damaged. Irrigation pluming is intact but the house needs new plumbing and electrical. Stamped concrete and concrete driveway all around. Concrete wall surrounds the property.
-
2024-02-24historical
-
2023-10-17price $249,000
-
2023-02-24$350,000 Active
-
1999-11-19soldstatus $50,000
ⓘ Source: listings_history table (triggers on properties + properties_extension) + one-shot
backfill from property_details.listing_events for pre-trigger history.
Tax reassessment forecast CA · Resets to sale price
- Current annual tax
- $2,404 · $200/mo
- Projected year-2 tax
- $2,404 · $200/mo
- Expected delta
- $0/yr ($0/mo · 0.0%)
ⓘ Screening estimate from a state-policy table — verify with the county assessor before closing.
Climate risk First Street
- Flood 1/10 Low FEMA zone D · 0% chance over 30 yrs
- Wildfire 6/10 Major
- Heat 7/10 Severe 8 d/yr ≥100°F today · 24 d/yr by 30 yrs out
- Wind 1/10 Low
- Air quality 6/10 Major 12 unhealthy d/yr today · 14 by 30 yrs out
Nearby sold comps map
Loading sold comps map…
Walkable amenities ~0.75 mi
Loading nearby amenities…
Taxation est. · year 1
- Rental income
- $20,181
- − Mortgage interest
- −$12,828
- − Property taxes
- −$2,404
- − Insurance
- −$1,145
- − Repairs & maintenance
- −$1,614
- − Management
- −$1,614
- − Depreciation
- −$6,662
- Taxable loss
- −$6,086
- Est. tax savings @ 24.0%
- +$1,461
- After-tax cash flow
- $-556/yr
For passive investors: Depreciation is non-cash, so a rental often shows a tax loss while cash-flowing — sheltering income. Rental losses are passive: they offset passive income freely, and up to $25,000/yr can offset ordinary (W-2) income if you actively participate and your MAGI is under $100k (phasing out to $0 by $150k); unused losses carry forward. On sale, claimed depreciation is recaptured at up to 25%, and gains may owe capital-gains tax (a 1031 exchange can defer both). Figures are a year-1 estimate at your 24.0% rate — not tax advice; consult a CPA.
Schools (NCES district)
- District
- Morongo Unified
- NCES district ID
- 0625860
- Math proficiency
- 15% ▼ -12.00%
- Reading proficiency
- 38% ▼ -3.00%
- Median HH income
- $39,399
- Composite
- 22.19/100
- National rank
- #8156
- State rank
- #395 of 517 in CA
Livability — Morongo Valley
- Score
- 62/100
- State rank
- #505
- US rank
- #17106
Category grades
Schools grade is shown separately in the Schools card above.
Census & demographics
- Census place
- Morongo Valley, CA
- Population (ZIP)
- 3,907
Population outlook (San Bernardino County) Hauer SSP2
- Today (2025)
- 2,300,329 people
- By 2030
- 2,378,907 · +3.4%
- By 2040
- 2,523,137 · +9.7%
- By 2050
- 2,642,388 · +14.9%
- By 2075
- 2,880,769 · +25.2%
- By 2100
- 2,909,436 · +26.5%
Race, ethnicity, and origin ACS 2023
- Neighborhood character
- Majority White (62%)
- Race & ethnicity
- White 62% Hispanic / Latino 31% Two or more races 12% Black 3% Native American 2%
- Hispanic origin (detail)
- Mexican 16% Cuban 4%
- Common ancestry
- Romanian 4% Italian 3% Lithuanian 2%
- Foreign-born
- 12% · Canada
- Languages at home
- 77% English-only · Spanish 19% German/W. Germanic 1% Tagalog/Filipino 1%
Political lean MEDSL · San Bernardino
- 2024 margin
- Toss-up / Even · D 47.5% · R 49.7% · Other 2.8%
- 2008→2024 swing
- -8.5pp toward R · 2008: 6.3pp · 2024: -2.1pp
- All cycles
- 2024: R+2.1 2020: D+10.7 2016: D+9.8 2012: D+5.4 2008: D+6.3
Not yet ingested
- Civics
- —
Market trends
- HPI YoY
- ▲ 5.61%
- Current HPI
- 526.1914
- Rent YoY
- —
- Metro
- —
- State GDP YoY
- ▲ 3.21%
- F500 in state
- 116
Industry mix (Fortune 500 HQ in CA)
| Industry | F500 HQs | Revenue |
|---|---|---|
| Technology | 27 | $1,492B |
|
||
| Financial Services | 3 | $174B |
|
||
| Retail | 3 | $44B |
|
||
| Insurance | 3 | $26B |
|
||
| Media / Entertainment | 2 | $115B |
|
||
| Pharmaceuticals / Biotech | 2 | $62B |
|
||
Price history
+358.0% since first listed5 events — show timeline
- 2025-07-17 Listed $229,000 CRMLS
- 2024-02-24 Listing Removed — CRMLS
- 2023-10-17 Price Changed $249,000 CRMLS
- 2023-02-24 Listed $350,000 CRMLS
- 1999-11-19 Sold (Public Records) $50,000 Public Records
Property tax history
+4.0%/yrLatest (2025): $2,404 · +16.7% YoY. Source: county tax records.
Cash-flow waterfall
monthlySold comps — $/sqft
last 12 mo · ≤1 miLoading sold comps…