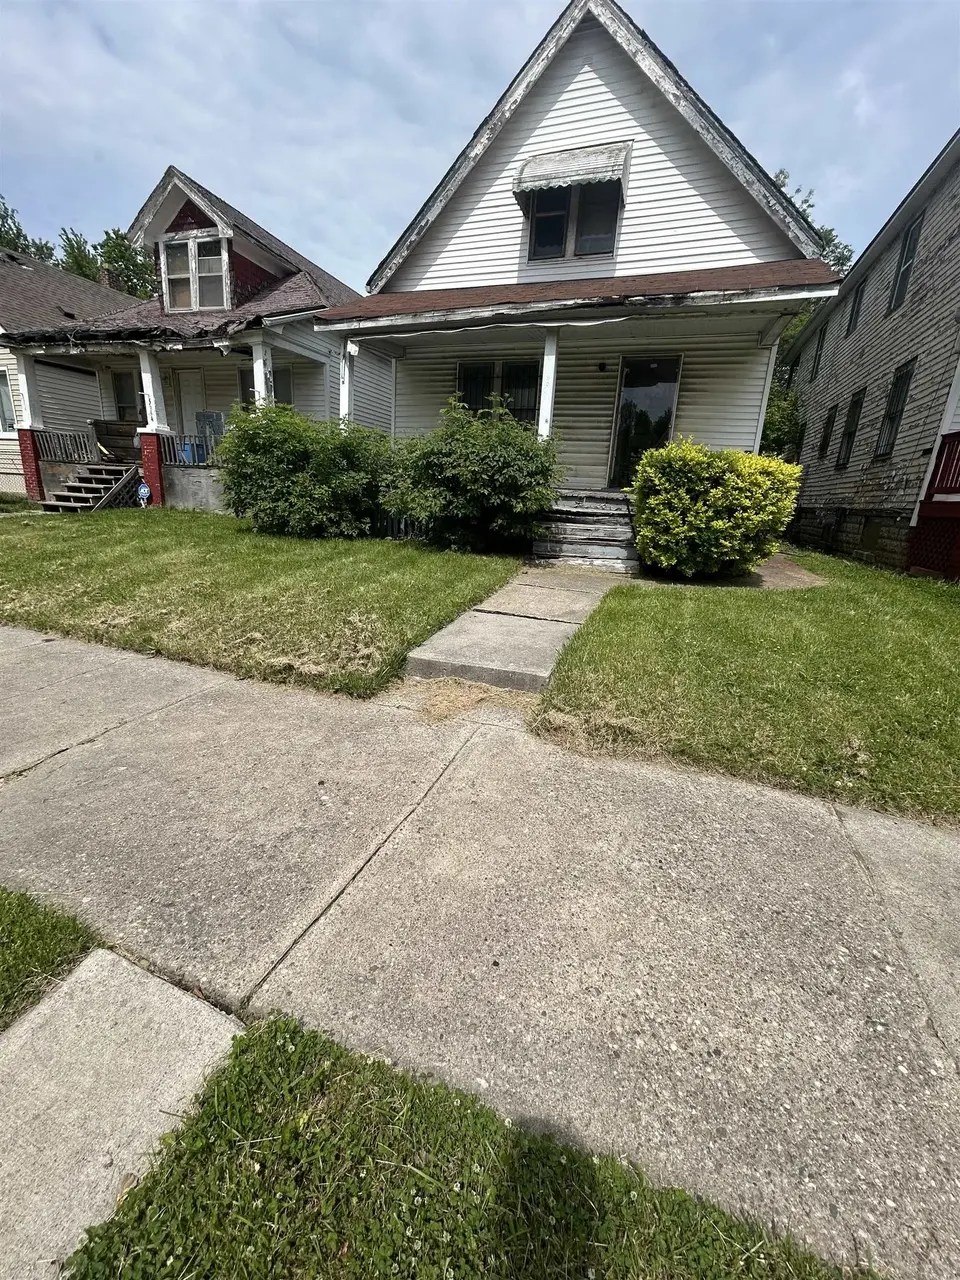
5338 Cadillac Ave · Detroit, MI
Flood risk 1/10 · Minimal
- FEMA flood zone
- X (unshaded)
- Chance of flooding over 30 yrs
- 0.0%
- Est. flood insurance / yr
- $473 – $860
Fire risk 1/10 · Minimal
- Est. fire insurance / yr
- $784 – $1,456
Heat risk 3/10 · Minor
- Hot days now (above 96°F)
- 7 days/yr
- Hot days in 30 yrs
- 15 days/yr
Wind risk 2/10 · Minimal
- Chance of severe wind over 30 yrs
- —
Air-quality risk 3/10 · Minor
- Unhealthy air days now
- 2 days/yr
- Unhealthy air days in 30 yrs
- 5 days/yr
Risk factors via First Street. Map © Google.
Why this score? — see what drove the B- grade
The composite is a weighted blend of 9 inputs, each scored 0–100. Each bar is that input's sub-score; the figure is the points it added to the 100-point composite (weight × sub-score).
- Cash flow +30.0/30.0
- 1% rule +10.0/10.0
- DSCR +10.0/10.0
- ARV discount +7.9/15.0
- Livability +3.7/5.0
- Rent growth +2.5/5.0
- Condition / age +2.5/5.0
- Schools +1.3/10.0
- Appreciation +0.0/10.0
$32,000
🖨 Deal sheet 📄 Offer letter ✓ Due diligence
Listing remarks MLS
Opportunity awaits with this 2-bedroom, 1-bath home ready for a complete transformation. This property requires a full rehabilitation and is being sold as-is, making it ideal for investors, renovators, or buyers looking to create their dream home from the ground up. With solid potential and a functional layout, this is your chance to add value and bring new life to a property in need of restoration. Whether you're planning a flip, rental, or personal residence, the possibilities are endless. BATVAI
Key facts
- 3,920 sq ft lot
- Built 1919
- Listed 3 days
Property features AI
Finance
- Other: Located in the Cadillac subdivision; cross streets Moffat Ave and Barker Ave
- Financial info: Annual tax amount listed (not included per instructions)
- HOA & community: Has homeowners association
Exterior
- Utilities: Public water; Public sewer
- Home design: Single-family residence; One level
- Construction: Vinyl siding; 872 square feet above grade
- Exterior features: Lot approximately 0.09 acres; Lot dimensions: 3920
Interior
- Bedrooms: 2 total rooms (includes bedrooms and living areas)
- Bathrooms: 1 full bathroom
- Heating & cooling: Forced air heating; Natural gas heating; No central cooling
- Interior features: Has basement
Neighborhood map
What this means for you Summary
Snapshot
- This is a 2-bed/1.0-bath single-family listed at $32k.
Deal economics
- At list price, monthly cash flow is $644 ($8k/yr) — positive.
- The deal already cash-flows at list — no discount required.
- Meets the 1% rule at list price ($1k rent vs $32k).
- Cap rate 30.5% vs local median 10.2% in Detroit — top-decile yield for the area; either an underpriced asset or a hidden risk that comps aren't pricing in. Stress-test before assuming the spread holds.
Location & tenants
- Location reads 73/100 on livability (#218 in MI) — a middle-class / working-renter tenant base. Strengths: amenities A+, commute A+, cost of living A+; Watch: schools F, crime F, employment F.
- Detroit Public Schools Community District (urban): math 10% / reading 24% proficiency, ranked #499 of 540 in MI (top 92%) — low school quality limits family demand, transient renter base, plan for 1-2y turnover; 90% free/reduced lunch — lower-income household profile, screen leases tightly.
- Market conditions: 190 active listings in the ZIP; 21 comparable units currently listed for rent nearby; rentals at typical pace (median 18d on market — plan ~3-4 weeks tenant-placement turnaround); lower-income renter base — watch delinquency; 2,639 units permitted in Wayne County in 2024 (1,216 in 5+ unit buildings).
- This rent runs 39% of the median local income ($34k/yr) — at the standard rent-burdened threshold; future hikes will face affordability resistance.
Forward outlook
- Local home prices are declining (-3.0%/yr); year-one equity from $221 of loan paydown is wiped out by about $960 of value loss. Plan a longer hold.
- Wayne County population projected at -17% by 2050 — secular population decline; favor cash flow + early exit over multi-decade hold.
- At projected returns (-3.0% appreciation + 3.0% rent growth), your $9k cash investment doubles in ~2 years — after that, you're playing with house money.
Negotiation context
- Only 3 days on market — expect competitive offers; lowballing is unlikely to land.
- 2 sale attempts with the ask held roughly flat each time — persistent listings suggest the price (not the market) is what's stuck; bring a comps-based counter.
- Current owner paid $6k; list at $32k implies a 392% gain — meaningful room to come down on a strong offer.
Risks & watch-outs
- Watch-outs: built in 1919 — expect roof / HVAC / electrical / plumbing capex.
Questions for the listing agent
- Built in 1919 — when were the roof, HVAC, electrical panel, plumbing, and water heater last replaced?
- Is there a deadline driving the sale (1031 exchange, divorce, estate, relocation)? That informs how much negotiation room exists.
- Schools are F-rated, which usually means shorter tenancies and higher turnover. Who's the typical renter profile here, and what's been the actual vacancy rate?
- Crime grade is F in this area — have there been break-ins, vandalism, or insurance claims at this property in the last 3 years? What carrier currently insures it and at what premium?
- What's the average days-on-market for RENTAL listings here right now (not sales)? A rising rental-DOM trend means longer vacancies and softer asking-rent achievability than the comps imply.
- What's the recent tenant-quality profile in this submarket — average credit score on applications, eviction rate, late-payment / NSF rate, and stable-employment percentage? A property-management company in the area should have these aggregated.
- How much new for-sale + rental construction is in the pipeline within 1–3 miles? Heavy new supply typically softens prices + rents 12–24 months out; constrained supply supports both.
Investment metrics
- 1% rule
- 3.42% ✓
- Cap rate
- 30.46%
- Cash-on-cash
- 86.30%
- DSCR
- 4.84
- GRM
- 2.4
CMA / ARV
- ARV (on-the-fly)
- $32,264
- Comps found
- 8
Show comp detail 8 sales within ~0.75 mi
| Address | Dist | Beds/Ba | Sqft | Sold | Price | $/sf | Match |
|---|---|---|---|---|---|---|---|
| 5071 Saint Clair St | 0.27mi | 3/1.0 (+1) | 872 (0%) | 1mo | $12,000 | $14 | 82 |
| 5081 Belvidere St | 0.33mi | 2/1.0 | 890 (+2%) | 17mo | $68,000 | $76 | 67 |
| 5232 Mcclellan St | 0.22mi | 3/1.0 (+1) | 1,001 (+15%) | 0mo | $33,000 | $33 | 60 |
| 4482 Harding St | 0.55mi | 3/1.0 (+1) | 847 (-3%) | 15mo | $20,000 | $24 | 52 |
| 5398 Cooper St | 0.14mi | 3/1.0 (+1) | 998 (+14%) | 18mo | $67,500 | $68 | 50 |
| 5325 Fischer St | 0.56mi | 2/1.0 | 787 (-10%) | 19mo | $28,000 | $36 | 42 |
| 4846 Crane St | 0.54mi | 2/1.0 | 750 (-14%) | 15mo | $30,000 | $40 | 39 |
| 4177 Cadillac Blvd | 0.66mi | 2/1.5 | 950 (+9%) | 16mo | $35,000 | $37 | 39 |
Match score weights: distance 35% · size 25% · config 20% · recency 20%. Top-matched comps best support the ARV.
Projected returns pro-forma
-3.0% appreciation · 3.0% rent growth · sell at horizon
- IRR
- 86.8%
- Equity multiple
- 5.00×
- Total profit
- $35,872
- Equity at exit
- $4,771
- IRR
- 89.9%
- Equity multiple
- 10.39×
- Total profit
- $84,151
- Equity at exit
- $2,767
Cash invested: $8,960 (down + closing). Projections, not guarantees.
Landlord ↔ Tenant lean methodology
- Overall (STATE)
- 62 Landlord-Friendly
- State Michigan
- 62 Landlord-Friendly · EVEN
- County
- — inherits STATE
- City
- — inherits STATE
ZIP-level market 48213
- Active inventory
- 190
- Price-to-rent
- 2.4×
Monthly cashflow live
- Estimated rent
- $1,096 high interval (Pro) →
- Mortgage (P&I)
- −$168
- Tax est. 1.5%
- −$40 /mo · $480/yr
- Insurance
- −$13
- HOA
- −$0
- Vacancy / Maint / Mgmt
- −$230
- Net cashflow
- $644
Break-even live
UW: 25.0% down · 7.5% · 30yr · 1.5% tax · 5.0% vac · 8.0% maint · 8.0% mgmt
Financing live
Cash to close
- Down payment
- $8,000
- Closing costs
- $960
- Reserves months
- —
- Total cash needed
- —
Loan-product check · same deal, 3 products live
Conventional
25% down · 7.5% · 30yr
- Down + closing
- —
- Monthly P&I
- —
- Monthly cashflow
- —
- DSCR
- —
- Eligible?
- —
Personal DTI + credit; lowest rate.
DSCR
20% down · 8.5% · 30yr
- Down + closing
- —
- Monthly P&I
- —
- Monthly cashflow
- —
- DSCR
- —
- Eligible?
- —
No personal income docs; deal must DSCR.
Hard money
10% down · 12.0% · 12mo
- Down + closing
- —
- Monthly P&I
- —
- Monthly cashflow
- —
- DSCR
- —
- Eligible?
- —
Short-term bridge; refi at stabilization.
Rent comps 21 comps
| Address | Beds | Baths | Sqft | Rent | $/sqft | DOM | Units | Dist |
|---|---|---|---|---|---|---|---|---|
| 5342 Cooper St Detroit, MI | 3.0 | 1.0 | 1125 | $1,200 | $1.07 | 24d | 1 | 0.10mi |
| 4735 Rohns St Unit 2A Detroit, MI | 1.0 | 1.0 | 700 | $900 | $1.29 | 1d | 1 | 0.52mi |
| 4735 Rohns St Unit 6A Detroit, MI | 2.0 | 1.0 | 850 | $1,100 | $1.29 | 1d | 1 | 0.52mi |
| 4735 Rohns St Unit 4A Detroit, MI | 2.0 | 1.0 | 850 | $1,000 | $1.18 | 1d | 1 | 0.52mi |
| 4190 Hurlbut St Unit 2 Detroit, MI | 2.0 | 1.0 | 900 | $945 | $1.05 | 14d | 1 | 0.64mi |
| 3954 Saint Clair St Unit 2 Detroit, MI | 1.0 | 1.0 | 1080 | $650 | $0.60 | 11d | 1 | 0.68mi |
| 5380 Maxwell St Unit 5380 Detroit, MI | 2.0 | 1.0 | 1100 | $900 | $0.82 | 17d | 1 | 0.78mi |
| 9354 Bessemore St Detroit, MI | 3.0 | 1.0 | 1125 | $1,294 | $1.15 | 17d | 1 | 0.85mi |
| 4055 Beniteau St Detroit, MI | 2.0 | 1.0 | 1000 | $900 | $0.90 | 17d | 1 | 0.89mi |
| 3937 Beniteau St Detroit, MI | 2.0 | 1.0 | 900 | $950 | $1.06 | 14d | 1 | 0.96mi |
| 3501 Garland St Detroit, MI | 2.0 | 1.0 | 1000 | $900 | $0.90 | 24d | 1 | 0.98mi |
| 3495 Garland St Detroit, MI | 2.0 | 1.0 | 1100 | $900 | $0.82 | 43d | 1 | 0.99mi |
| 9142 Isham Detroit, MI | 3.0 | 1.0 | 1000 | $1,344 | $1.34 | 17d | 1 | 1.07mi |
| 3475 Crane St Detroit, MI | 3.0 | 1.5 | 1000 | $1,338 | $1.34 | 43d | 1 | 1.10mi |
| 3032 Hurlbut St Unit 1 Detroit, MI | 2.0 | 1.0 | 950 | $900 | $0.95 | 3d | 1 | 1.13mi |
| 3049 Montclair St Unit 1 Detroit, MI | 2.0 | 1.0 | 850 | $950 | $1.12 | 43d | 1 | 1.15mi |
| 8545 Maxwell St Unit 8525 8525 2 Detroit, MI | 1.0 | 1.0 | 750 | $850 | $1.13 | 43d | 1 | 1.17mi |
| 8215 Badger St Detroit, MI | 2.0 | 1.0 | 1000 | $1,000 | $1.00 | 14d | 1 | 1.23mi |
| 2544 Cadillac Blvd Unit 2 Detroit, MI | 2.0 | 1.0 | 973 | $825 | $0.85 | 23d | 1 | 1.36mi |
| 2282 Belvidere St Unit 102 Detroit, MI | 2.0 | 2.0 | 1000 | $1,250 | $1.25 | 43d | 1 | 1.44mi |
| 8193 Traverse St Detroit, MI | 3.0 | 1.0 | 1055 | $1,382 | $1.31 | 17d | 1 | 1.47mi |
Listing history 4 events
-
2026-06-18days on market $32,000 Active 3 DOM
-
2026-06-17days on market $32,000 Active 2 DOM
-
2026-06-16remarks 503-char remark
Show marketing remark (503 chars)
Opportunity awaits with this 2-bedroom, 1-bath home ready for a complete transformation. This property requires a full rehabilitation and is being sold as-is, making it ideal for investors, renovators, or buyers looking to create their dream home from the ground up. With solid potential and a functional layout, this is your chance to add value and bring new life to a property in need of restoration. Whether you're planning a flip, rental, or personal residence, the possibilities are endless. BATVAI
-
2026-06-16$32,000 Active 1 DOM
Show marketing remark (503 chars)
Opportunity awaits with this 2-bedroom, 1-bath home ready for a complete transformation. This property requires a full rehabilitation and is being sold as-is, making it ideal for investors, renovators, or buyers looking to create their dream home from the ground up. With solid potential and a functional layout, this is your chance to add value and bring new life to a property in need of restoration. Whether you're planning a flip, rental, or personal residence, the possibilities are endless. BATVAI
ⓘ Source: listings_history table (triggers on properties + properties_extension) + one-shot
backfill from property_details.listing_events for pre-trigger history.
Climate risk First Street
- Flood 1/10 Low FEMA zone X (unshaded) · 0% chance over 30 yrs
- Wildfire 1/10 Low
- Heat 3/10 Moderate 7 d/yr ≥96°F today · 15 d/yr by 30 yrs out
- Wind 2/10 Low
- Air quality 3/10 Moderate 2 unhealthy d/yr today · 5 by 30 yrs out
Nearby sold comps map
Loading sold comps map…
Walkable amenities ~0.75 mi
Loading nearby amenities…
Taxation est. · year 1
- Rental income
- $13,147
- − Mortgage interest
- −$1,792
- − Property taxes
- −$480
- − Insurance
- −$160
- − Repairs & maintenance
- −$1,052
- − Management
- −$1,052
- − Depreciation
- −$931
- Taxable income
- $7,680
- Est. tax owed @ 24.0%
- −$1,843
- After-tax cash flow
- $5,889/yr
For passive investors: Depreciation is non-cash, so a rental often shows a tax loss while cash-flowing — sheltering income. Rental losses are passive: they offset passive income freely, and up to $25,000/yr can offset ordinary (W-2) income if you actively participate and your MAGI is under $100k (phasing out to $0 by $150k); unused losses carry forward. On sale, claimed depreciation is recaptured at up to 25%, and gains may owe capital-gains tax (a 1031 exchange can defer both). Figures are a year-1 estimate at your 24.0% rate — not tax advice; consult a CPA.
Schools (NCES district)
- District
- Detroit Public Schools Community District
- NCES district ID
- 2601103
- Math proficiency
- 10% ▼ -2.00%
- Reading proficiency
- 24% ▲ 6.00%
- Median HH income
- $25,815
- Composite
- 13.06/100
- National rank
- #9564
- State rank
- #499 of 540 in MI
Livability — Detroit
- Score
- 73/100
- State rank
- #218
- US rank
- #5427
Category grades
Schools grade is shown separately in the Schools card above.
Census & demographics
- Census place
- Detroit, MI
- County
- Wayne County · 1,562,939 people
- City population
- 572,865
- Metro
- Detroit-Warren-Dearborn, MI
- Population (ZIP)
- 20,075
- Household income
- $34,003
- Rent vs Own
- Severe rent burden
- 1202.0
Population outlook (Wayne County) Hauer SSP2
- Today (2025)
- 1,675,273 people
- By 2030
- 1,620,300 · -3.3%
- By 2040
- 1,502,341 · -10.3%
- By 2050
- 1,384,039 · -17.4%
- By 2075
- 1,124,592 · -32.9%
- By 2100
- 881,193 · -47.4%
Race, ethnicity, and origin ACS 2023
- Neighborhood character
- Predominantly Black (92%)
- Race & ethnicity
- Black 92% White 4% Hispanic / Latino 2% Two or more races 1%
- Common ancestry
- Slovak 1%
- Foreign-born
- 2% · Canada
- Languages at home
- 97% English-only · Arabic 1% Spanish 1%
Political lean MEDSL · Wayne
- 2024 margin
- Strong D (+29.0) · D 62.7% · R 33.7% · Other 3.6%
- 2008→2024 swing
- -20.5pp toward R · 2008: 49.5pp · 2024: 29.0pp
- All cycles
- 2024: D+29.0 2020: D+38.1 2016: D+37.3 2012: D+46.9 2008: D+49.5
Not yet ingested
- Civics
- —
Market trends
- HPI YoY
- ▼ -122.86%
- Current HPI
- 217.2037
- Rent YoY
- —
- Metro
- Detroit-Warren-Dearborn, MI
- State GDP YoY
- ▲ 1.37%
- F500 in state
- 28
Industry mix (Fortune 500 HQ in MI)
| Industry | F500 HQs | Revenue |
|---|---|---|
| Automotive Parts | 3 | $48B |
|
||
| Automotive | 2 | $372B |
|
||
| Chemicals | 1 | $45B |
|
||
| Automotive Retail | 1 | $29B |
|
||
| Healthcare / Medical Devices | 1 | $23B |
|
||
| Automotive Technology | 1 | $20B |
|
||
Price history
+392.3% since first listed3 events — show timeline
- 2026-06-16 Listed $32,000 MiRealSource-MiMLS
- 2026-06-16 Listed $32,000 REALCOMP
- 1998-01-05 Sold (Public Records) $6,500 Public Records
Property tax history
+5.2%/yrLatest (2025): $1,712 · +1.3% YoY. Source: county tax records.
Cash-flow waterfall
monthlySold comps — $/sqft
last 12 mo · ≤1 miLoading sold comps…