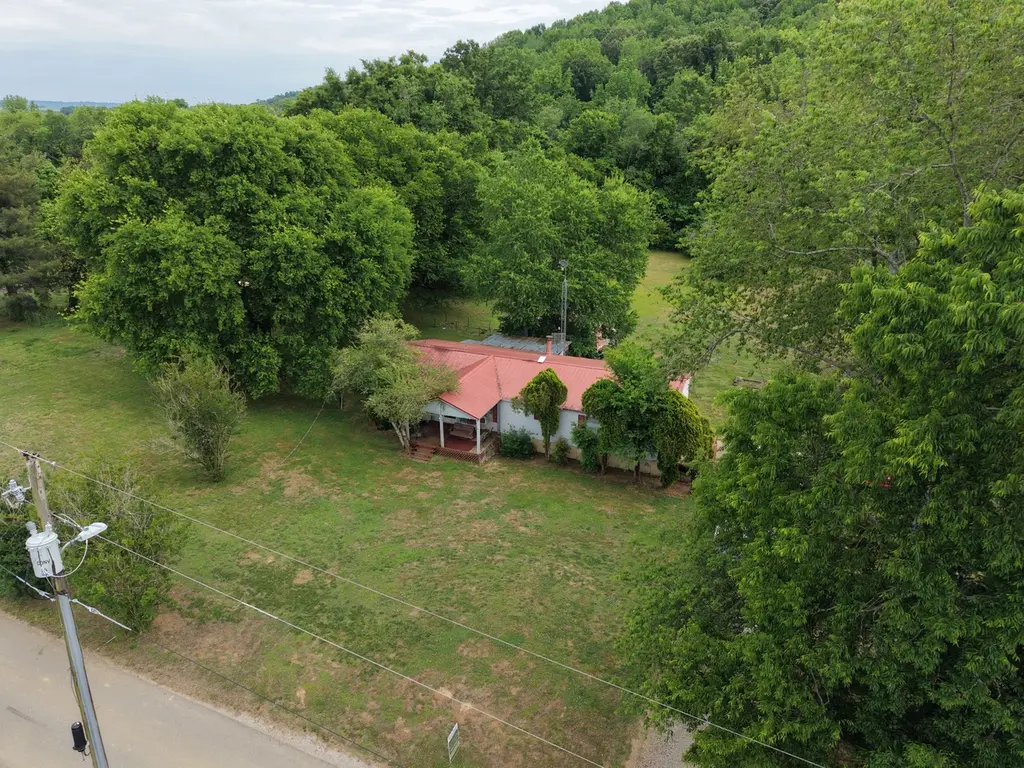
102 Sugar Tree Rd · Pulaski, TN
Flood risk 1/10 · Minimal
- FEMA flood zone
- X (unshaded)
- Chance of flooding over 30 yrs
- 0.0%
- Est. flood insurance / yr
- $507 – $1,088
Fire risk 4/10 · Minor
- Est. fire insurance / yr
- $949 – $1,763
Heat risk 5/10 · Moderate
- Hot days now (above 105°F)
- 7 days/yr
- Hot days in 30 yrs
- 19 days/yr
Wind risk 4/10 · Minor
- Chance of severe wind over 30 yrs
- 16.0%
Air-quality risk 2/10 · Minimal
- Unhealthy air days now
- 0 days/yr
- Unhealthy air days in 30 yrs
- 1 days/yr
Risk factors via First Street. Map © Google.
Why this score? — see what drove the C grade
The composite is a weighted blend of 9 inputs, each scored 0–100. Each bar is that input's sub-score; the figure is the points it added to the 100-point composite (weight × sub-score).
- Cash flow +25.1/30.0
- DSCR +8.2/10.0
- ARV discount +7.5/15.0
- 1% rule +5.2/10.0
- Livability +3.2/5.0
- Rent growth +2.5/5.0
- Condition / age +2.5/5.0
- Schools +1.9/10.0
- Appreciation +0.0/10.0
$129,000
🖨 Deal sheet 📄 Offer letter ✓ Due diligence
Listing remarks
Situated on 2.55 acres with road frontage along Sugar Tree Rd, Ross Rd, and Prospect Rd, this 3-bedroom, 2-bath home offers the perfect blend of space, privacy, and country charm. With 1,680 sq ft of living space, the home features a spacious layout with a large living room and an open, inviting kitchen ideal for everyday living and entertaining. Enjoy peaceful mornings or relaxing evenings on the welcoming front porch complete with a swing. Out back, an additional covered porch provides extra storage space, along with two detached storage sheds for tools, equipment, or hobbies. The property offers scenic views of a neighboring pond, adding to the tranquil setting without the upkeep. The be
Key facts
- 2.55 acre lot
- Built 1994
- Listed 43 days
Property features AI
Finance
- Other: Approximate year built
Exterior
- Parking: No covered parking listed; No parking total listed
- Security: Fire alarm and smoke detectors
- Utilities: Public water; Public sewer; Water available
- Home design: Residential mobile home; One story
- Construction: Vinyl siding
- Exterior features: 2.55-acre lot
Interior
- Kitchen: No appliances listed
- Bedrooms: 3 bedrooms (all on the main level)
- Flooring: Tile
- Bathrooms: 2 full bathrooms
- Heating & cooling: No central heating listed; Wall/window air conditioning units
- Interior features: Tile floors; Crawl space basement; Wall/window air conditioning units; Fire alarm and smoke detectors
- Laundry & utility: No laundry appliances listed
Neighborhood map
What this means for you Summary
Snapshot
- This is a 3-bed/2.0-bath other listed at $129k.
Deal economics
- At list price, monthly cash flow is $287 ($3k/yr) — positive.
- The deal already cash-flows at list — no discount required.
- Meets the 1% rule at list price ($1k rent vs $129k).
- Recommended offer: $125k (3.0% below list) — sets the bar for market timing.
- Cap rate 9.0% vs local median 2.7% in Pulaski — top-decile yield for the area; either an underpriced asset or a hidden risk that comps aren't pricing in. Stress-test before assuming the spread holds.
Location & tenants
- Location reads 64/100 on livability (#174 in TN) — a middle-class / working-renter tenant base. Strengths: cost of living A+, housing A+; Watch: health & safety C-, crime F, amenities F.
- Giles County (rural): math 20% / reading 24% proficiency, ranked #105 of 139 in TN (top 76%) — low school quality limits family demand, transient renter base, plan for 1-2y turnover.
- Zoned schools: Pulaski Elementary (483 students, 0% FRL); Giles Co High School (math 8% / reading 22%, grade F, #237 of 332 statewide, top 75%, 703 students, 0% FRL) — zoned schools average 0% FRL vs 50% district-wide (50 pts lower); this property's tenant base skews higher-income than the district average.
- Market conditions: 186 active listings in the ZIP; 73 units permitted in Giles County in 2024 (0 in 5+ unit buildings).
Forward outlook
- Local home prices are declining (-3.0%/yr); year-one equity from $892 of loan paydown is wiped out by about $4k of value loss. Plan a longer hold.
- Giles County population projected at -10% by 2050 — secular population decline; favor cash flow + early exit over multi-decade hold.
Negotiation context
- It's been on market 44 days — a 3% lower offer ($125k) is reasonable based on typical stale-listing flexibility.
- Current owner paid $58k; list at $129k implies a 122% gain — meaningful room to come down on a strong offer.
Risks & watch-outs
- Climate carrying-cost: extreme-heat days projected 7→19/yr by 2055 (HVAC capex compounding) — expect insurance premiums to compound above CPI over the hold.
Questions for the listing agent
- It's been on market 44 days. Have you received any prior offers? Is the seller open to a 3% concession, seller financing, or rate buy-down credit?
- Is there a deadline driving the sale (1031 exchange, divorce, estate, relocation)? That informs how much negotiation room exists.
- Schools are F-rated, which usually means shorter tenancies and higher turnover. Who's the typical renter profile here, and what's been the actual vacancy rate?
- Crime grade is F in this area — have there been break-ins, vandalism, or insurance claims at this property in the last 3 years? What carrier currently insures it and at what premium?
- What's the average days-on-market for RENTAL listings here right now (not sales)? A rising rental-DOM trend means longer vacancies and softer asking-rent achievability than the comps imply.
- What's the recent tenant-quality profile in this submarket — average credit score on applications, eviction rate, late-payment / NSF rate, and stable-employment percentage? A property-management company in the area should have these aggregated.
- How much new for-sale + rental construction is in the pipeline within 1–3 miles? Heavy new supply typically softens prices + rents 12–24 months out; constrained supply supports both.
Investment metrics
- 1% rule
- 1.02% ✓
- Cap rate
- 8.96%
- Cash-on-cash
- 9.53%
- DSCR
- 1.42
- GRM
- 8.2
CMA / ARV
No comps found within radius.
Projected returns pro-forma
-3.0% appreciation · 3.0% rent growth · sell at horizon
- IRR
- -2.0%
- Equity multiple
- 0.93×
- Total profit
- $-2,699
- Equity at exit
- $19,234
- IRR
- 7.7%
- Equity multiple
- 1.58×
- Total profit
- $20,911
- Equity at exit
- $11,154
Cash invested: $36,120 (down + closing). Projections, not guarantees.
Landlord ↔ Tenant lean methodology
- Overall (STATE)
- 87 Strongly Landlord-Friendly
- State Tennessee
- 87 Strongly Landlord-Friendly · R+13
- County
- — inherits STATE
- City
- — inherits STATE
ZIP-level market 38478
- Home prices YoY
- -12.7%
- Active inventory
- 186
- Price-to-rent
- 8.2×
Monthly cashflow live
- Estimated rent
- $1,317 medium interval (Pro) →
- Mortgage (P&I)
- −$676
- Tax from tax record
- −$23 /mo · $277/yr
- Insurance
- −$54
- HOA
- −$0
- Vacancy / Maint / Mgmt
- −$277
- Net cashflow
- $287
Break-even live
UW: 25.0% down · 7.5% · 30yr · 1.5% tax · 5.0% vac · 8.0% maint · 8.0% mgmt
Financing live
Cash to close
- Down payment
- $32,250
- Closing costs
- $3,870
- Reserves months
- —
- Total cash needed
- —
Loan-product check · same deal, 3 products live
Conventional
25% down · 7.5% · 30yr
- Down + closing
- —
- Monthly P&I
- —
- Monthly cashflow
- —
- DSCR
- —
- Eligible?
- —
Personal DTI + credit; lowest rate.
DSCR
20% down · 8.5% · 30yr
- Down + closing
- —
- Monthly P&I
- —
- Monthly cashflow
- —
- DSCR
- —
- Eligible?
- —
No personal income docs; deal must DSCR.
Hard money
10% down · 12.0% · 12mo
- Down + closing
- —
- Monthly P&I
- —
- Monthly cashflow
- —
- DSCR
- —
- Eligible?
- —
Short-term bridge; refi at stabilization.
Listing history 16 events
-
2026-06-18days on market $129,000 Active 44 DOM
-
2026-06-17days on market $129,000 Active 43 DOM
-
2026-06-16days on market $129,000 Active 42 DOM
-
2026-06-15days on market $129,000 Active 41 DOM
-
2026-06-13days on market $129,000 Active 39 DOM
-
2026-06-12days on market $129,000 Active 38 DOM
-
2026-06-09days on market $129,000 Active 35 DOM
-
2026-06-08days on market $129,000 Active 34 DOM
-
2026-06-08days on market $129,000 Active 33 DOM
-
2026-06-03days on market $129,000 Active 29 DOM
-
2026-06-02days on market $129,000 Active 28 DOM
-
2026-06-01days on market $129,000 Active 27 DOM
-
2026-05-31days on market $129,000 Active 26 DOM
-
2026-05-06$129,000 Active 1178-char remark
-
2026-05-06historical $129,000 1178-char remark
-
2002-03-14soldstatus $58,000
ⓘ Source: listings_history table (triggers on properties + properties_extension) + one-shot
backfill from property_details.listing_events for pre-trigger history.
Tax reassessment forecast TN · Resets to sale price
- Current annual tax
- $277 · $23/mo
- Projected year-2 tax
- $916 · $76/mo
- Expected delta
- +$639/yr (+$53/mo · 230.6%)
ⓘ Screening estimate from a state-policy table — verify with the county assessor before closing.
Climate risk First Street
- Flood 1/10 Low FEMA zone X (unshaded) · 0% chance over 30 yrs
- Wildfire 4/10 Moderate
- Heat 5/10 Major 7 d/yr ≥105°F today · 19 d/yr by 30 yrs out
- Wind 4/10 Moderate 16% chance of damaging wind over 30 yrs
- Air quality 2/10 Low 0 unhealthy d/yr today · 1 by 30 yrs out
Nearby sold comps map
Loading sold comps map…
Walkable amenities ~0.75 mi
Loading nearby amenities…
Taxation est. · year 1
- Rental income
- $15,800
- − Mortgage interest
- −$7,226
- − Property taxes
- −$277
- − Insurance
- −$645
- − Repairs & maintenance
- −$1,264
- − Management
- −$1,264
- − Depreciation
- −$3,753
- Taxable income
- $1,371
- Est. tax owed @ 24.0%
- −$329
- After-tax cash flow
- $3,113/yr
For passive investors: Depreciation is non-cash, so a rental often shows a tax loss while cash-flowing — sheltering income. Rental losses are passive: they offset passive income freely, and up to $25,000/yr can offset ordinary (W-2) income if you actively participate and your MAGI is under $100k (phasing out to $0 by $150k); unused losses carry forward. On sale, claimed depreciation is recaptured at up to 25%, and gains may owe capital-gains tax (a 1031 exchange can defer both). Figures are a year-1 estimate at your 24.0% rate — not tax advice; consult a CPA.
Schools (NCES district)
- District
- Giles County
- NCES district ID
- 4701410
- Math proficiency
- 20% ▼ -18.00%
- Reading proficiency
- 24% ▼ -7.00%
- Median HH income
- $40,318
- Composite
- 18.63/100
- National rank
- #8895
- State rank
- #105 of 139 in TN
Livability — Pulaski
- Score
- 64/100
- State rank
- #174
- US rank
- #14586
Category grades
Schools grade is shown separately in the Schools card above.
Census & demographics
- Population (ZIP)
- 18,756
Population outlook (Giles County) Hauer SSP2
- Today (2025)
- 28,505 people
- By 2030
- 27,960 · -1.9%
- By 2040
- 26,740 · -6.2%
- By 2050
- 25,665 · -10.0%
- By 2075
- 24,798 · -13.0%
- By 2100
- 25,524 · -10.5%
Race, ethnicity, and origin ACS 2023
- Neighborhood character
- Predominantly White (77%)
- Race & ethnicity
- White 77% Black 11% Two or more races 7% Hispanic / Latino 4%
- Common ancestry
- Serbian 3% Slovak 2% Lithuanian 1%
- Foreign-born
- 1% · Canada
- Languages at home
- 96% English-only · Spanish 3% German/W. Germanic 1%
Political lean MEDSL · Giles
- 2024 margin
- Solid R (+55.0) · D 22.1% · R 77.1%
- 2008→2024 swing
- -35.4pp toward R · 2008: -19.6pp · 2024: -55.0pp
- All cycles
- 2024: R+55.0 2020: R+49.1 2016: R+45.4 2012: R+29.2 2008: R+19.6
Not yet ingested
- Civics
- —
Market trends
- HPI YoY
- ▼ -46.60%
- Current HPI
- 319.6315
- Rent YoY
- —
- Metro
- —
- State GDP YoY
- ▲ 2.78%
- F500 in state
- 22
Industry mix (Fortune 500 HQ in TN)
| Industry | F500 HQs | Revenue |
|---|---|---|
| Healthcare | 3 | $91B |
|
||
| Retail | 3 | $72B |
|
||
| Transportation / Logistics | 1 | $88B |
|
||
| Paper / Packaging | 1 | $19B |
|
||
| Insurance | 1 | $13B |
|
||
| Energy | 1 | $12B |
|
||
Price history
+122.4% since first listed3 events — show timeline
- 2026-05-06 Listed $129,000 REALTRACS as Distributed by MLS Grid
- 2026-05-06 Coming Soon $129,000 REALTRACS as Distributed by MLS Grid
- 2002-03-14 Sold (Public Records) $58,000 Public Records
Property tax history
-1.6%/yrLatest (2025): $277 · +16.4% YoY. Source: county tax records.
Cash-flow waterfall
monthlySold comps — $/sqft
last 12 mo · ≤1 miLoading sold comps…