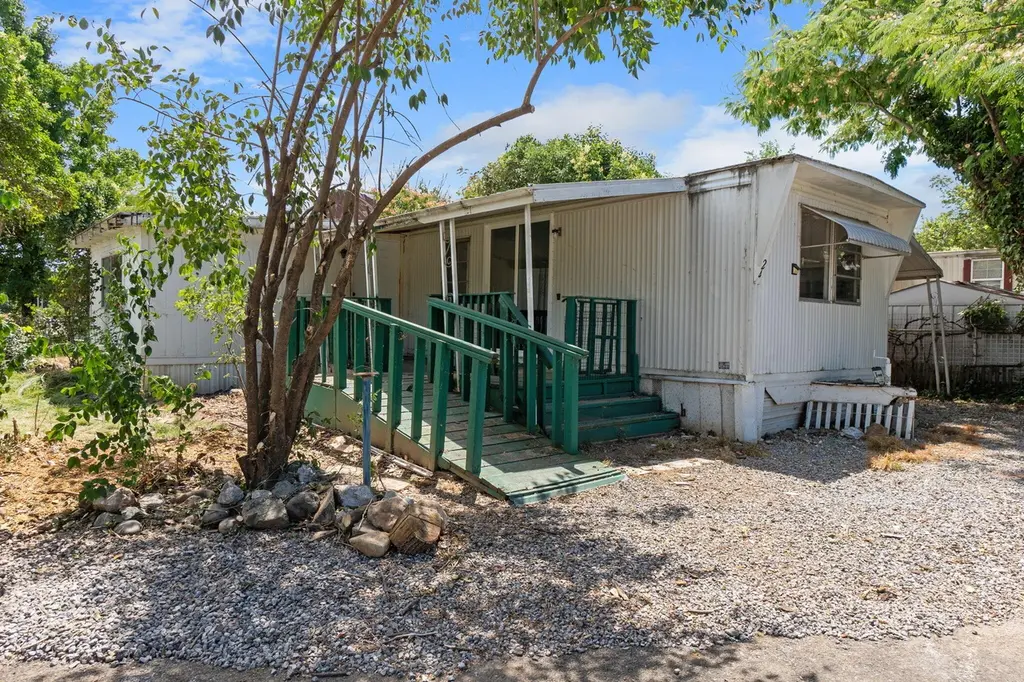
2200 Jewell Ln #24 · Redding, CA
Flood risk 7/10 · Major
- FEMA flood zone
- AE
- Chance of flooding over 30 yrs
- 0.99%
- Est. flood insurance / yr
- $1,737 – $8,500
Fire risk 8/10 · Major
- Est. fire insurance / yr
- $659 – $1,223
Heat risk 8/10 · Major
- Hot days now (above 105°F)
- 6 days/yr
- Hot days in 30 yrs
- 15 days/yr
Wind risk 1/10 · Minimal
- Chance of severe wind over 30 yrs
- —
Air-quality risk 10/10 · Severe
- Unhealthy air days now
- 33 days/yr
- Unhealthy air days in 30 yrs
- 38 days/yr
Risk factors via First Street. Map © Google.
Why this score? — see what drove the C grade
The composite is a weighted blend of 9 inputs, each scored 0–100. Each bar is that input's sub-score; the figure is the points it added to the 100-point composite (weight × sub-score).
- Cash flow +15.0/30.0
- ARV discount +15.0/15.0
- 1% rule +5.0/10.0
- DSCR +5.0/10.0
- Schools +4.6/10.0
- Rent growth +4.4/5.0
- Livability +3.8/5.0
- Condition / age +2.2/5.0
- Appreciation +0.0/10.0
$24,000
🖨 Deal sheet 📄 Offer letter ✓ Due diligence
Listing remarks
Welcome to this charming single-wide mobile home offering 1 bedroom and 1 bathroom with a thoughtfully designed, open-concept layout. Nestled within the Rolling Ranch Mobile Estates this home combines comfort, functionality, and affordability. Residents enjoy the benefits of a welcoming, family-friendly, and dog-friendly community, making it the perfect place to relax and call home.
Key facts
- Listed 10 days
Property features AI
Exterior
- Home design: Manufactured in park (Mobile Home)
- Construction: Aluminum siding construction
- Exterior features: Aluminum siding
Interior
- Interior features: 720 square feet (approx.)
Neighborhood map
What this means for you Summary
Snapshot
- This is a 1-bed/1.0-bath manufactured listed at $24k. Condition is rated fair.
Deal economics
- At list price, monthly cash flow is $405 ($5k/yr) — positive.
- The deal already cash-flows at list — no discount required.
- Meets the 1% rule at list price ($1k rent vs $24k).
- Cap rate 47.9% vs local median 3.3% in Redding — top-decile yield for the area; either an underpriced asset or a hidden risk that comps aren't pricing in. Stress-test before assuming the spread holds.
Location & tenants
- Location reads 76/100 on livability (#106 in CA, #3,726 nationally) — a middle-class / working-renter tenant base. Strengths: amenities A+, commute A+, health & safety A+; Watch: employment C-, crime F, cost of living F.
- Shasta Union High (urban): math 41% / reading 67% proficiency, ranked #122 of 517 in CA (top 24%) — acceptable for families but not a draw, mixed tenant base, ~2y average lease; only 16% free/reduced lunch — higher-income household profile.
- Market conditions: Rents rising fast (+7.5%/yr); 331 active listings in the ZIP; 246 units permitted in Shasta County in 2024 (0 in 5+ unit buildings).
Forward outlook
- Local home prices are declining (-3.0%/yr); year-one equity from $166 of loan paydown is wiped out by about $720 of value loss. Plan a longer hold.
- Shasta County population projected to shrink 9% by 2050 — rents likely to lag national; underwrite the cash flow, not the appreciation.
- At projected returns (-3.0% appreciation + 7.5% rent growth), your $7k cash investment doubles in ~2 years — after that, you're playing with house money.
Negotiation context
- Only 11 days on market — expect competitive offers; lowballing is unlikely to land.
Risks & watch-outs
- Watch-outs: flood insurance adds $427/mo.
- Climate carrying-cost: in FEMA flood zone AE (mandatory federal flood insurance); severe wildfire risk; extreme-heat days projected 6→15/yr by 2055 (HVAC capex compounding) — expect insurance premiums to compound above CPI over the hold.
Questions for the listing agent
- Have any recent inspections been done? Can we get a copy of the seller's disclosures and any deferred-maintenance estimates?
- What's the actual annual flood-insurance premium (NFIP or private), and is the property in a SFHA with mandatory coverage?
- Is there a deadline driving the sale (1031 exchange, divorce, estate, relocation)? That informs how much negotiation room exists.
- Schools are B-rated — typically a magnet for longer-tenancy family renters. What's the average tenant stay here, and is there a school-zone premium baked into asking?
- Crime grade is F in this area — have there been break-ins, vandalism, or insurance claims at this property in the last 3 years? What carrier currently insures it and at what premium?
- What's the average days-on-market for RENTAL listings here right now (not sales)? A rising rental-DOM trend means longer vacancies and softer asking-rent achievability than the comps imply.
- What's the recent tenant-quality profile in this submarket — average credit score on applications, eviction rate, late-payment / NSF rate, and stable-employment percentage? A property-management company in the area should have these aggregated.
- How much new for-sale + rental construction is in the pipeline within 1–3 miles? Heavy new supply typically softens prices + rents 12–24 months out; constrained supply supports both.
Investment metrics
- 1% rule
- 5.26% ✓
- Cap rate
- 47.89%
- Cash-on-cash
- 148.55%
- DSCR
- 7.61
- GRM
- 1.6
CMA / ARV
- ARV (on-the-fly)
- $40,320
- Comps found
- 11
Show comp detail 11 sales within ~0.75 mi
| Address | Dist | Beds/Ba | Sqft | Sold | Price | $/sf | Match |
|---|---|---|---|---|---|---|---|
| 2200 Jewell Ln #16 | 0.04mi | 2/1.0 (+1) | 742 (+3%) | 2mo | $59,999 | $81 | 86 |
| 2237 Jewell Ln #2 | 0.14mi | 2/1.0 (+1) | 720 (0%) | 6mo | $27,500 | $38 | 83 |
| 2200 Jewell Ln #28 Ln Unit Rolling Ranch Mobile Home | 0.04mi | 2/1.0 (+1) | 728 (+1%) | 12mo | $62,000 | $85 | 81 |
| 2237 Jewell Ln #4 | 0.14mi | 2/1.0 (+1) | 750 (+4%) | 8mo | $49,900 | $67 | 75 |
| 2237 Jewell Ln #7 | 0.14mi | 2/1.0 (+1) | 728 (+1%) | 15mo | $30,000 | $41 | 74 |
| 2200 Jewell Ln Ln #2 | 0.04mi | 2/1.0 (+1) | 750 (+4%) | 24mo | $69,900 | $93 | 66 |
| 5812 Cedars Rd #19 | 0.25mi | 2/1.0 (+1) | 660 (-8%) | 5mo | $12,500 | $19 | 66 |
| 2237 Jewell Ln Ln #20 | 0.14mi | 1/1.0 | 660 (-8%) | 19mo | $24,000 | $36 | 63 |
| 5812 Cedars Rd #35 | 0.25mi | 2/1.0 (+1) | 672 (-7%) | 12mo | $14,000 | $21 | 62 |
| 2200 Jewell Ln #8 Ln Unit Rolling Ranch Mobile Home Park | 0.04mi | 2/1.0 (+1) | 798 (+11%) | 16mo | $59,900 | $75 | 62 |
| 5812 Cedars Rd #31 | 0.20mi | 2/1.0 (+1) | 800 (+11%) | 16mo | $45,000 | $56 | 54 |
Match score weights: distance 35% · size 25% · config 20% · recency 20%. Top-matched comps best support the ARV.
Projected returns pro-forma
-3.0% appreciation · 7.55% rent growth · sell at horizon
- IRR
- 81.1%
- Equity multiple
- 5.20×
- Total profit
- $28,254
- Equity at exit
- $3,578
- IRR
- 86.4%
- Equity multiple
- 13.83×
- Total profit
- $86,248
- Equity at exit
- $2,075
Cash invested: $6,720 (down + closing). Projections, not guarantees.
Landlord ↔ Tenant lean methodology
- Overall (STATE)
- 18 Strongly Tenant-Friendly
- State California
- 18 Strongly Tenant-Friendly · D+13
- County
- — inherits STATE
- City
- — inherits STATE
ZIP-level market 96001
- Rents YoY
- 7.5%
- Active inventory
- 331
- Price-to-rent
- 1.6×
Monthly cashflow live
- Estimated rent
- $1,263 medium interval (Pro) →
- Mortgage (P&I)
- −$126
- Tax est. 1.5%
- −$30 /mo · $360/yr
- Insurance
- −$10
- Flood insurance flood zone
- −$427 /mo · $5,118/yr
- HOA
- −$0
- Vacancy / Maint / Mgmt
- −$265
- Net cashflow
- $405
Break-even live
UW: 25.0% down · 7.5% · 30yr · 1.5% tax · 5.0% vac · 8.0% maint · 8.0% mgmt
Financing live
Cash to close
- Down payment
- $6,000
- Closing costs
- $720
- Reserves months
- —
- Total cash needed
- —
Loan-product check · same deal, 3 products live
Conventional
25% down · 7.5% · 30yr
- Down + closing
- —
- Monthly P&I
- —
- Monthly cashflow
- —
- DSCR
- —
- Eligible?
- —
Personal DTI + credit; lowest rate.
DSCR
20% down · 8.5% · 30yr
- Down + closing
- —
- Monthly P&I
- —
- Monthly cashflow
- —
- DSCR
- —
- Eligible?
- —
No personal income docs; deal must DSCR.
Hard money
10% down · 12.0% · 12mo
- Down + closing
- —
- Monthly P&I
- —
- Monthly cashflow
- —
- DSCR
- —
- Eligible?
- —
Short-term bridge; refi at stabilization.
Listing history 10 events
-
2026-06-19days on market $24,000 Active 11 DOM
-
2026-06-18days on market $24,000 Active 10 DOM
-
2026-06-17days on market $24,000 Active 9 DOM
-
2026-06-16days on market $24,000 Active 8 DOM
-
2026-06-15days on market $24,000 Active 7 DOM
-
2026-06-14days on market $24,000 Active 5 DOM
-
2026-06-13days on market $24,000 Active 4 DOM
-
2026-06-10days on market $24,000 Active 2 DOM
-
2026-06-09remarks 385-char remark
-
2026-06-09$24,000 Active 1 DOM
ⓘ Source: listings_history table (triggers on properties + properties_extension) + one-shot
backfill from property_details.listing_events for pre-trigger history.
Climate risk First Street
- Flood 7/10 Severe FEMA zone AE · 99% chance over 30 yrs
- Wildfire 8/10 Severe
- Heat 8/10 Severe 6 d/yr ≥105°F today · 15 d/yr by 30 yrs out
- Wind 1/10 Low
- Air quality 10/10 Extreme 33 unhealthy d/yr today · 38 by 30 yrs out
Nearby sold comps map
Loading sold comps map…
Walkable amenities ~0.75 mi
Loading nearby amenities…
Taxation est. · year 1
- Rental income
- $15,155
- − Mortgage interest
- −$1,344
- − Property taxes
- −$360
- − Insurance
- −$5,238
- − Repairs & maintenance
- −$1,212
- − Management
- −$1,212
- − Depreciation
- −$698
- Taxable income
- $5,089
- Est. tax owed @ 24.0%
- −$1,221
- After-tax cash flow
- $3,642/yr
For passive investors: Depreciation is non-cash, so a rental often shows a tax loss while cash-flowing — sheltering income. Rental losses are passive: they offset passive income freely, and up to $25,000/yr can offset ordinary (W-2) income if you actively participate and your MAGI is under $100k (phasing out to $0 by $150k); unused losses carry forward. On sale, claimed depreciation is recaptured at up to 25%, and gains may owe capital-gains tax (a 1031 exchange can defer both). Figures are a year-1 estimate at your 24.0% rate — not tax advice; consult a CPA.
Condition & rehab AI · 12 photos
This single-wide mobile home requires moderate repairs and maintenance to improve its condition and increase its resale and rental value.
Repairs flagged
- Major exterior siding — Severe weathering and peeling
- Major exterior paint — Peeling and chipping
- Major landscaping — Overgrown vegetation and debris
Value-add opportunities
- Both paint exterior — Enhances curb appeal and property value
- Both landscaping — Improves curb appeal and property value
- Both repair exterior siding — Restores property value and enhances curb appeal
Renovation cost estimate screening
| Repair item | Severity | Est. cost |
|---|---|---|
| exterior siding · Severe weathering and peeling | Major | $15,000–50,000 |
| exterior paint · Peeling and chipping | Major | $15,000–50,000 |
| landscaping · Overgrown vegetation and debris | Major | $15,000–50,000 |
| Total estimated repair cost · 3 items | $45,000–150,000 |
Value-add ROI direction
- Both paint exterior — Enhances curb appeal and property value ↑
- Both landscaping — Improves curb appeal and property value ↑
- Both repair exterior siding — Restores property value and enhances curb appeal ↑
ⓘ Cost ranges are severity-bucket heuristics (US national rule-of-thumb). Get contractor quotes + a written scope before underwriting a rehab budget.
Schools (NCES district)
- District
- Shasta Union High
- NCES district ID
- 0636600
- Math proficiency
- 41% ▲ 3.00%
- Reading proficiency
- 67% ▲ 9.00%
- Median HH income
- $50,080
- Composite
- 46.01/100
- National rank
- #2532
- State rank
- #122 of 517 in CA
Livability — Redding
- Score
- 76/100
- State rank
- #106
- US rank
- #3726
Category grades
Schools grade is shown separately in the Schools card above.
Census & demographics
- Census place
- Redding, CA
- County
- Shasta County · 147,641 people
- City population
- 112,523
- Metro
- Redding, CA
- Population (ZIP)
- 33,817
- Household income
- $72,484
- Rent vs Own
- Severe rent burden
- 1458.0
Population outlook (Shasta County) Hauer SSP2
- Today (2025)
- 179,231 people
- By 2030
- 176,953 · -1.3%
- By 2040
- 169,982 · -5.2%
- By 2050
- 162,547 · -9.3%
- By 2075
- 145,649 · -18.7%
- By 2100
- 123,025 · -31.4%
Race, ethnicity, and origin ACS 2023
- Neighborhood character
- Predominantly White (79%)
- Race & ethnicity
- White 79% Hispanic / Latino 10% Two or more races 10% Asian 2% Native American 1% Black 1%
- Hispanic origin (detail)
- Mexican 6%
- Common ancestry
- Italian 4% Lithuanian 3% Portuguese 2%
- Foreign-born
- 3% · Canada
- Languages at home
- 94% English-only · Spanish 3% Other Indo-European 1% Other Asian/Pacific 1%
Political lean MEDSL · Shasta
- 2024 margin
- Solid R (+36.5) · D 30.5% · R 67.0% · Other 2.5%
- 2008→2024 swing
- -10.7pp toward R · 2008: -25.8pp · 2024: -36.5pp
- All cycles
- 2024: R+36.5 2020: R+33.1 2016: R+37.4 2012: R+30.3 2008: R+25.8
Not yet ingested
- Civics
- —
Market trends
- HPI YoY
- ▼ -199.25%
- Current HPI
- 291.6191
- Rent YoY
- ▲ 7.55%
- Metro
- Redding, CA
- State GDP YoY
- ▲ 3.21%
- F500 in state
- 116
Industry mix (Fortune 500 HQ in CA)
| Industry | F500 HQs | Revenue |
|---|---|---|
| Technology | 27 | $1,492B |
|
||
| Financial Services | 3 | $174B |
|
||
| Retail | 3 | $44B |
|
||
| Insurance | 3 | $26B |
|
||
| Media / Entertainment | 2 | $115B |
|
||
| Pharmaceuticals / Biotech | 2 | $62B |
|
||
Price history
1 event — show timeline
- 2026-06-08 Listed $24,000 SAOR
Cash-flow waterfall
monthlySold comps — $/sqft
last 12 mo · ≤1 miLoading sold comps…